
非公認會計準則對賬 18 持續運營和已終止業務的毛利(虧損)與調整後的毛利率、燃料毛利率、每桶吞吐量的燃料毛利率、每桶吞吐量的運營費用、RIN調整後的燃料毛利率和RIN調整後的每桶吞吐量的燃料毛利率的未經審計的對賬
非公認會計準則對賬 19 持續運營和已終止業務的毛利(虧損)與調整後的毛利率、燃料毛利率、每桶吞吐量的燃料毛利率、每桶吞吐量的運營費用、RIN調整後的燃料毛利率和RIN調整後的每桶吞吐量的燃料毛利率的未經審計的對賬
非公認會計準則對賬 20 未經審計的持續和已終止業務的毛利(虧損)與調整後的毛利率、燃料毛利率、每桶吞吐量的燃料毛利率、每桶吞吐量的運營費用、RIN 調整後的燃料毛利率和 RIN 調整後的每桶吞吐量的燃料毛利率對賬

非公認會計準則對賬 21 未經審計的息税折舊攤銷前利潤和調整後息税折舊攤銷前利潤與持續和已終止業務淨虧損的對賬

非公認會計準則對賬 22 未經審計的息税折舊攤銷前利潤和調整後息税折舊攤銷前利潤與持續和已終止業務淨虧損的對賬[非公認會計準則對賬 23 未經審計的息税折舊攤銷前利潤和調整後息税折舊攤銷前利潤與持續和已終止業務淨虧損的對賬

非公認會計準則對賬 24 未經審計的息税折舊攤銷前利潤和調整後息税折舊攤銷前利潤與持續和已終止業務淨虧損的對賬
非公認會計準則對賬 25 未經審計的息税折舊攤銷前利潤和調整後息税折舊攤銷前利潤與持續和已終止業務淨虧損的對賬移動煉油廠遺產煉油與營銷總額煉油和營銷黑油和回收公司合併淨收益(虧損)(23,961) 美元 (26,015) 美元 (14,904) 美元 (64,590) 折舊和攤銷 3,722 251 3,990 73 3,315 246 7,534 所得税支出(福利)------利息支出 3,250-3,250 44,469 4,235 51,954 息税折舊攤銷前利潤美元 (16,989) 541 美元 (16,448) 21,769 美元 (10,423) 美元 (5,102)套期保值活動未實現(收益)虧損 46,901-46,901(268.00)-46,633 庫存估值調整 23,180-23,180-23,180 衍生權證負債價值變動收益--945.00 3,579 4524 股票薪酬--324.00 250 574(收益)出售資產虧損--(415)-(415)) 收購成本 9,078-9,078-4,560 13,638 環境清理 1,428-1,428--1,428 其他 (19)-(19) (128.00)-(147) 調整後的息税折舊攤銷前利潤 63,579 美元 541 美元 64,120 美元 22,227 美元 (2,034) 截至2022年6月30日的六個月 84,313 美元
非公認會計準則對賬 26 未經審計的長期債務與淨長期債務對賬以及淨負債比率 2023 年 6 月 30 日 2022 年 6 月 30 日 2022 年 12 月 31 日長期債務:優先可轉換票據 15,230 美元 41,543 美元 95,178 2025 定期貸款 150,075 165,000 165,000 融資租賃負債長期 67,290 44,640 45,164 運營租賃負債短期 2,320 652 1,363 長期 66,914 3,816 44,545 經營租賃負債短期 25,588 953 953 9,012 長期債務和租賃債務 327,417 美元 256,604 美元 360,262未攤銷的折扣和遞延融資成本 (33,402) (37,035) (81,918) 保險費為每張資產負債表9,995 9,236 5,602筆長期債務和租賃債務融資 304,010$ 228,805美元 283,946美元現金及現金等價物 (48,532) (97,914) (141,248) 限制性現金 (3,603) (100) (100) (4,929) 現金及現金等價物總額 (52,135) 美元 (98,014) 美元 (146,177) 淨長期負債 275,282$ 158,590$ 214,085$ 調整後的息税折舊攤銷前利潤 77,477 美元 95,280 美元 161,000 美元截至淨負債比率 3.6x 1.7 倍 1.3 倍
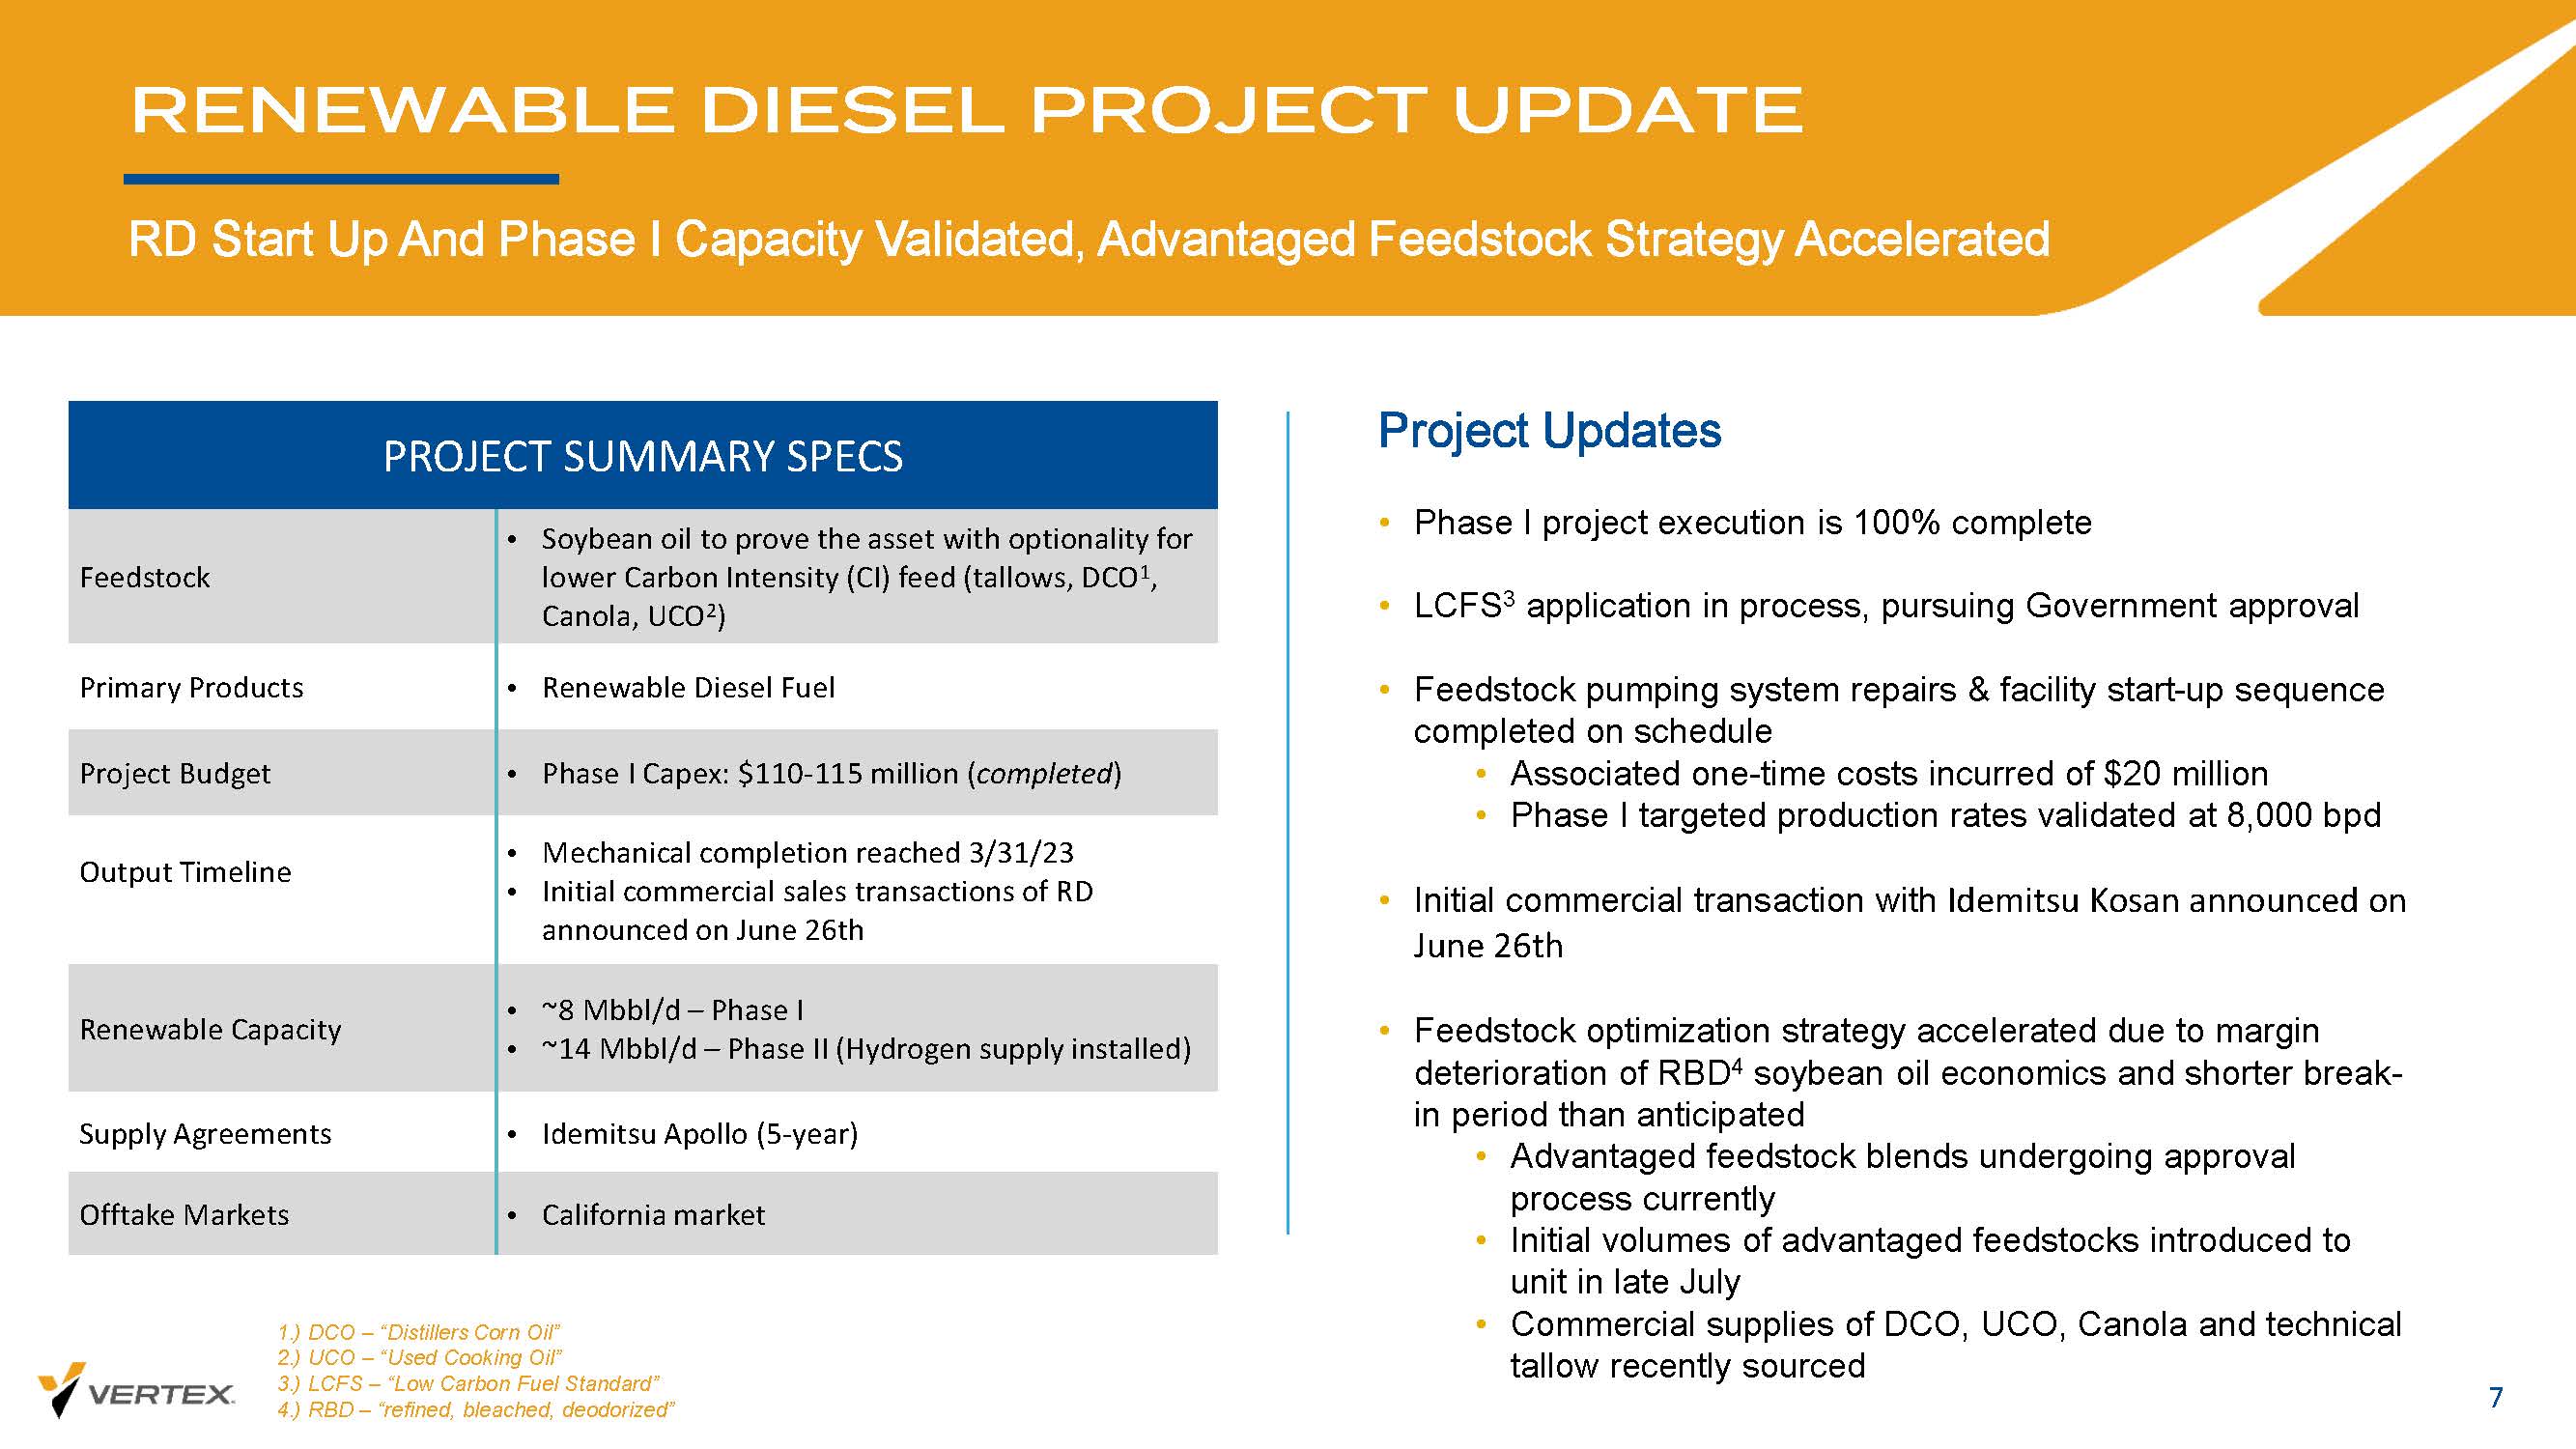
RENEWABLE DIESEL PROJECT UPDATE 7 RD Start Up And Phase I Capacity Validated, Advantaged Feedstock Strategy Accelerated • Soybean oil to prove the asset with optionality for lower Carbon Intensity (CI) feed (tallows, DCO 1 , Canola, UCO 2 ) Feedstock • Renewable Diesel Fuel Primary Products • Phase I Capex: $110 - 115 million ( completed ) Project Budget • Mechanical completion reached 3/31/23 • Initial commercial sales transactions of RD announced on June 26th Output Timeline • ~8 Mbbl /d – Phase I • ~14 Mbbl /d – Phase II (Hydrogen supply installed) Renewable Capacity • Idemitsu Apollo (5 - year) Supply Agreements • California market Offtake Markets PROJECT SUMMARY SPECS Project Updates • Phase I project execution is 100% complete • LCFS 3 application in process, pursuing Government approval • Feedstock pumping system repairs & facility start - up sequence completed on schedule • Associated one - time costs incurred of $20 million • Phase I targeted production rates validated at 8,000 bpd • Initial commercial transaction with Idemitsu Kosan announced on June 26th • Feedstock optimization strategy accelerated due to margin deterioration of RBD 4 soybean oil economics and shorter break - in period than anticipated • Advantaged feedstock blends undergoing approval process currently • Initial volumes of advantaged feedstocks introduced to unit in late July • Commercial supplies of DCO, UCO, Canola and technical tallow recently sourced 1.) DCO – “Distillers Corn Oil” 2.) UCO – “Used Cooking Oil” 3.) LCFS – “Low Carbon Fuel Standard” 4.) RBD – “refined, bleached, deodorized”
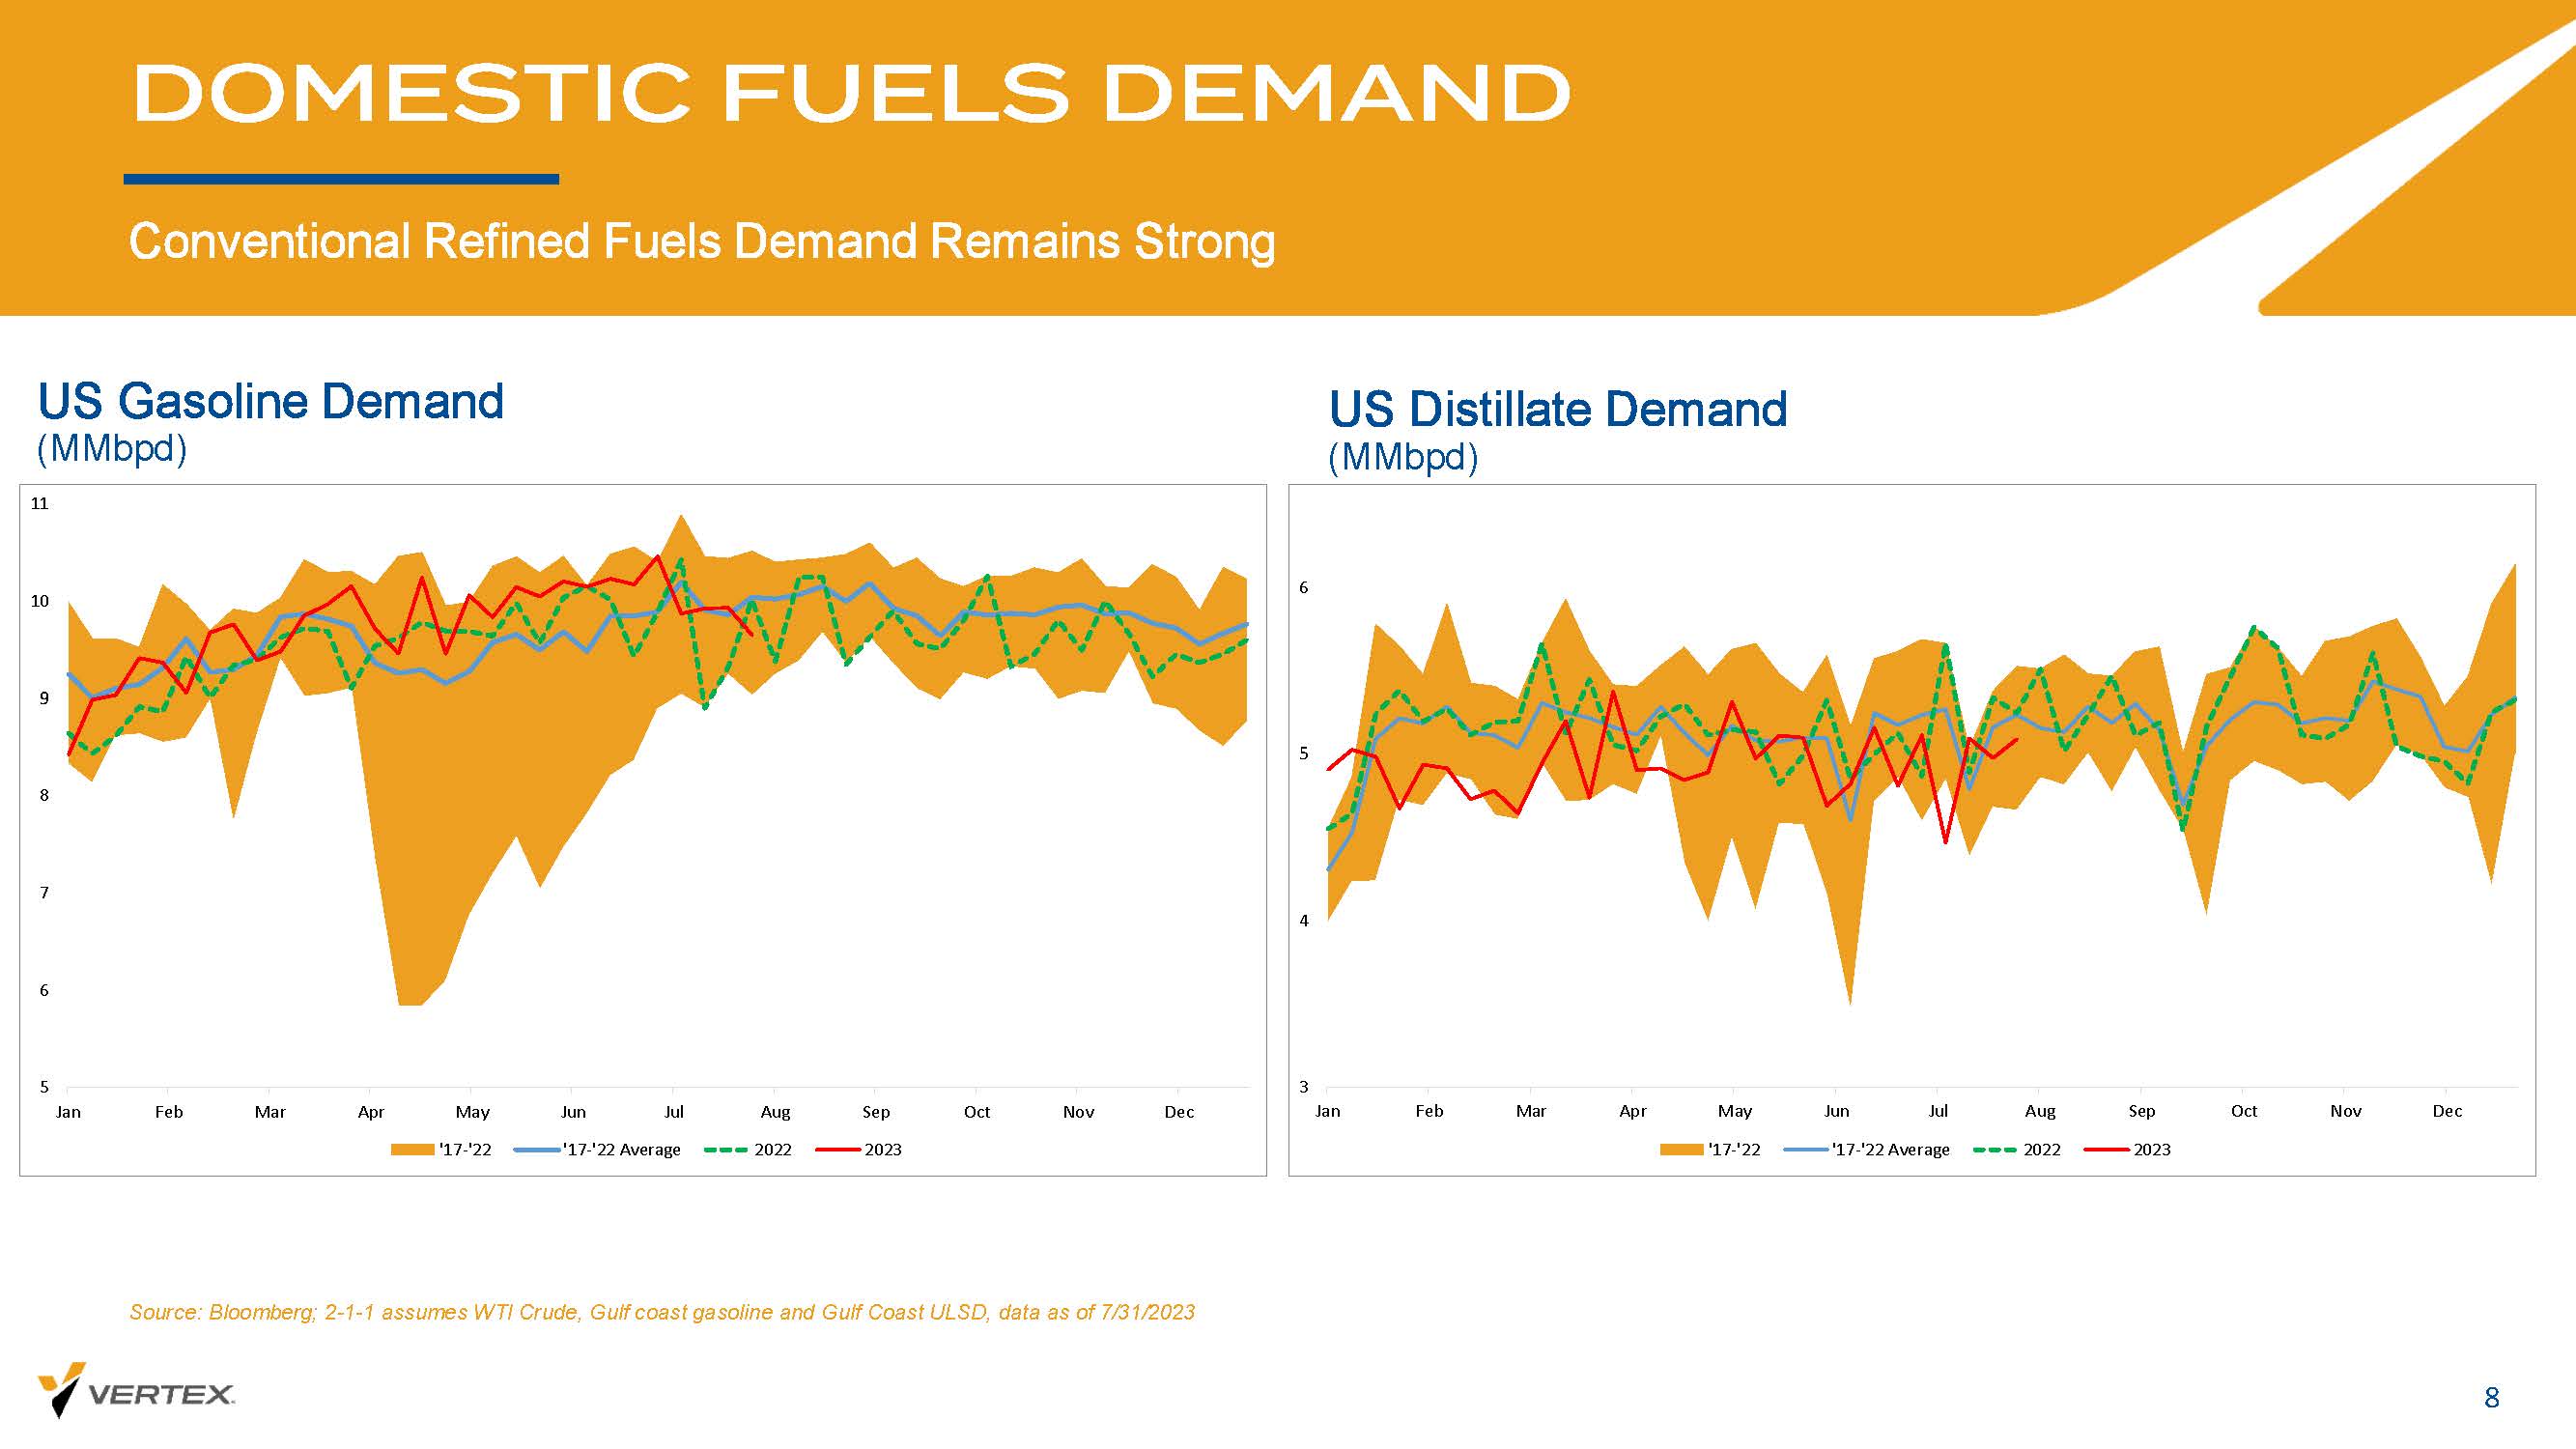
DOMESTIC FUELS DEMAND Conventional Refined Fuels Demand Remains Strong 8 US Gasoline Demand ( MMbpd ) US Distillate Demand ( MMbpd ) Source: Bloomberg; 2 - 1 - 1 assumes WTI Crude, Gulf coast gasoline and Gulf Coast ULSD, data as of 7/31/2023 5 6 7 8 9 10 11 Jan Feb Mar Apr May Jun Jul Aug Sep Oct Nov Dec '17-'22 '17-'22 Average 2022 2023 3 4 5 6 Jan Feb Mar Apr May Jun Jul Aug Sep Oct Nov Dec '17-'22 '17-'22 Average 2022 2023
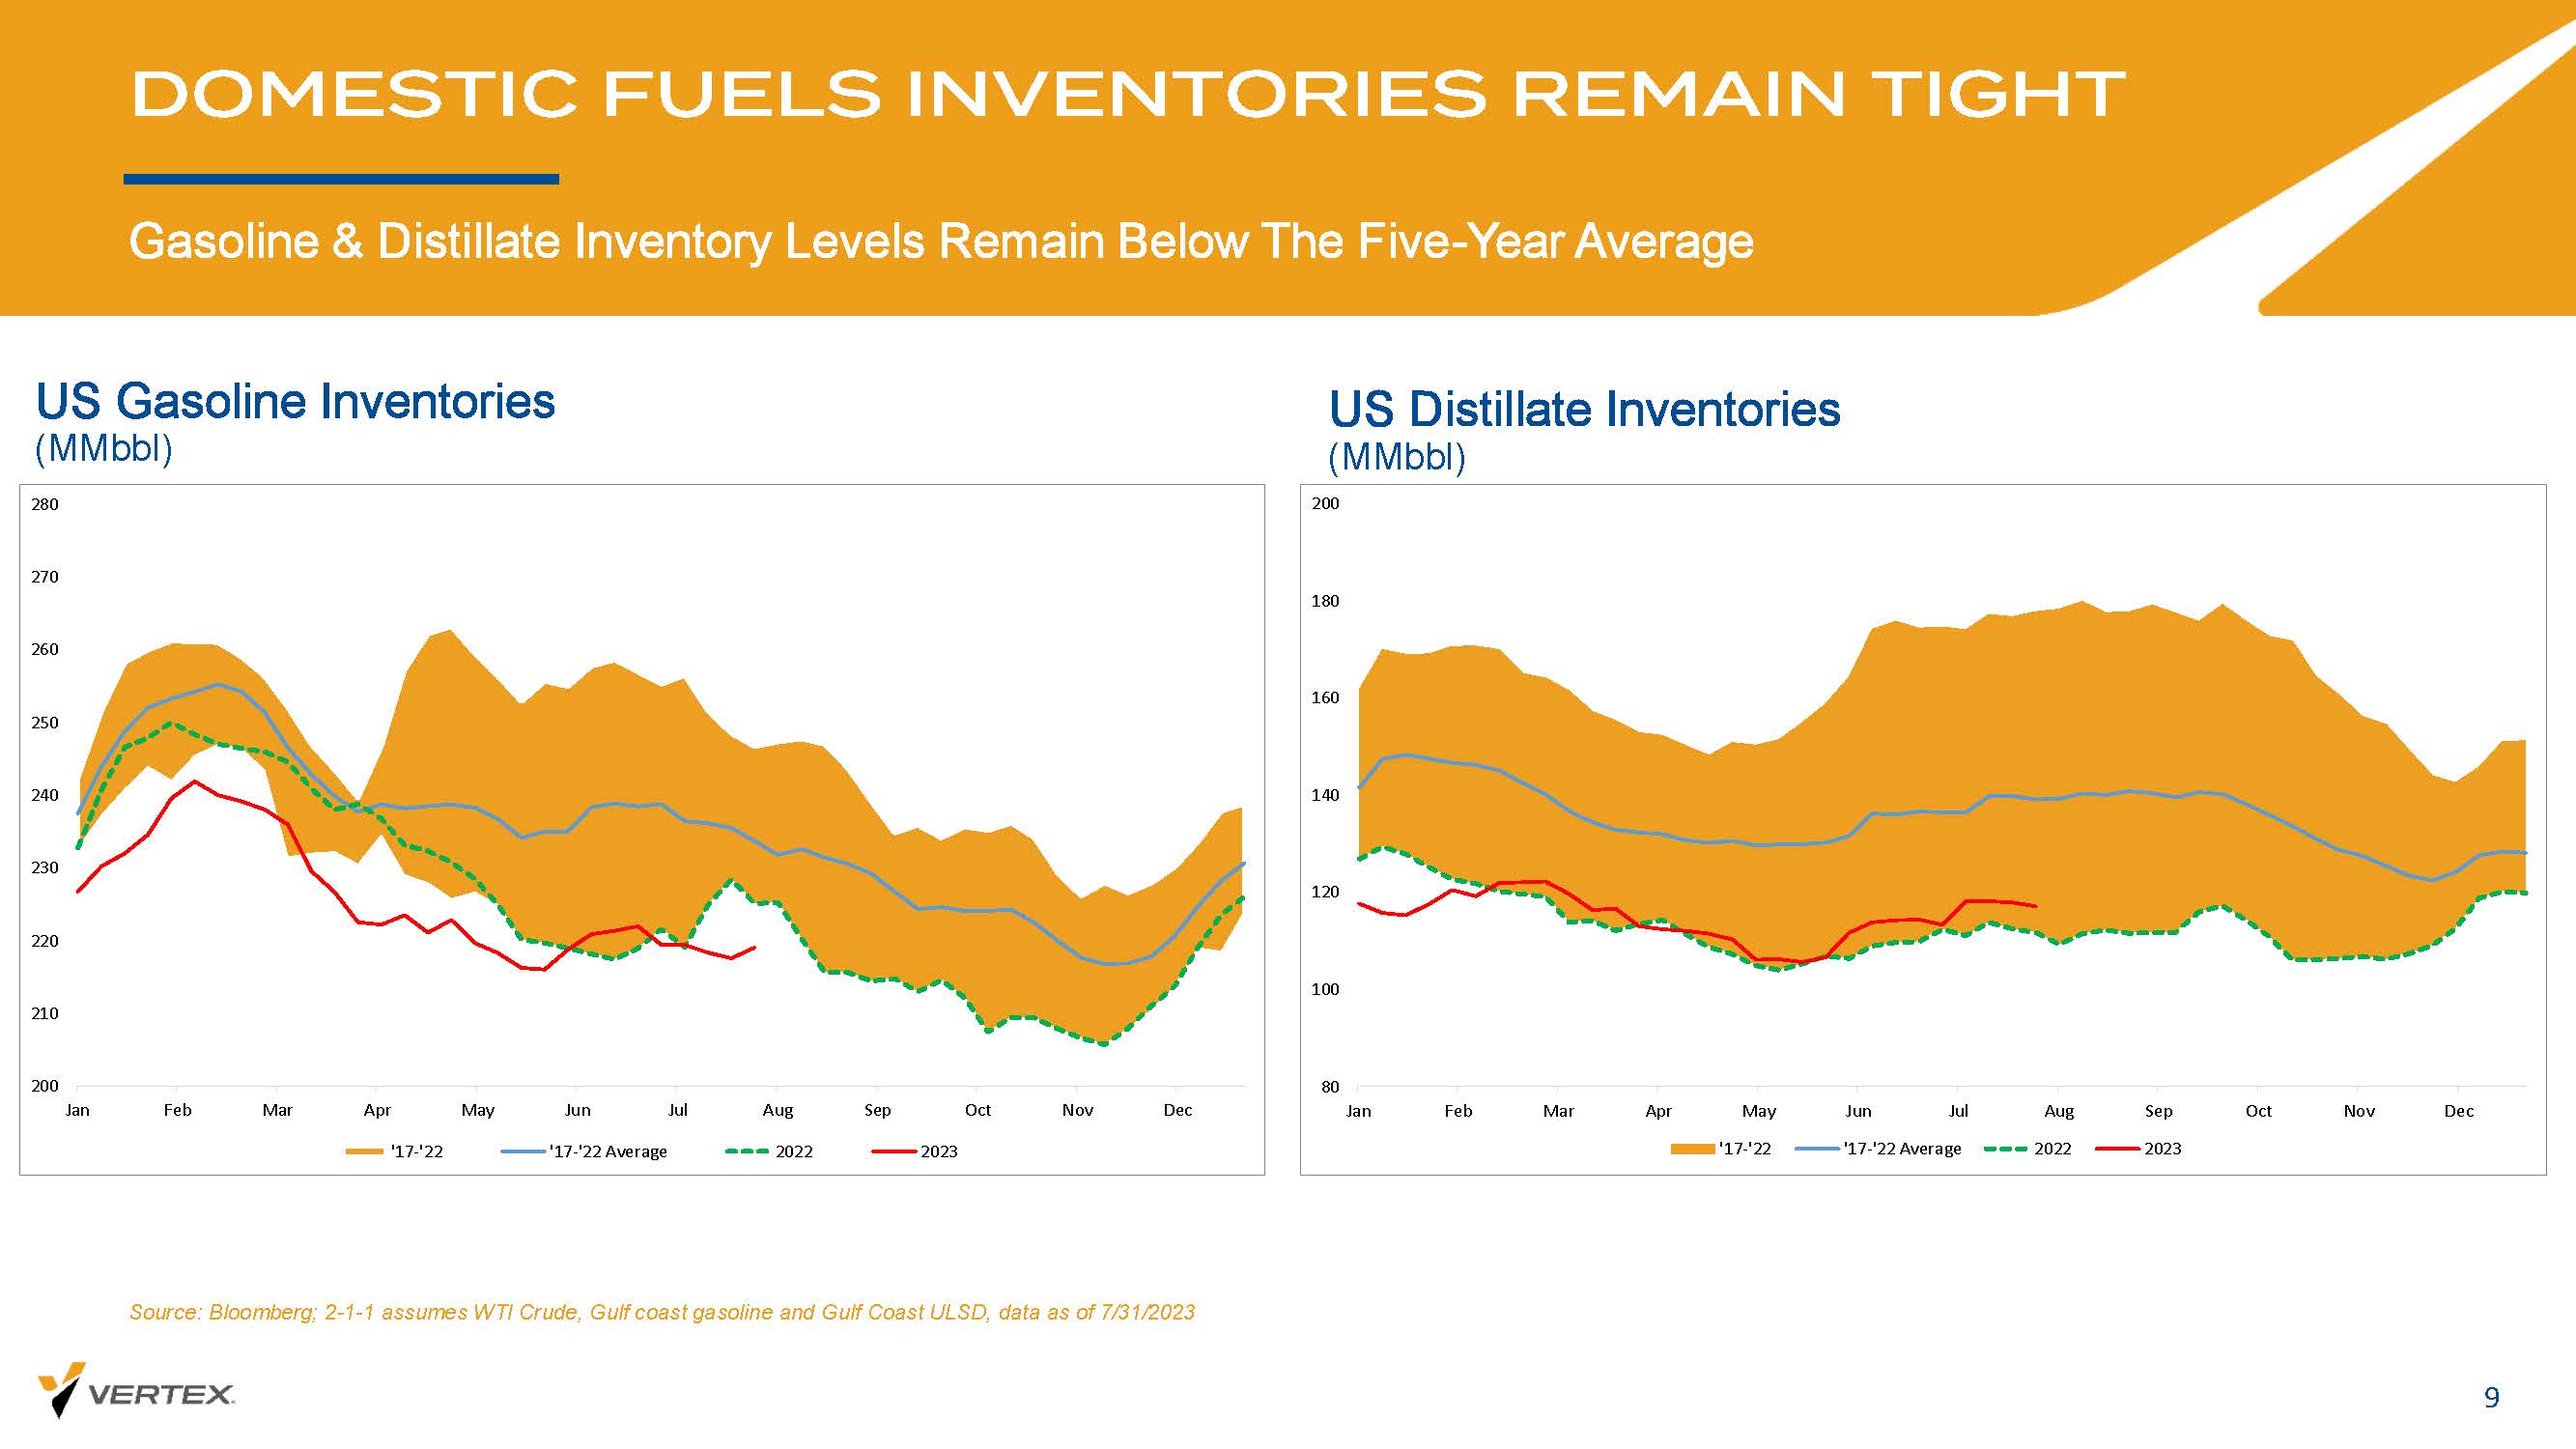
DOMESTIC FUELS INVENTORIES REMAIN TIGHT Gasoline & Distillate Inventory Levels Remain Below The Five - Year Average US Gasoline Inventories 9 ( MMbbl ) US Distillate Inventories ( MMbbl ) Source: Bloomberg; 2 - 1 - 1 assumes WTI Crude, Gulf coast gasoline and Gulf Coast ULSD, data as of 7/31/2023 80 100 120 140 160 180 200 Jan Feb Mar Apr May Jun Jul Aug Sep Oct Nov Dec '17-'22 '17-'22 Average 2022 2023 200 210 220 230 240 250 260 270 280 Jan Feb Mar Apr May Jun Jul Aug Sep Oct Nov Dec '17-'22 '17-'22 Average 2022 2023

DOMESTIC FUELS PRODUCTION LEVELS Production Levels In - Line With Historical Averages US Conventional Gasoline Production 10 ( MMbpd ) US Distillate Production ( MMbpd ) Source: Bloomberg; 2 - 1 - 1 assumes WTI Crude, Gulf coast gasoline and Gulf Coast ULSD, data as of 7/31/2023 2.5 3.0 3.5 4.0 4.5 5.0 5.5 6.0 6.5 Jan Feb Mar Apr May Jun Jul Aug Sep Oct Nov Dec '17-'22 '17-'22 Average 2022 2023 5.0 6.0 7.0 8.0 9.0 10.0 11.0 12.0 Jan Feb Mar Apr May Jun Jul Aug Sep Oct Nov Dec '17-'22 '17-'22 Average 2022 2023

REFINED PRODUCT MARGINS RETREATING FROM RECENT HIGHS Tight Inventories, Robust Demand Remain Supportive 11 Gulf Coast 2 - 1 - 1 Crack Spread 2023 - to - Date Source: Bloomberg; 2 - 1 - 1 assumes WTI Crude, Gulf coast gasoline and Gulf Coast ULSD, data as of 7/31/2023 Gulf Coast 2 - 1 - 1 Crack Spread Long - Term Performance $0 $10 $20 $30 $40 $50 $60 $15 $20 $25 $30 $35 $40 $45
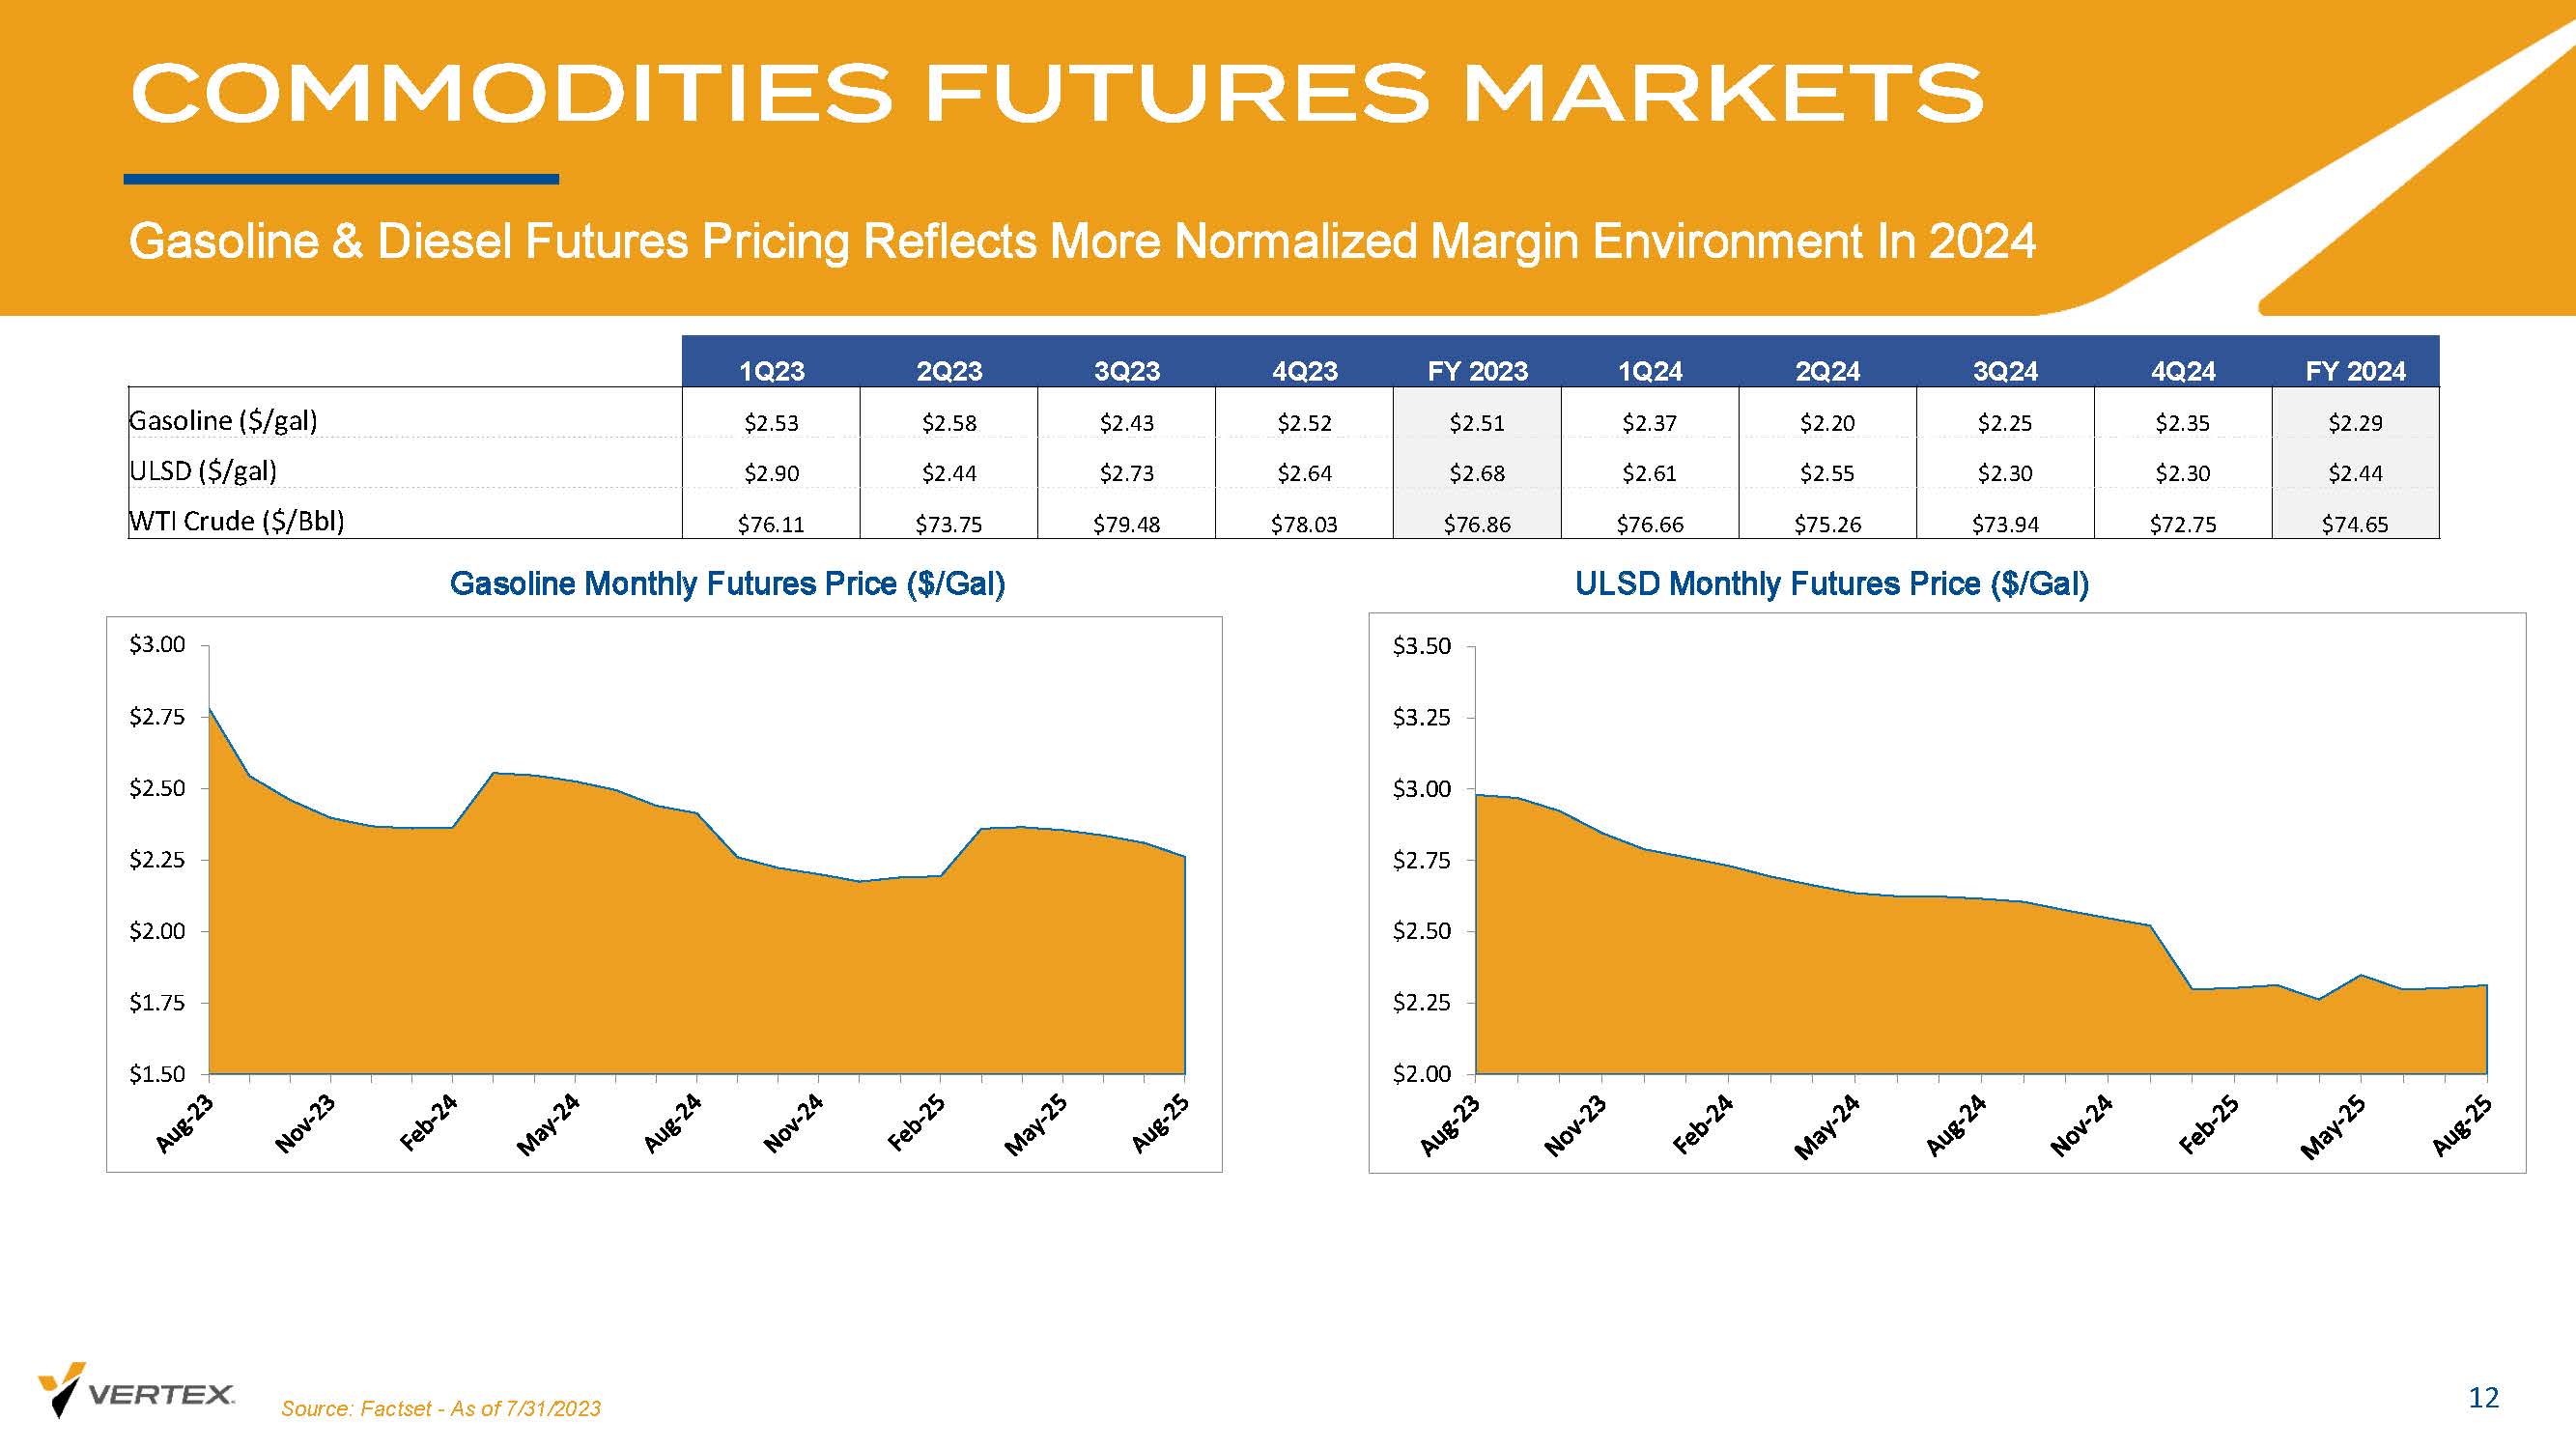
COMMODITIES FUTURES MARKETS Gasoline & Diesel Futures Pricing Reflects More Normalized Margin Environment In 2024 12 Gasoline Monthly Futures Price ($/Gal) ULSD Monthly Futures Price ($/Gal) Source: Factset - As of 7/31/2023 $1.50 $1.75 $2.00 $2.25 $2.50 $2.75 $3.00 $2.00 $2.25 $2.50 $2.75 $3.00 $3.25 $3.50 1Q23 2Q23 3Q23 4Q23 FY 2023 1Q24 2Q24 3Q24 4Q24 FY 2024 Gasoline ($/gal) $2.53 $2.58 $2.43 $2.52 $2.51 $2.37 $2.20 $2.25 $2.35 $2.29 ULSD ($/gal) $2.90 $2.44 $2.73 $2.64 $2.68 $2.61 $2.55 $2.30 $2.30 $2.44 WTI Crude ($/Bbl) $76.11 $73.75 $79.48 $78.03 $76.86 $76.66 $75.26 $73.94 $72.75 $74.65
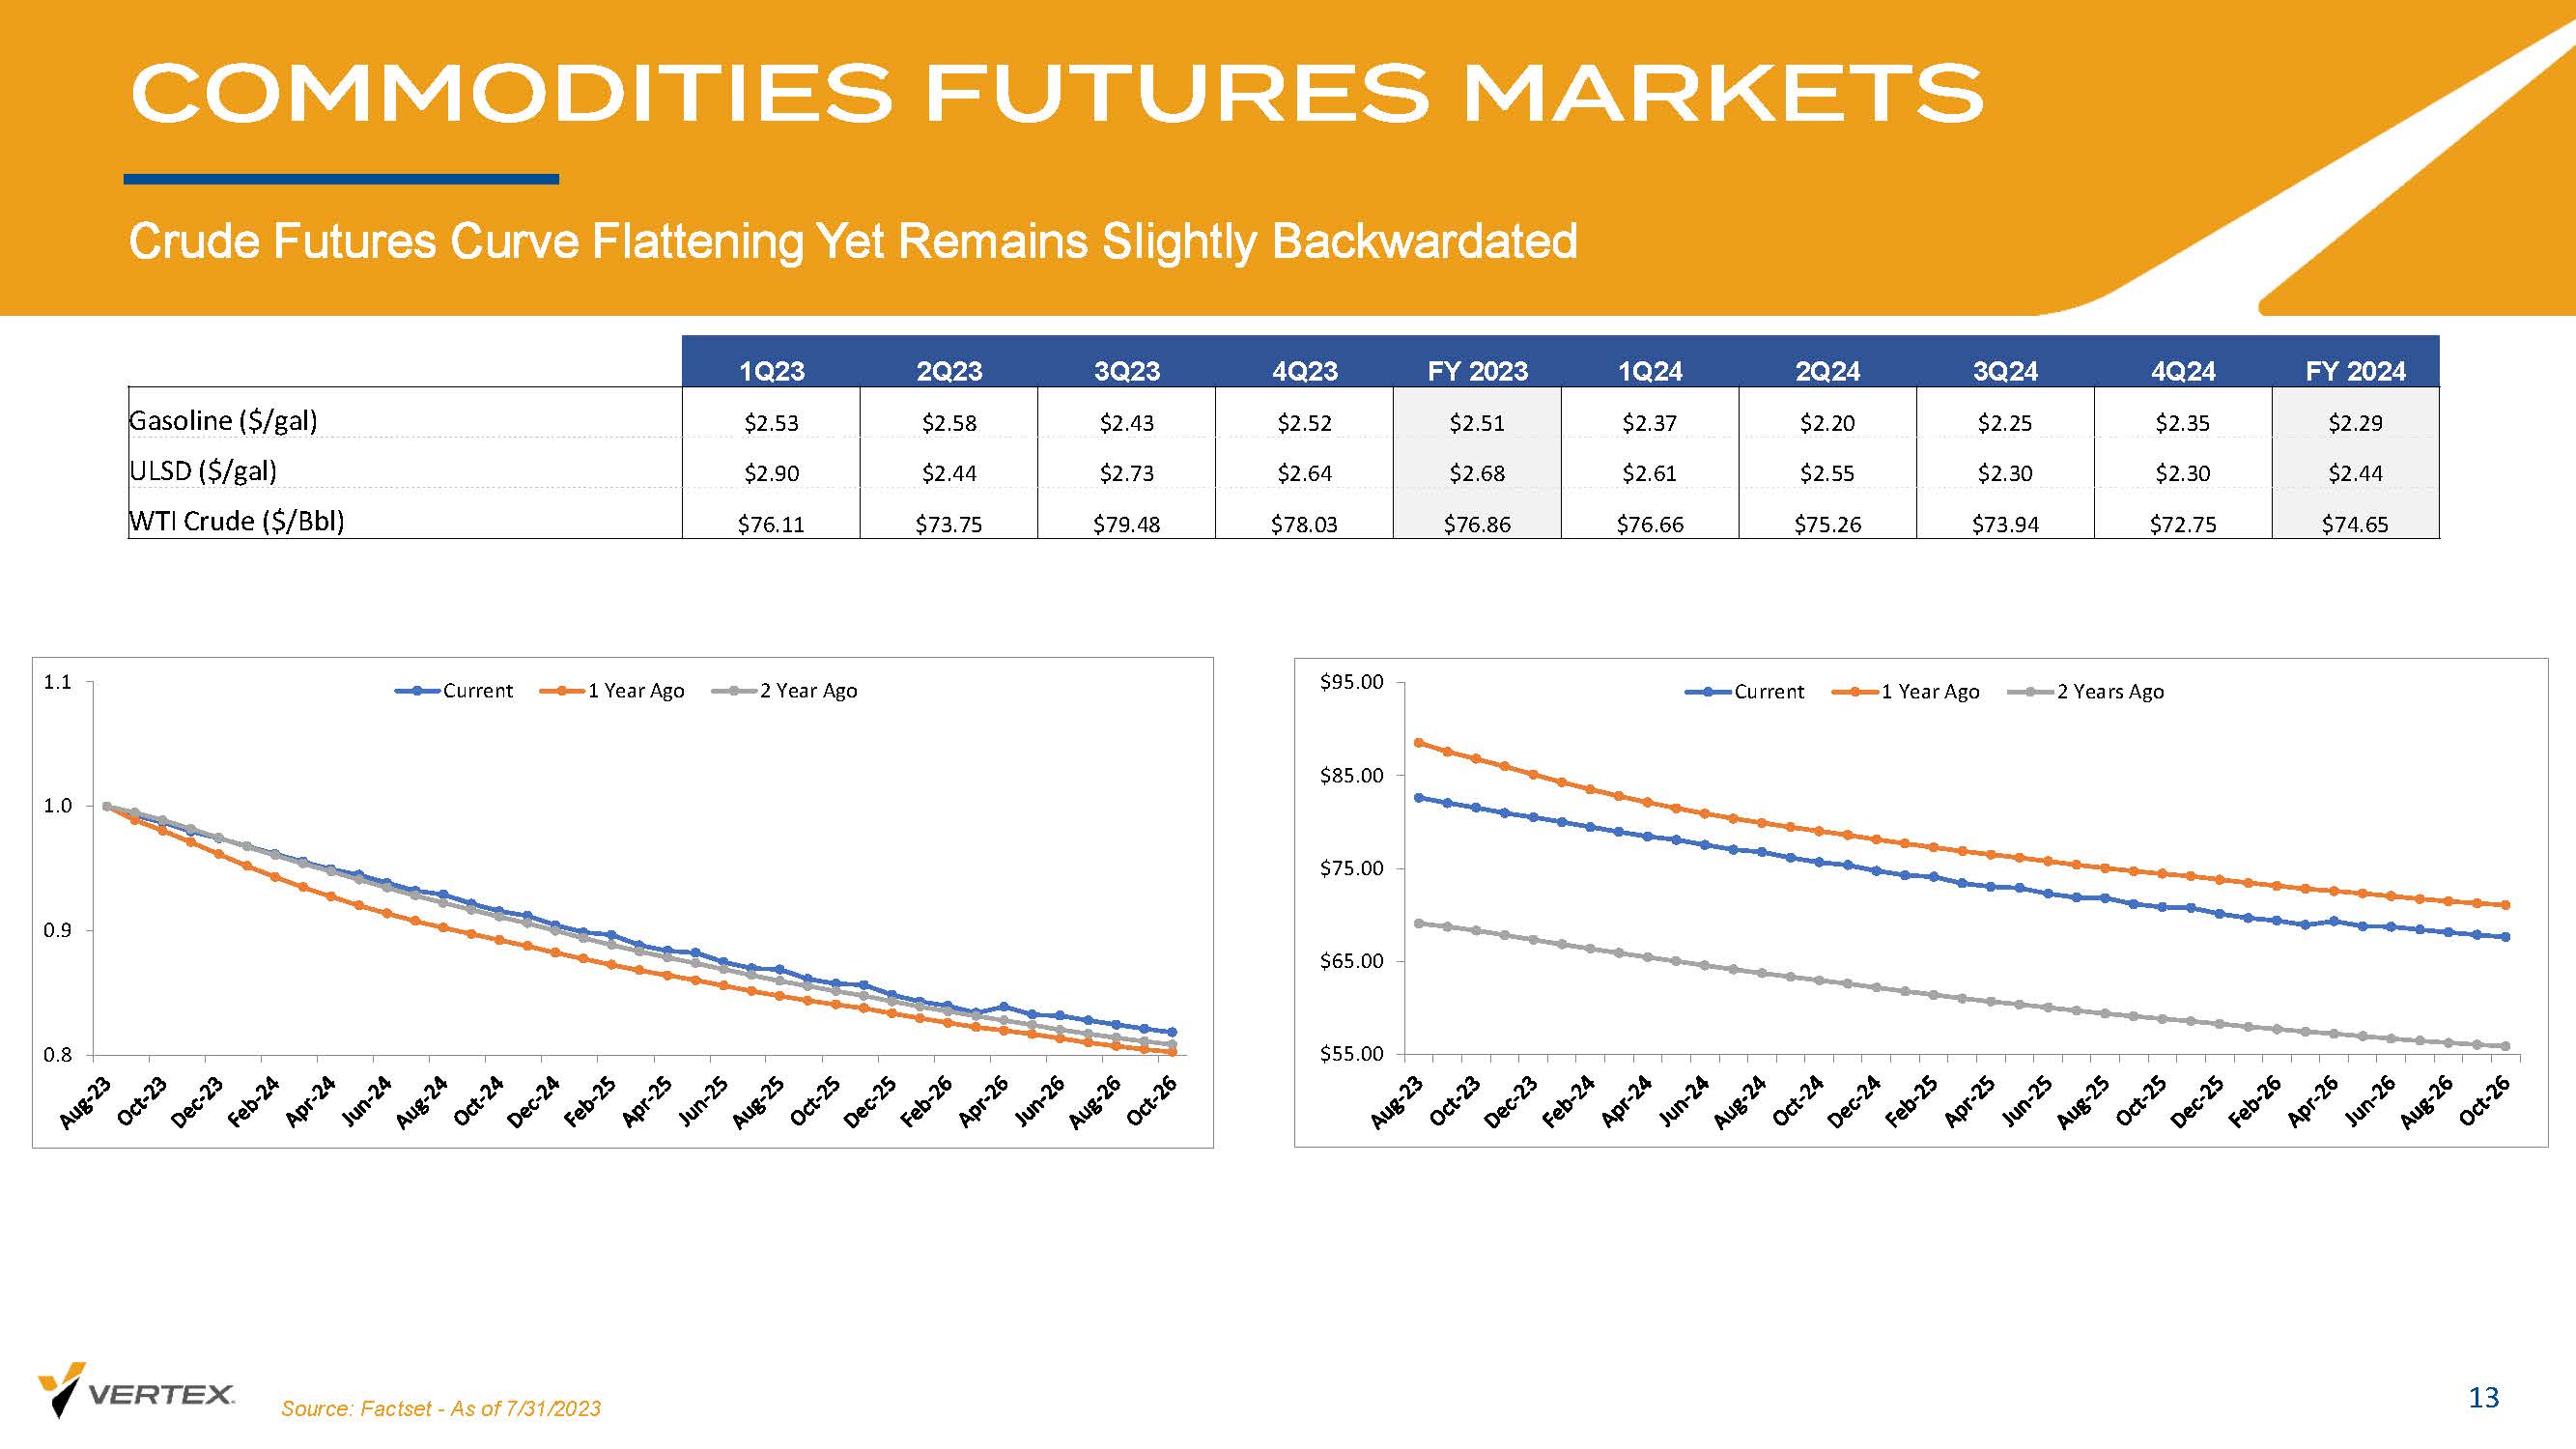
Crude Futures Curve Flattening Yet Remains Slightly Backwardated 13 COMMODITIES FUTURES MARKETS Source: Factset - As of 7/31/2023 0.8 0.9 1.0 1.1 Current 1 Year Ago 2 Year Ago $55.00 $65.00 $75.00 $85.00 $95.00 Current 1 Year Ago 2 Years Ago 1Q23 2Q23 3Q23 4Q23 FY 2023 1Q24 2Q24 3Q24 4Q24 FY 2024 Gasoline ($/gal) $2.53 $2.58 $2.43 $2.52 $2.51 $2.37 $2.20 $2.25 $2.35 $2.29 ULSD ($/gal) $2.90 $2.44 $2.73 $2.64 $2.68 $2.61 $2.55 $2.30 $2.30 $2.44 WTI Crude ($/Bbl) $76.11 $73.75 $79.48 $78.03 $76.86 $76.66 $75.26 $73.94 $72.75 $74.65
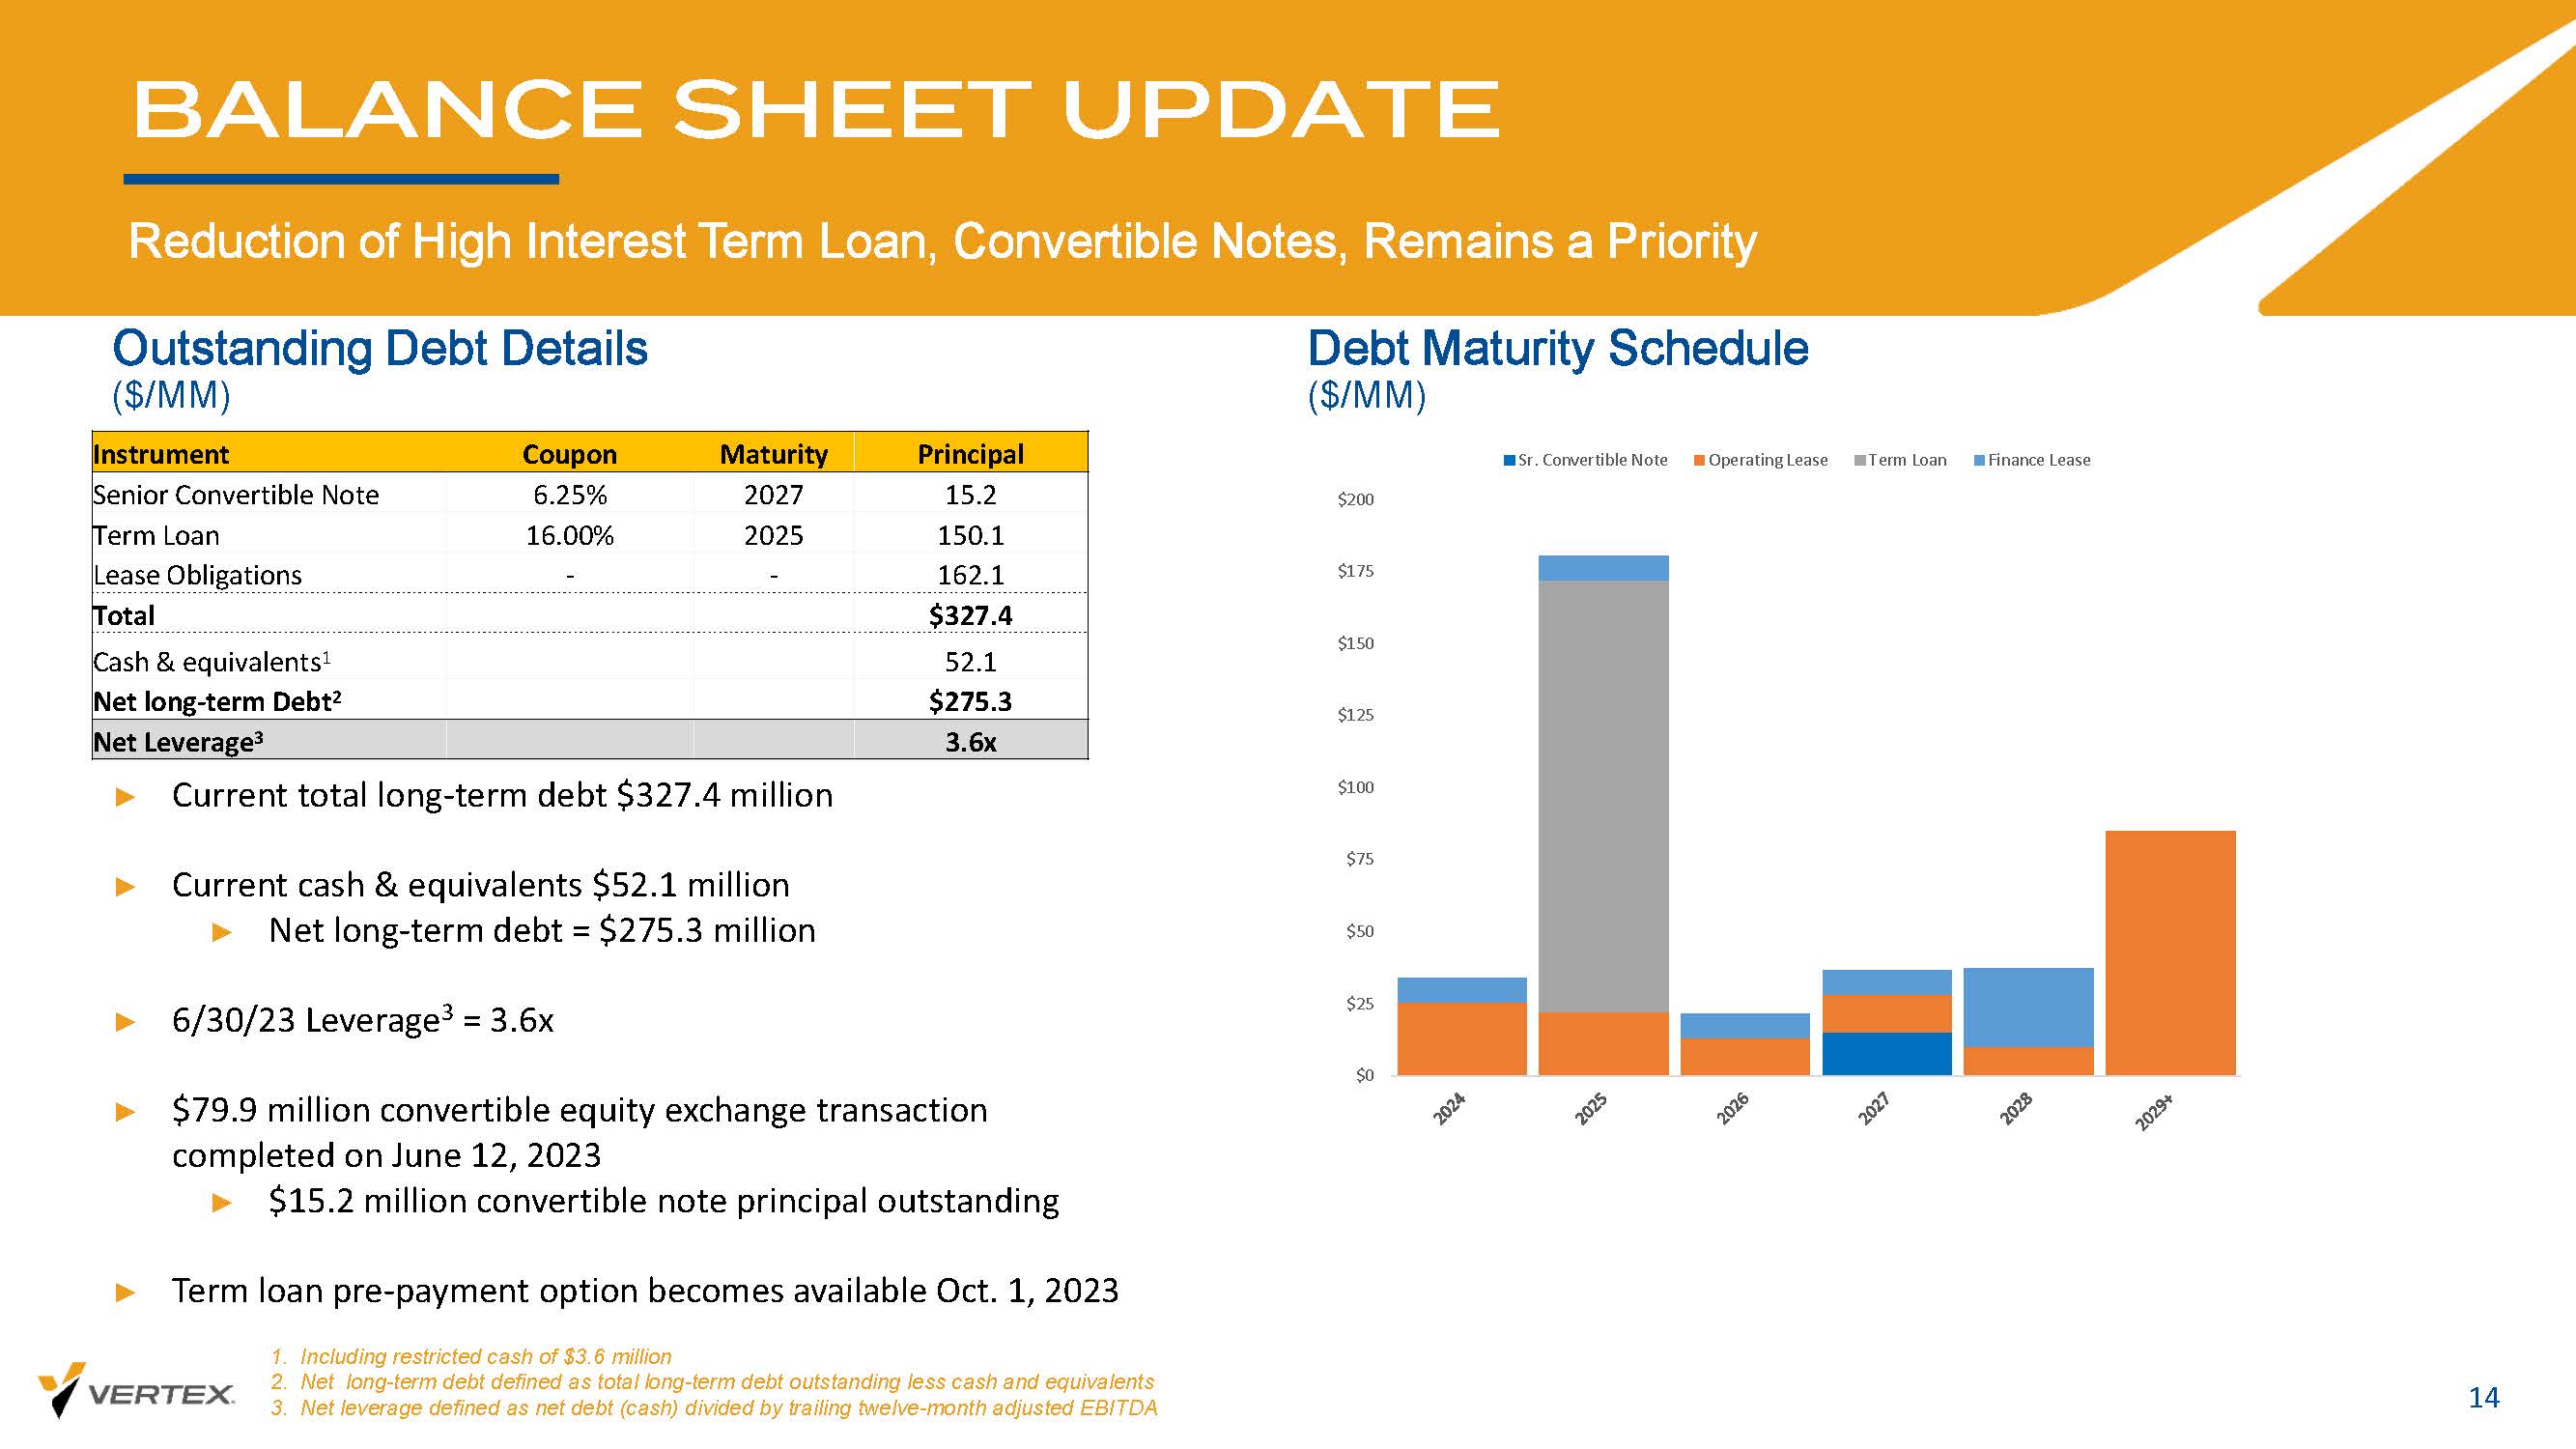
BALANCE SHEET UPDATE Reduction of High Interest Term Loan, Convertible Notes, Remains a Priority 14 Outstanding Debt Details ($/MM) Debt Maturity Schedule ($/MM) ► Current total long - term debt $327.4 million ► Current cash & equivalents $52.1 million ► Net long - term debt = $275.3 million ► 6/30/23 Leverage 3 = 3.6x ► $79.9 million convertible equity exchange transaction completed on June 12, 2023 ► $15.2 million convertible note principal outstanding ► Term loan pre - payment option becomes available Oct. 1, 2023 1. Including restricted cash of $3.6 million 2. Net long - term debt defined as total long - term debt outstanding less cash and equivalents 3. Net leverage defined as net debt (cash) divided by trailing twelve - month adjusted EBITDA Principal Maturity Coupon Instrument 15.2 2027 6.25% Senior Convertible Note 150.1 2025 16.00% Term Loan 162.1 - - Lease Obligations $327.4 Total 52.1 Cash & equivalents 1 $275.3 Net long - term Debt 2 3.6x Net Leverage 3
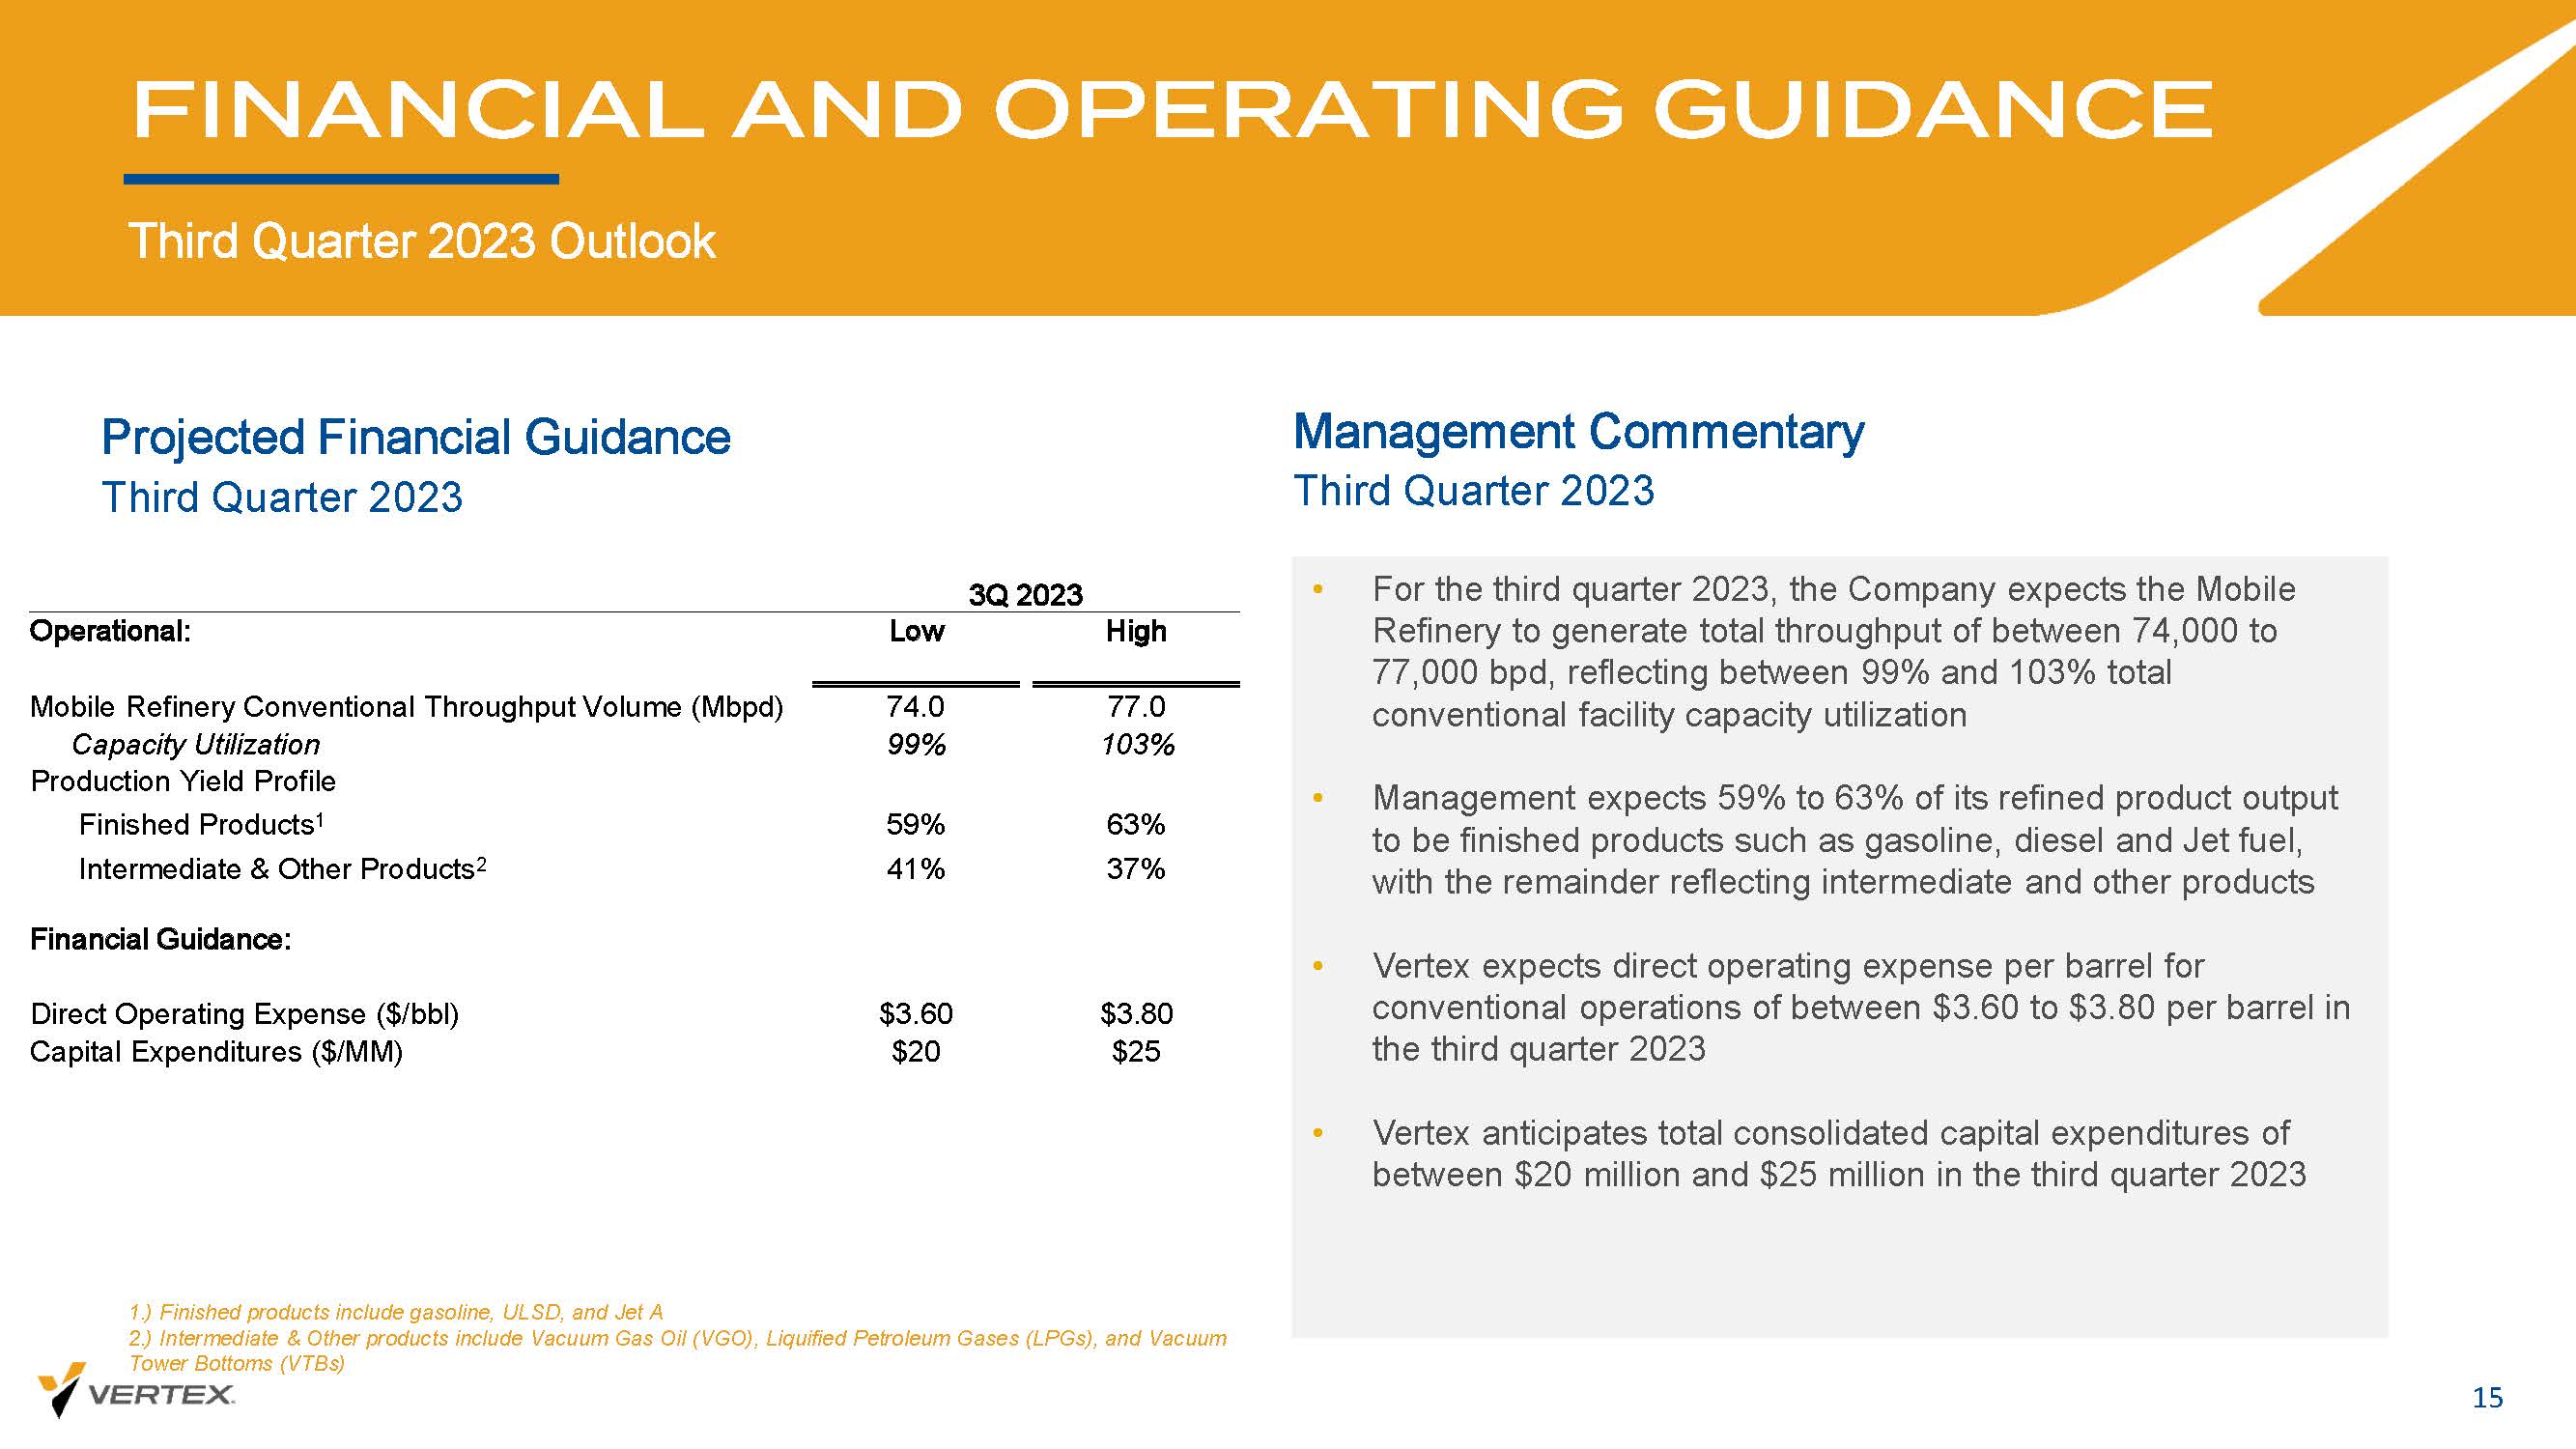
Projected Financial Guidance FINANCIAL AND OPERATING GUIDANCE Third Quarter 2023 Outlook 15 Management Commentary • For the third quarter 2023, the Company expects the Mobile Refinery to generate total throughput of between 74,000 to 77,000 bpd, reflecting between 99% and 103% total conventional facility capacity utilization • Management expects 59% to 63% of its refined product output to be finished products such as gasoline, diesel and Jet fuel, with the remainder reflecting intermediate and other products • Vertex expects direct operating expense per barrel for conventional operations of between $3.60 to $3.80 per barrel in the third quarter 2023 • Vertex anticipates total consolidated capital expenditures of between $20 million and $25 million in the third quarter 2023 Third Quarter 2023 Third Quarter 2023 3Q 2023 High Low Operational: 77.0 74.0 Mobile Refinery Conventional Throughput Volume (Mbpd) 103% 99% Capacity Utilization Production Yield Profile 63% 59% Finished Products 1 37% 41% Intermediate & Other Products 2 Financial Guidance: $3.80 $3.60 Direct Operating Expense ($/bbl) $25 $20 Capital Expenditures ($/MM) 1.) Finished products include gasoline, ULSD, and Jet A 2.) Intermediate & Other products include Vacuum Gas Oil (VGO), Liquified Petroleum Gases (LPGs), and Vacuum Tower Bottoms (VTBs)
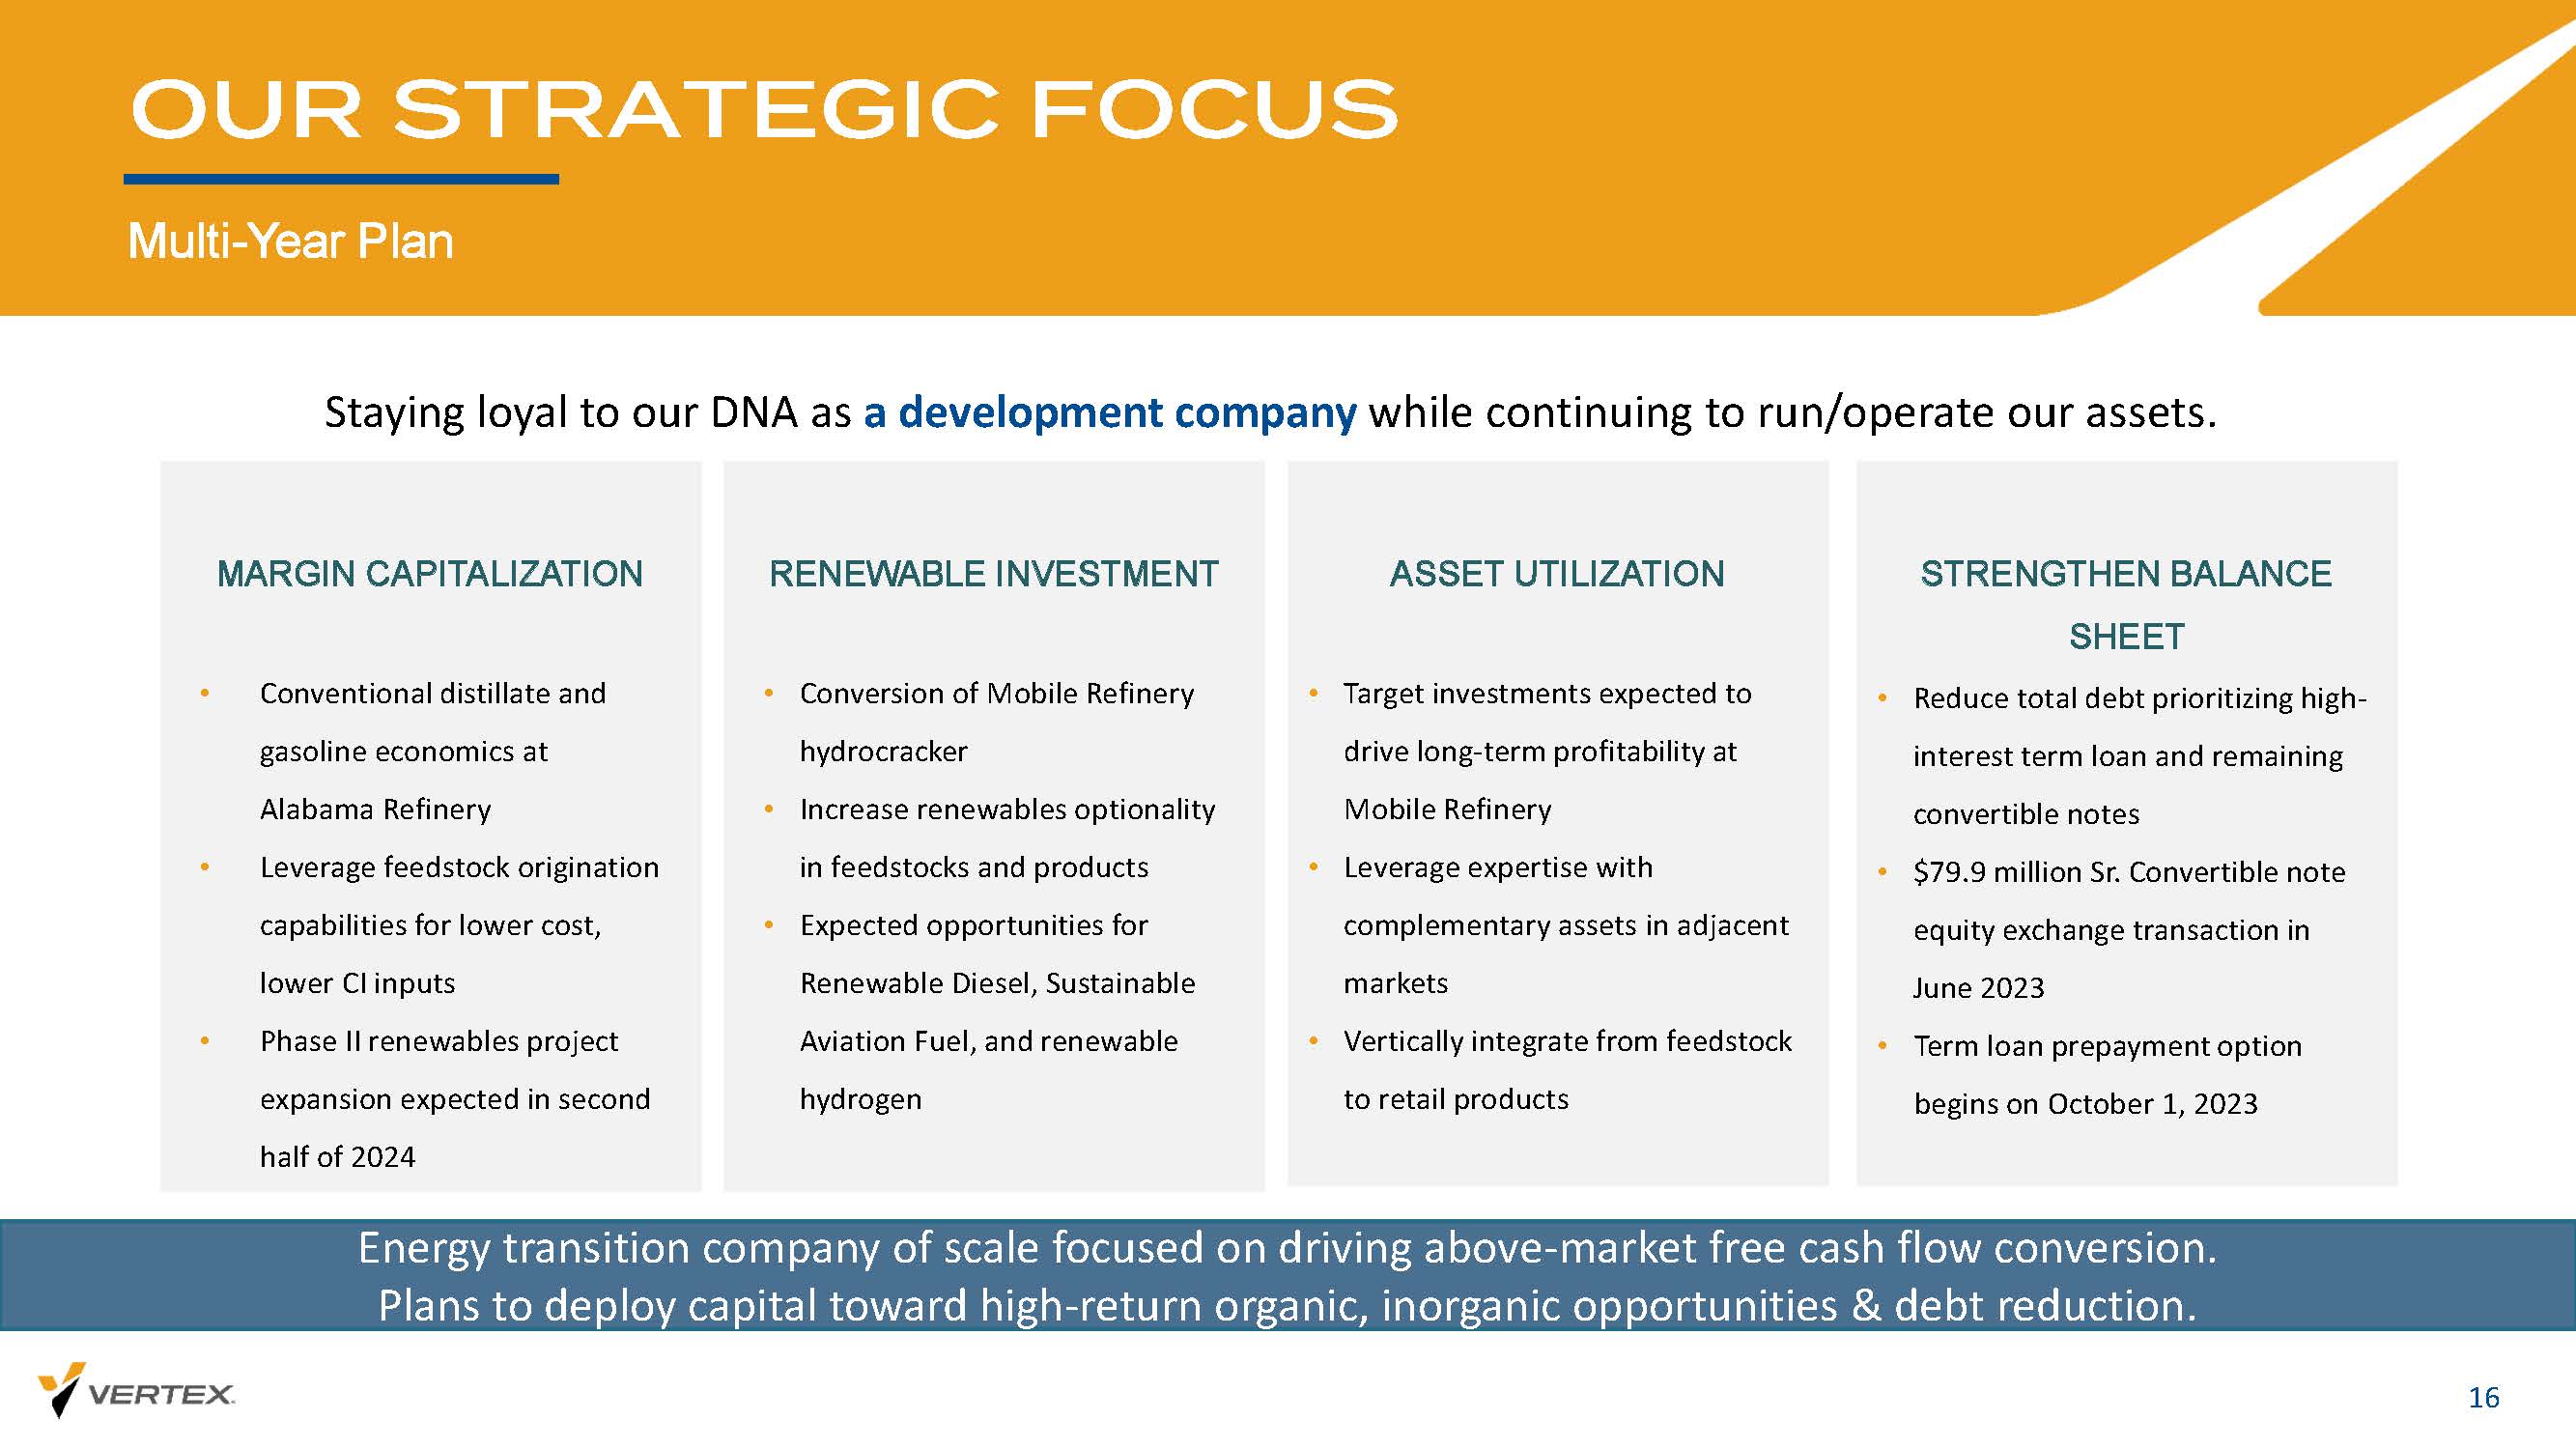
OUR STRATEGIC FOCUS Multi - Year Plan 16 ASSET UTILIZATION • Target investments expected to drive long - term profitability at Mobile Refinery • Leverage expertise with complementary assets in adjacent markets • Vertically integrate from feedstock to retail products MARGIN CAPITALIZATION • Conventional distillate and gasoline economics at Alabama Refinery • Leverage feedstock origination capabilities for lower cost, lower CI inputs • Phase II renewables project expansion expected in second half of 2024 RENEWABLE INVESTMENT • Conversion of Mobile Refinery hydrocracker • Increase renewables optionality in feedstocks and products • Expected opportunities for Renewable Diesel, Sustainable Aviation Fuel, and renewable hydrogen STRENGTHEN BALANCE SHEET • Reduce total debt prioritizing high - interest term loan and remaining convertible notes • $79.9 million Sr. Convertible note equity exchange transaction in June 2023 • Term loan prepayment option begins on October 1, 2023 Energy transition company of scale focused on driving above - market free cash flow conversion. Plans to deploy capital toward high - return organic, inorganic opportunities & debt reduction. Staying loyal to our DNA as a development company while continuing to run/operate our assets.

APPENDIX
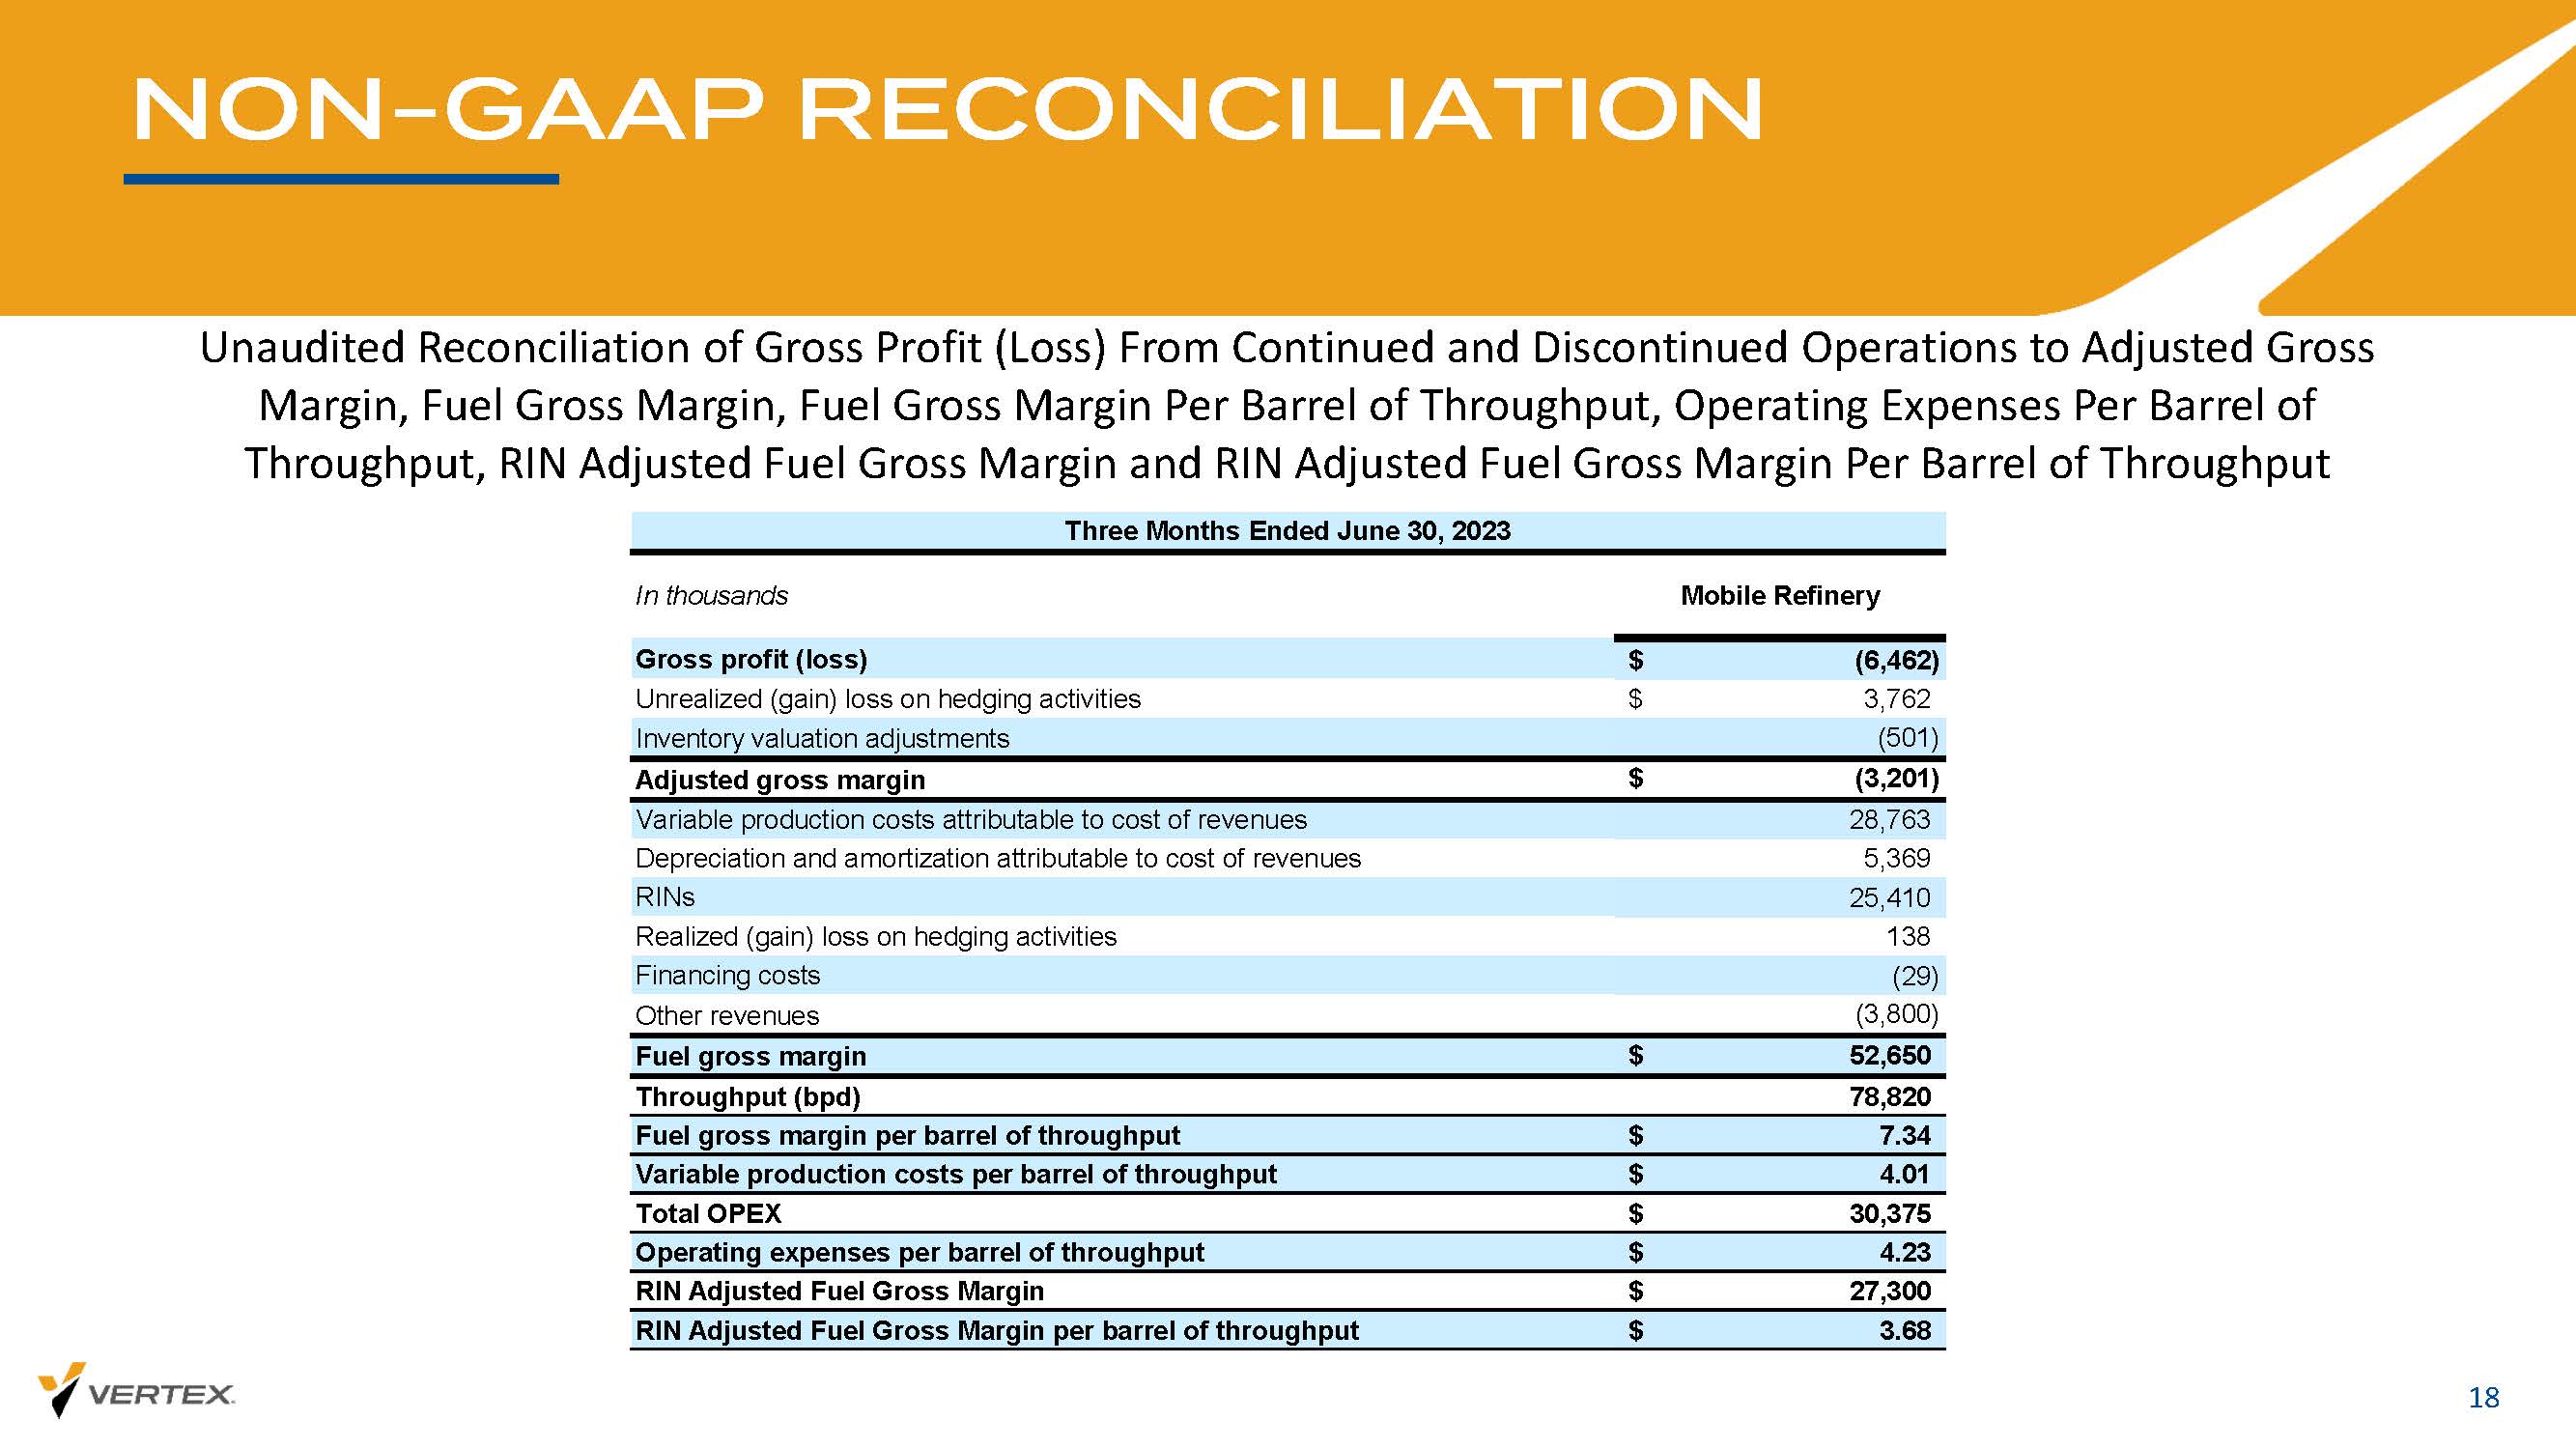
NON - GAAP RECONCILIATION 18 Unaudited Reconciliation of Gross Profit (Loss) From Continued and Discontinued Operations to Adjusted Gross Margin, Fuel Gross Margin, Fuel Gross Margin Per Barrel of Throughput, Operating Expenses Per Barrel of Throughput, RIN Adjusted Fuel Gross Margin and RIN Adjusted Fuel Gross Margin Per Barrel of Throughput
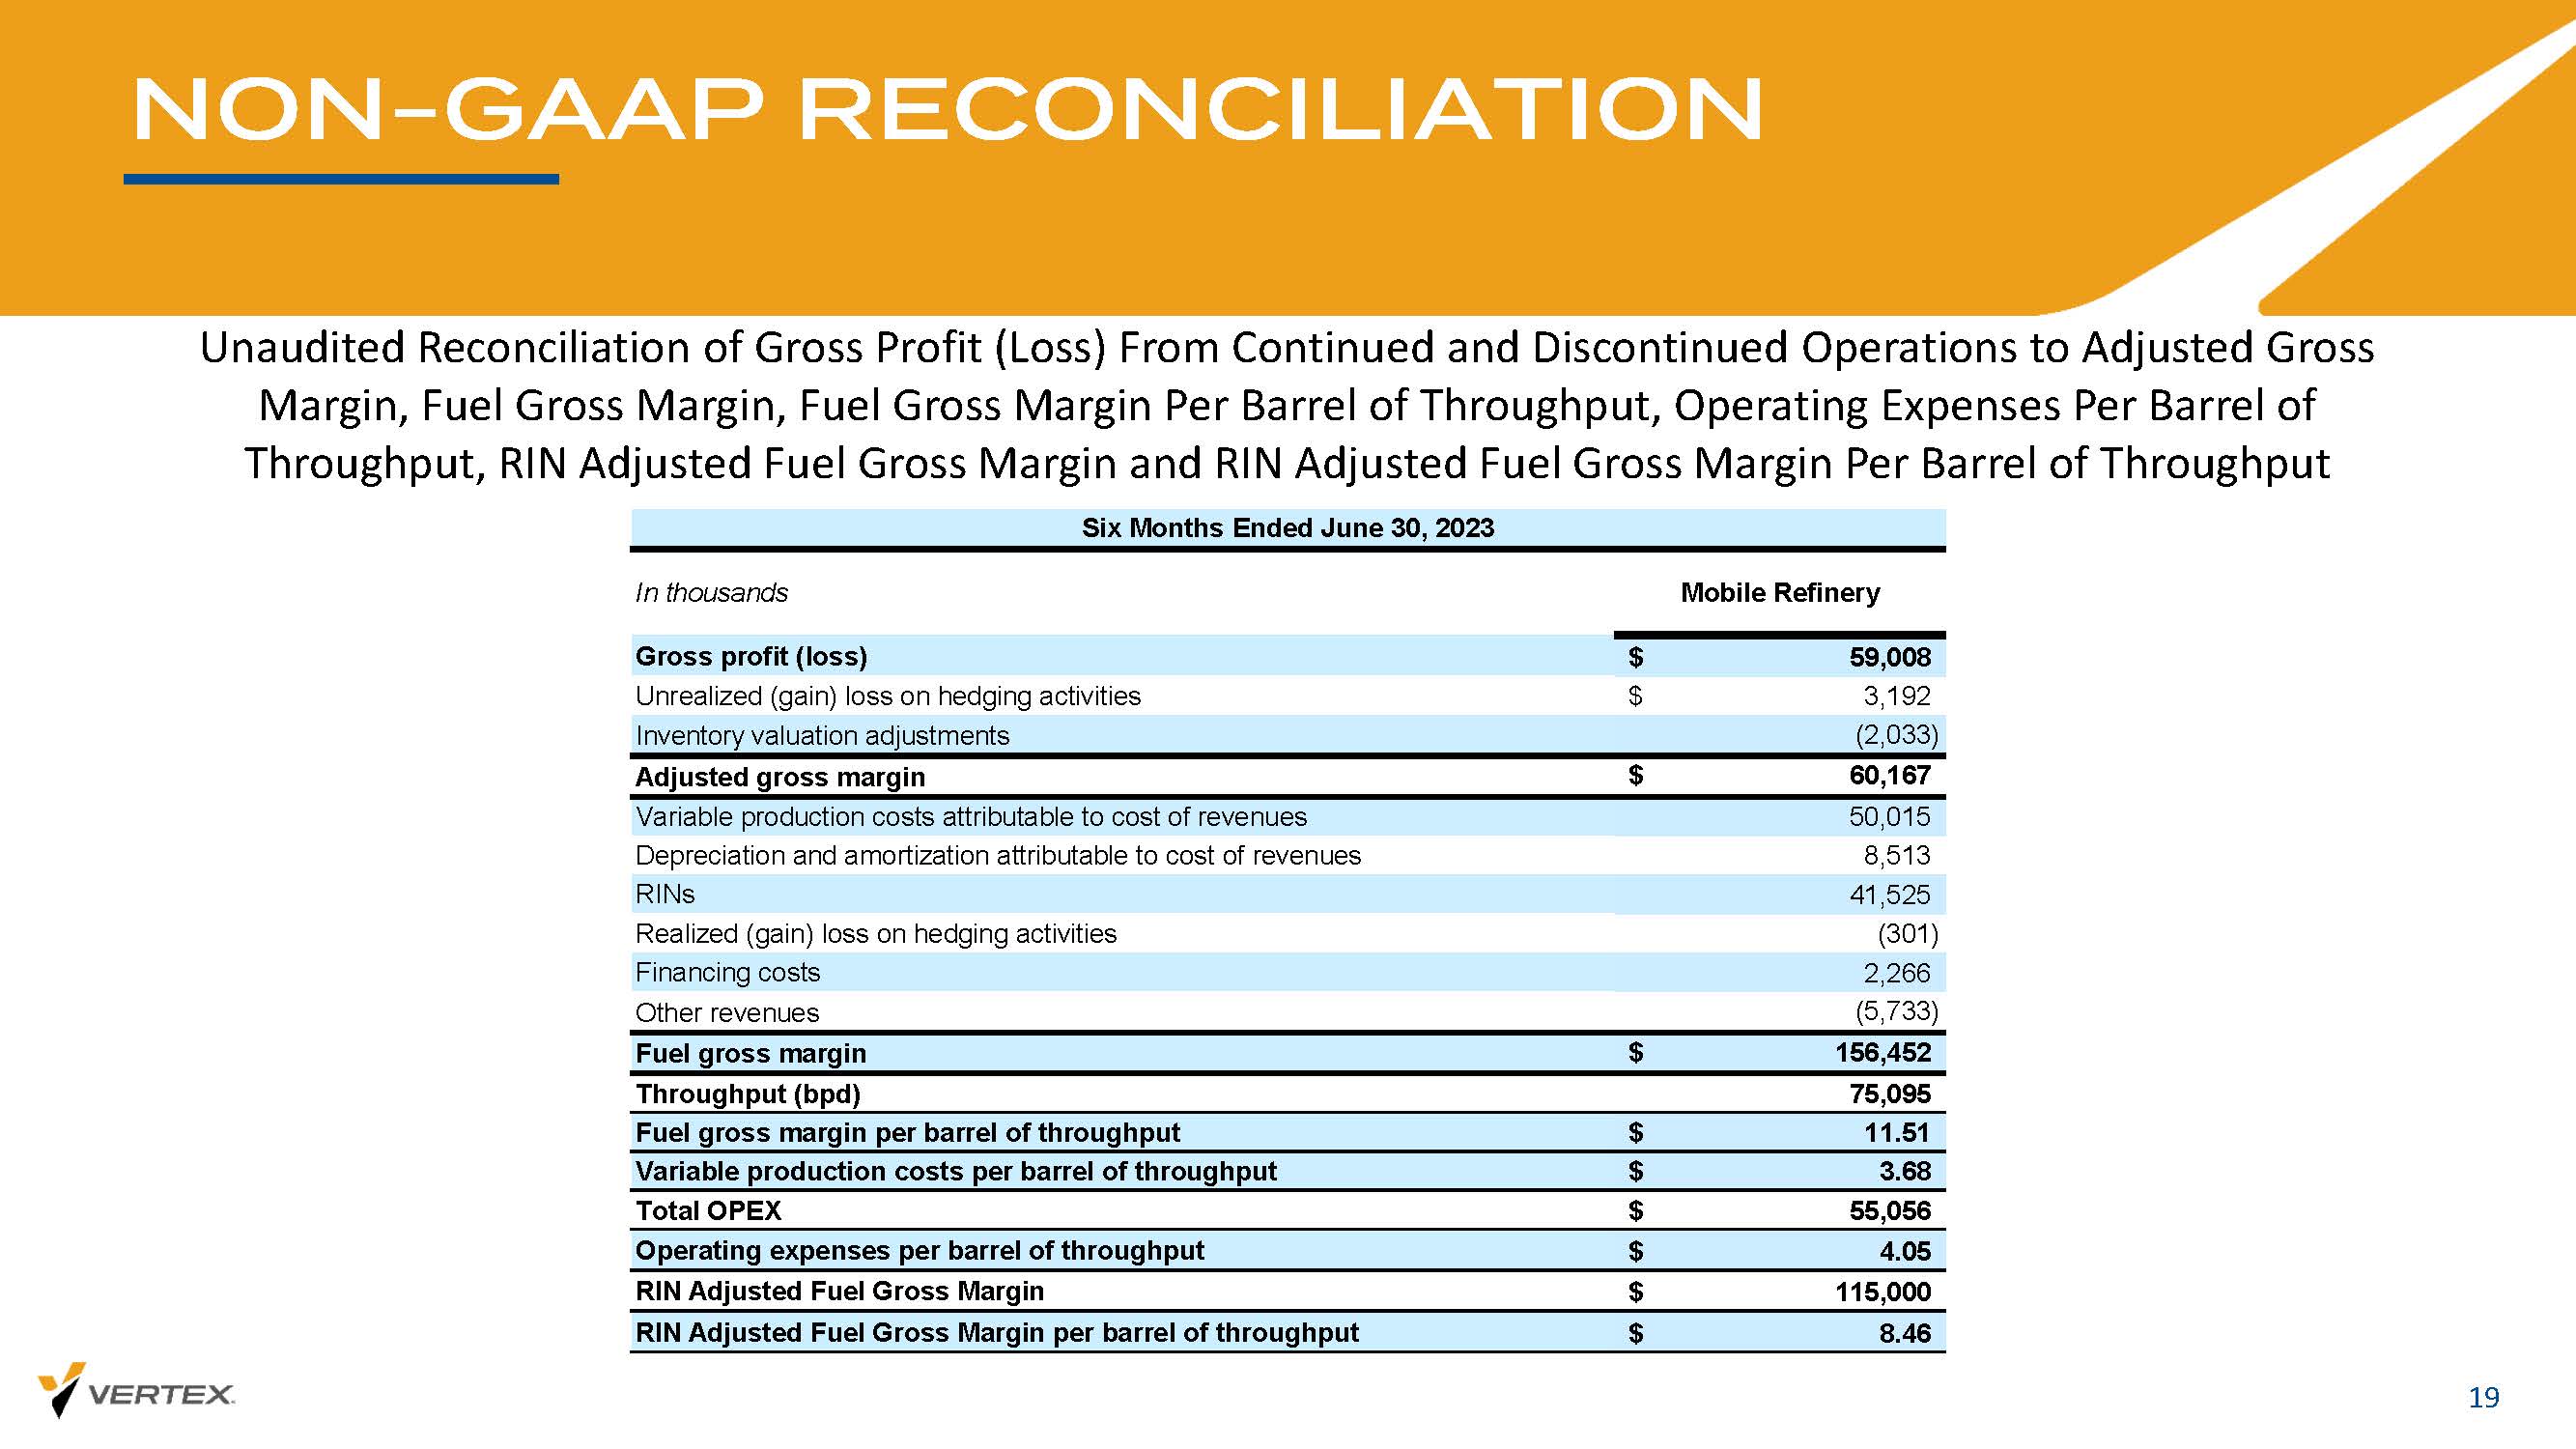
NON - GAAP RECONCILIATION 19 Unaudited Reconciliation of Gross Profit (Loss) From Continued and Discontinued Operations to Adjusted Gross Margin, Fuel Gross Margin, Fuel Gross Margin Per Barrel of Throughput, Operating Expenses Per Barrel of Throughput, RIN Adjusted Fuel Gross Margin and RIN Adjusted Fuel Gross Margin Per Barrel of Throughput
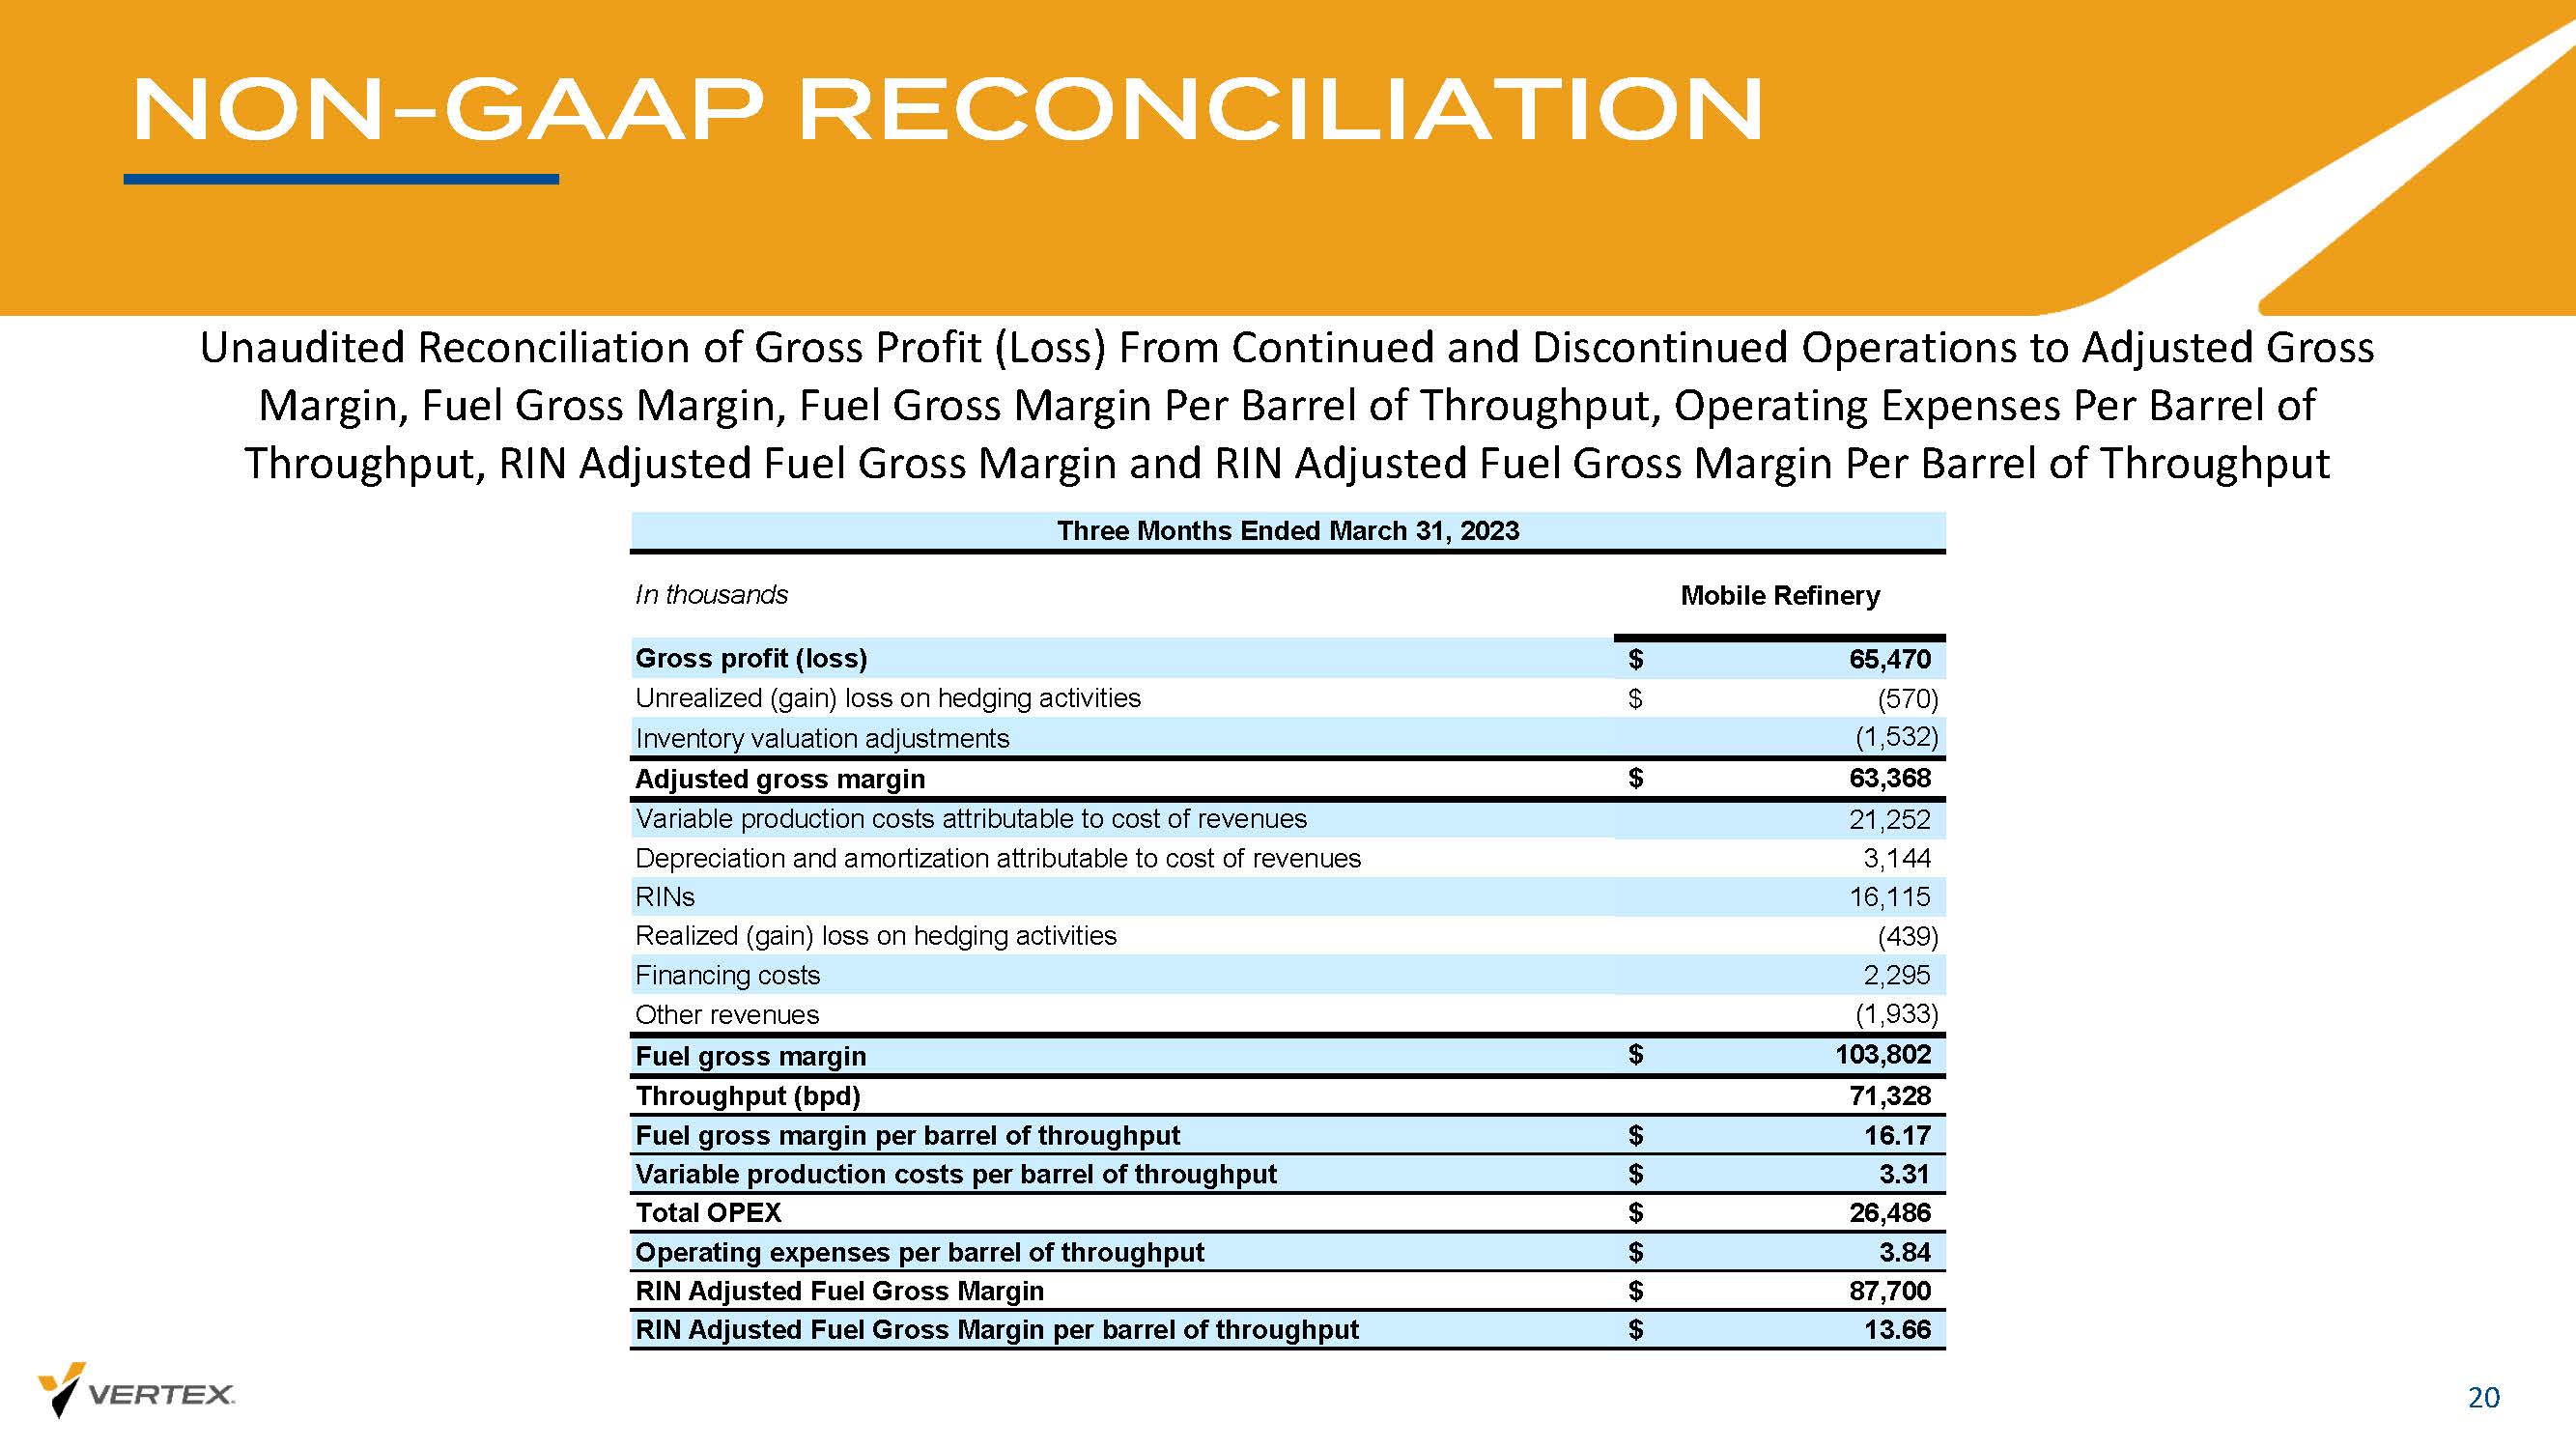
NON - GAAP RECONCILIATION 20 Unaudited Reconciliation of Gross Profit (Loss) From Continued and Discontinued Operations to Adjusted Gross Margin, Fuel Gross Margin, Fuel Gross Margin Per Barrel of Throughput, Operating Expenses Per Barrel of Throughput, RIN Adjusted Fuel Gross Margin and RIN Adjusted Fuel Gross Margin Per Barrel of Throughput
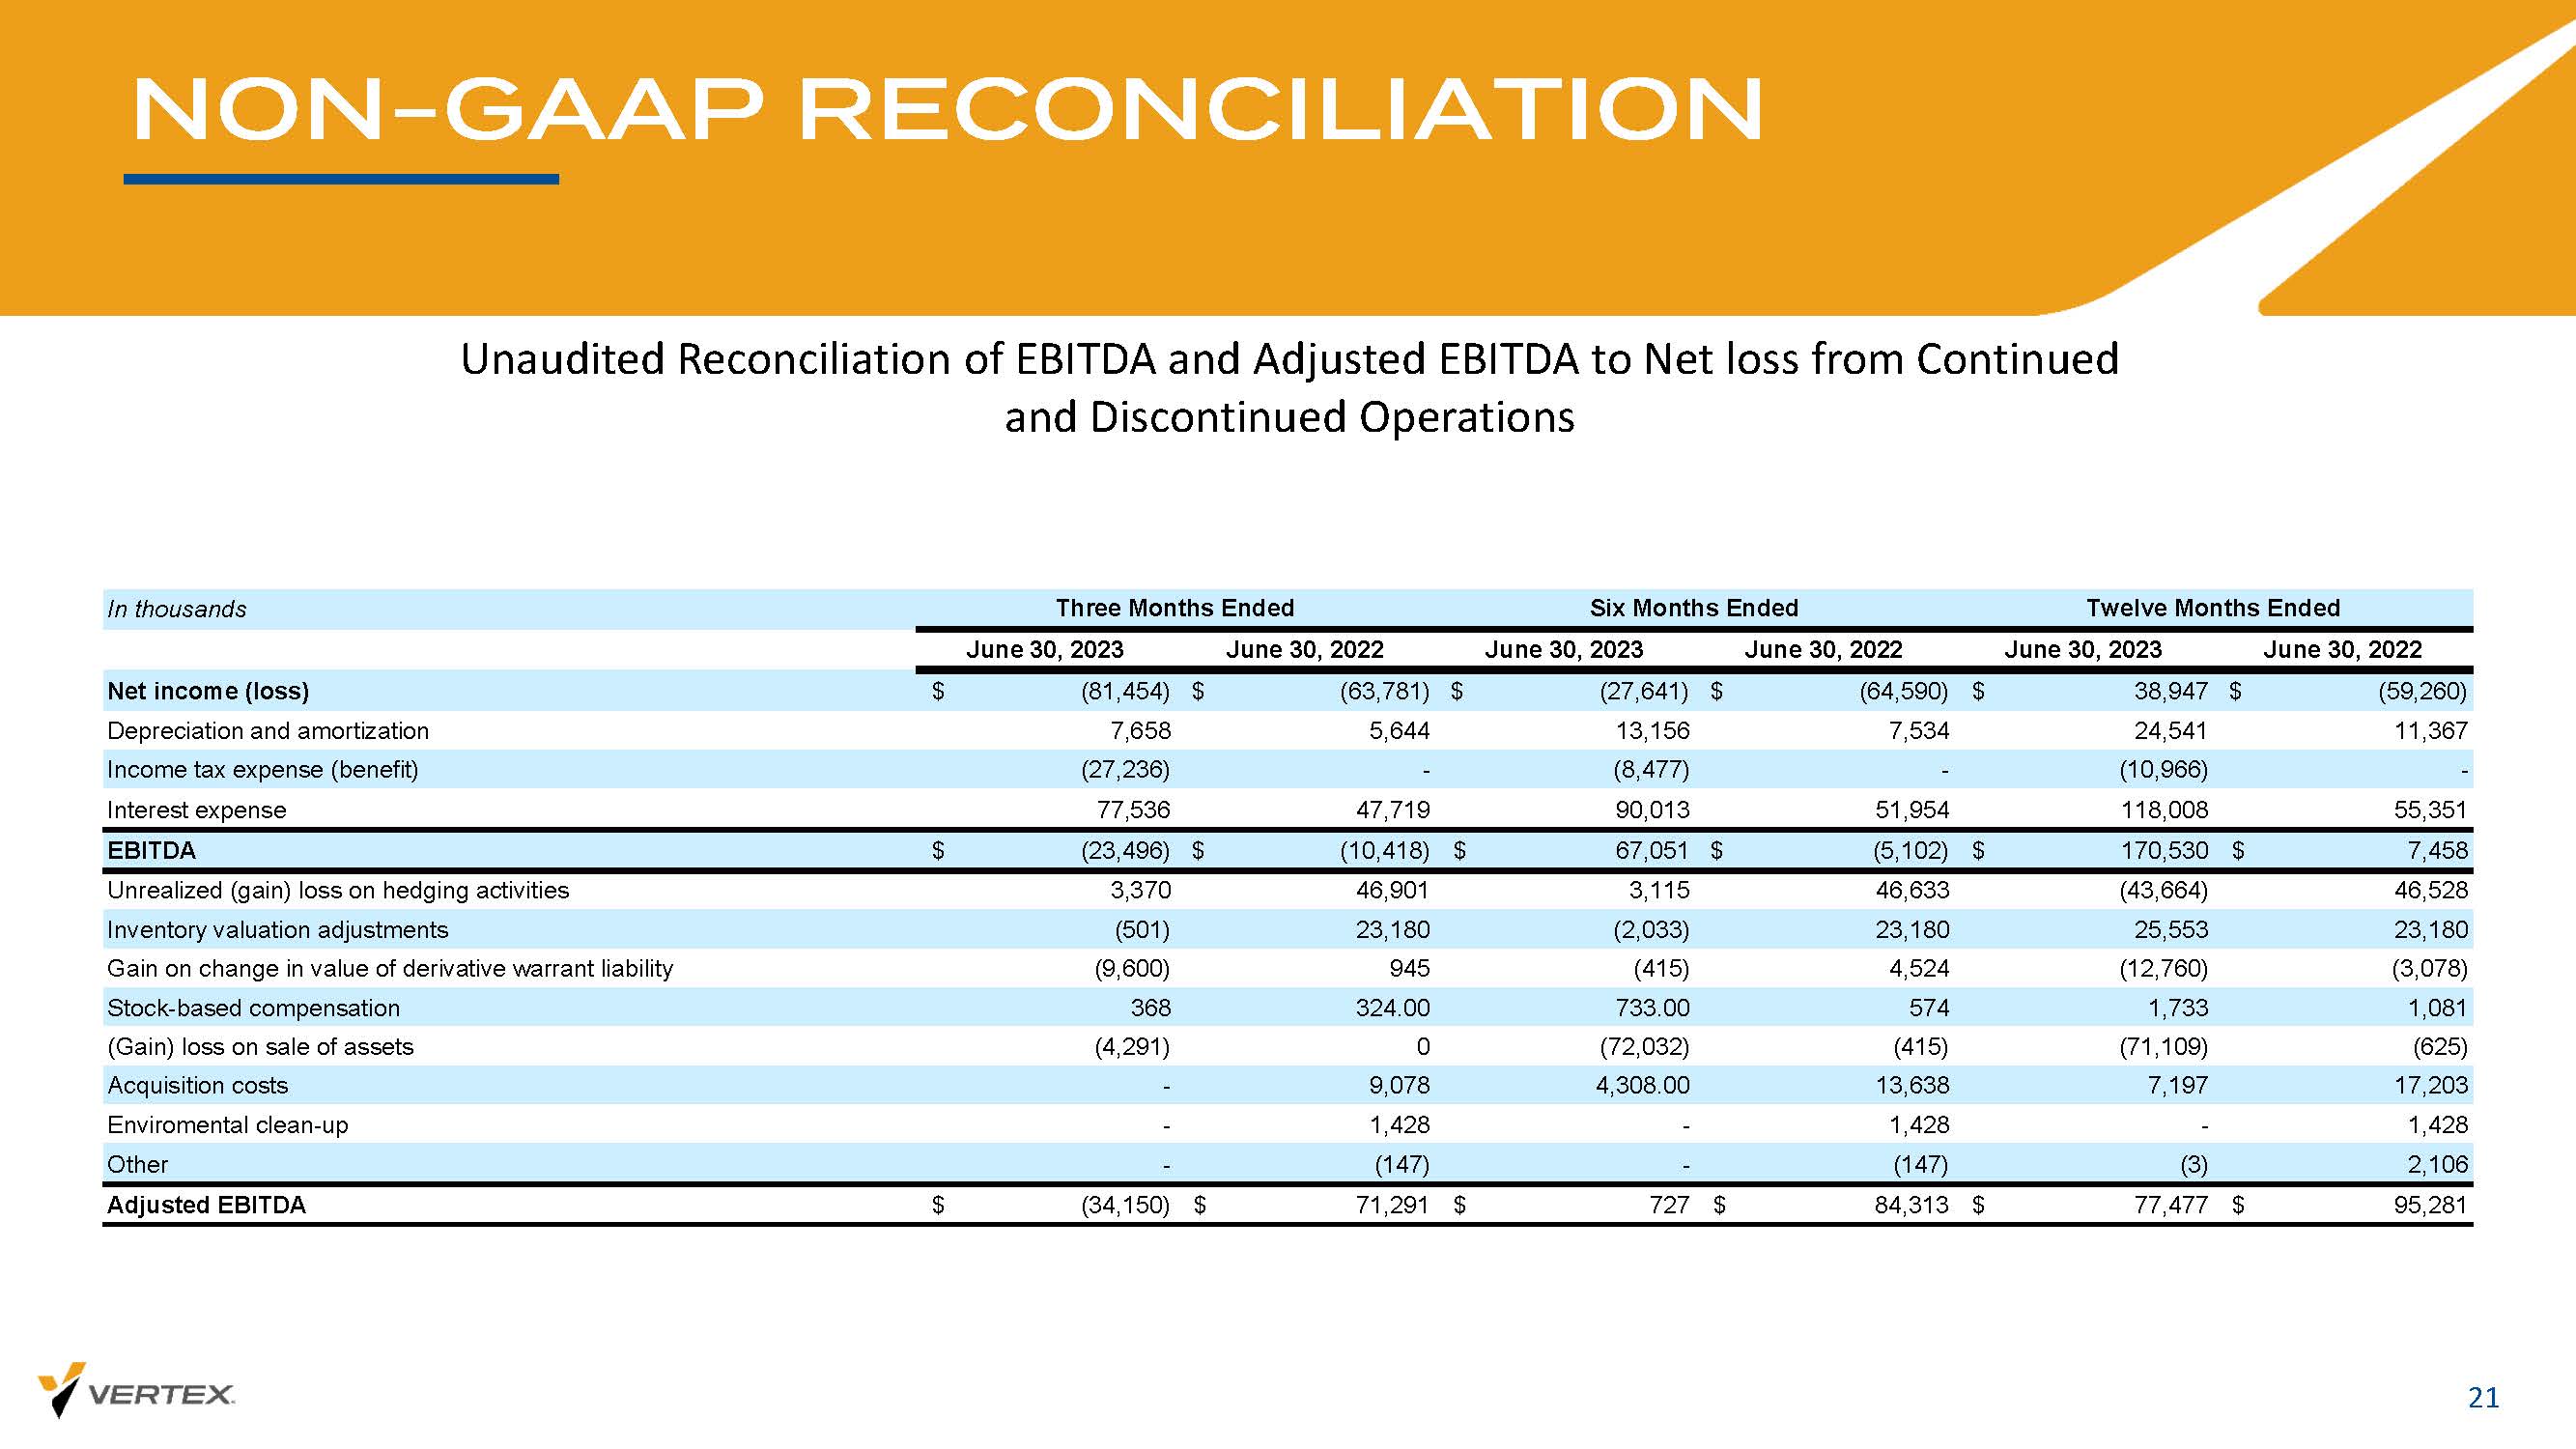
NON - GAAP RECONCILIATION 21 Unaudited Reconciliation of EBITDA and Adjusted EBITDA to Net loss from Continued and Discontinued Operations
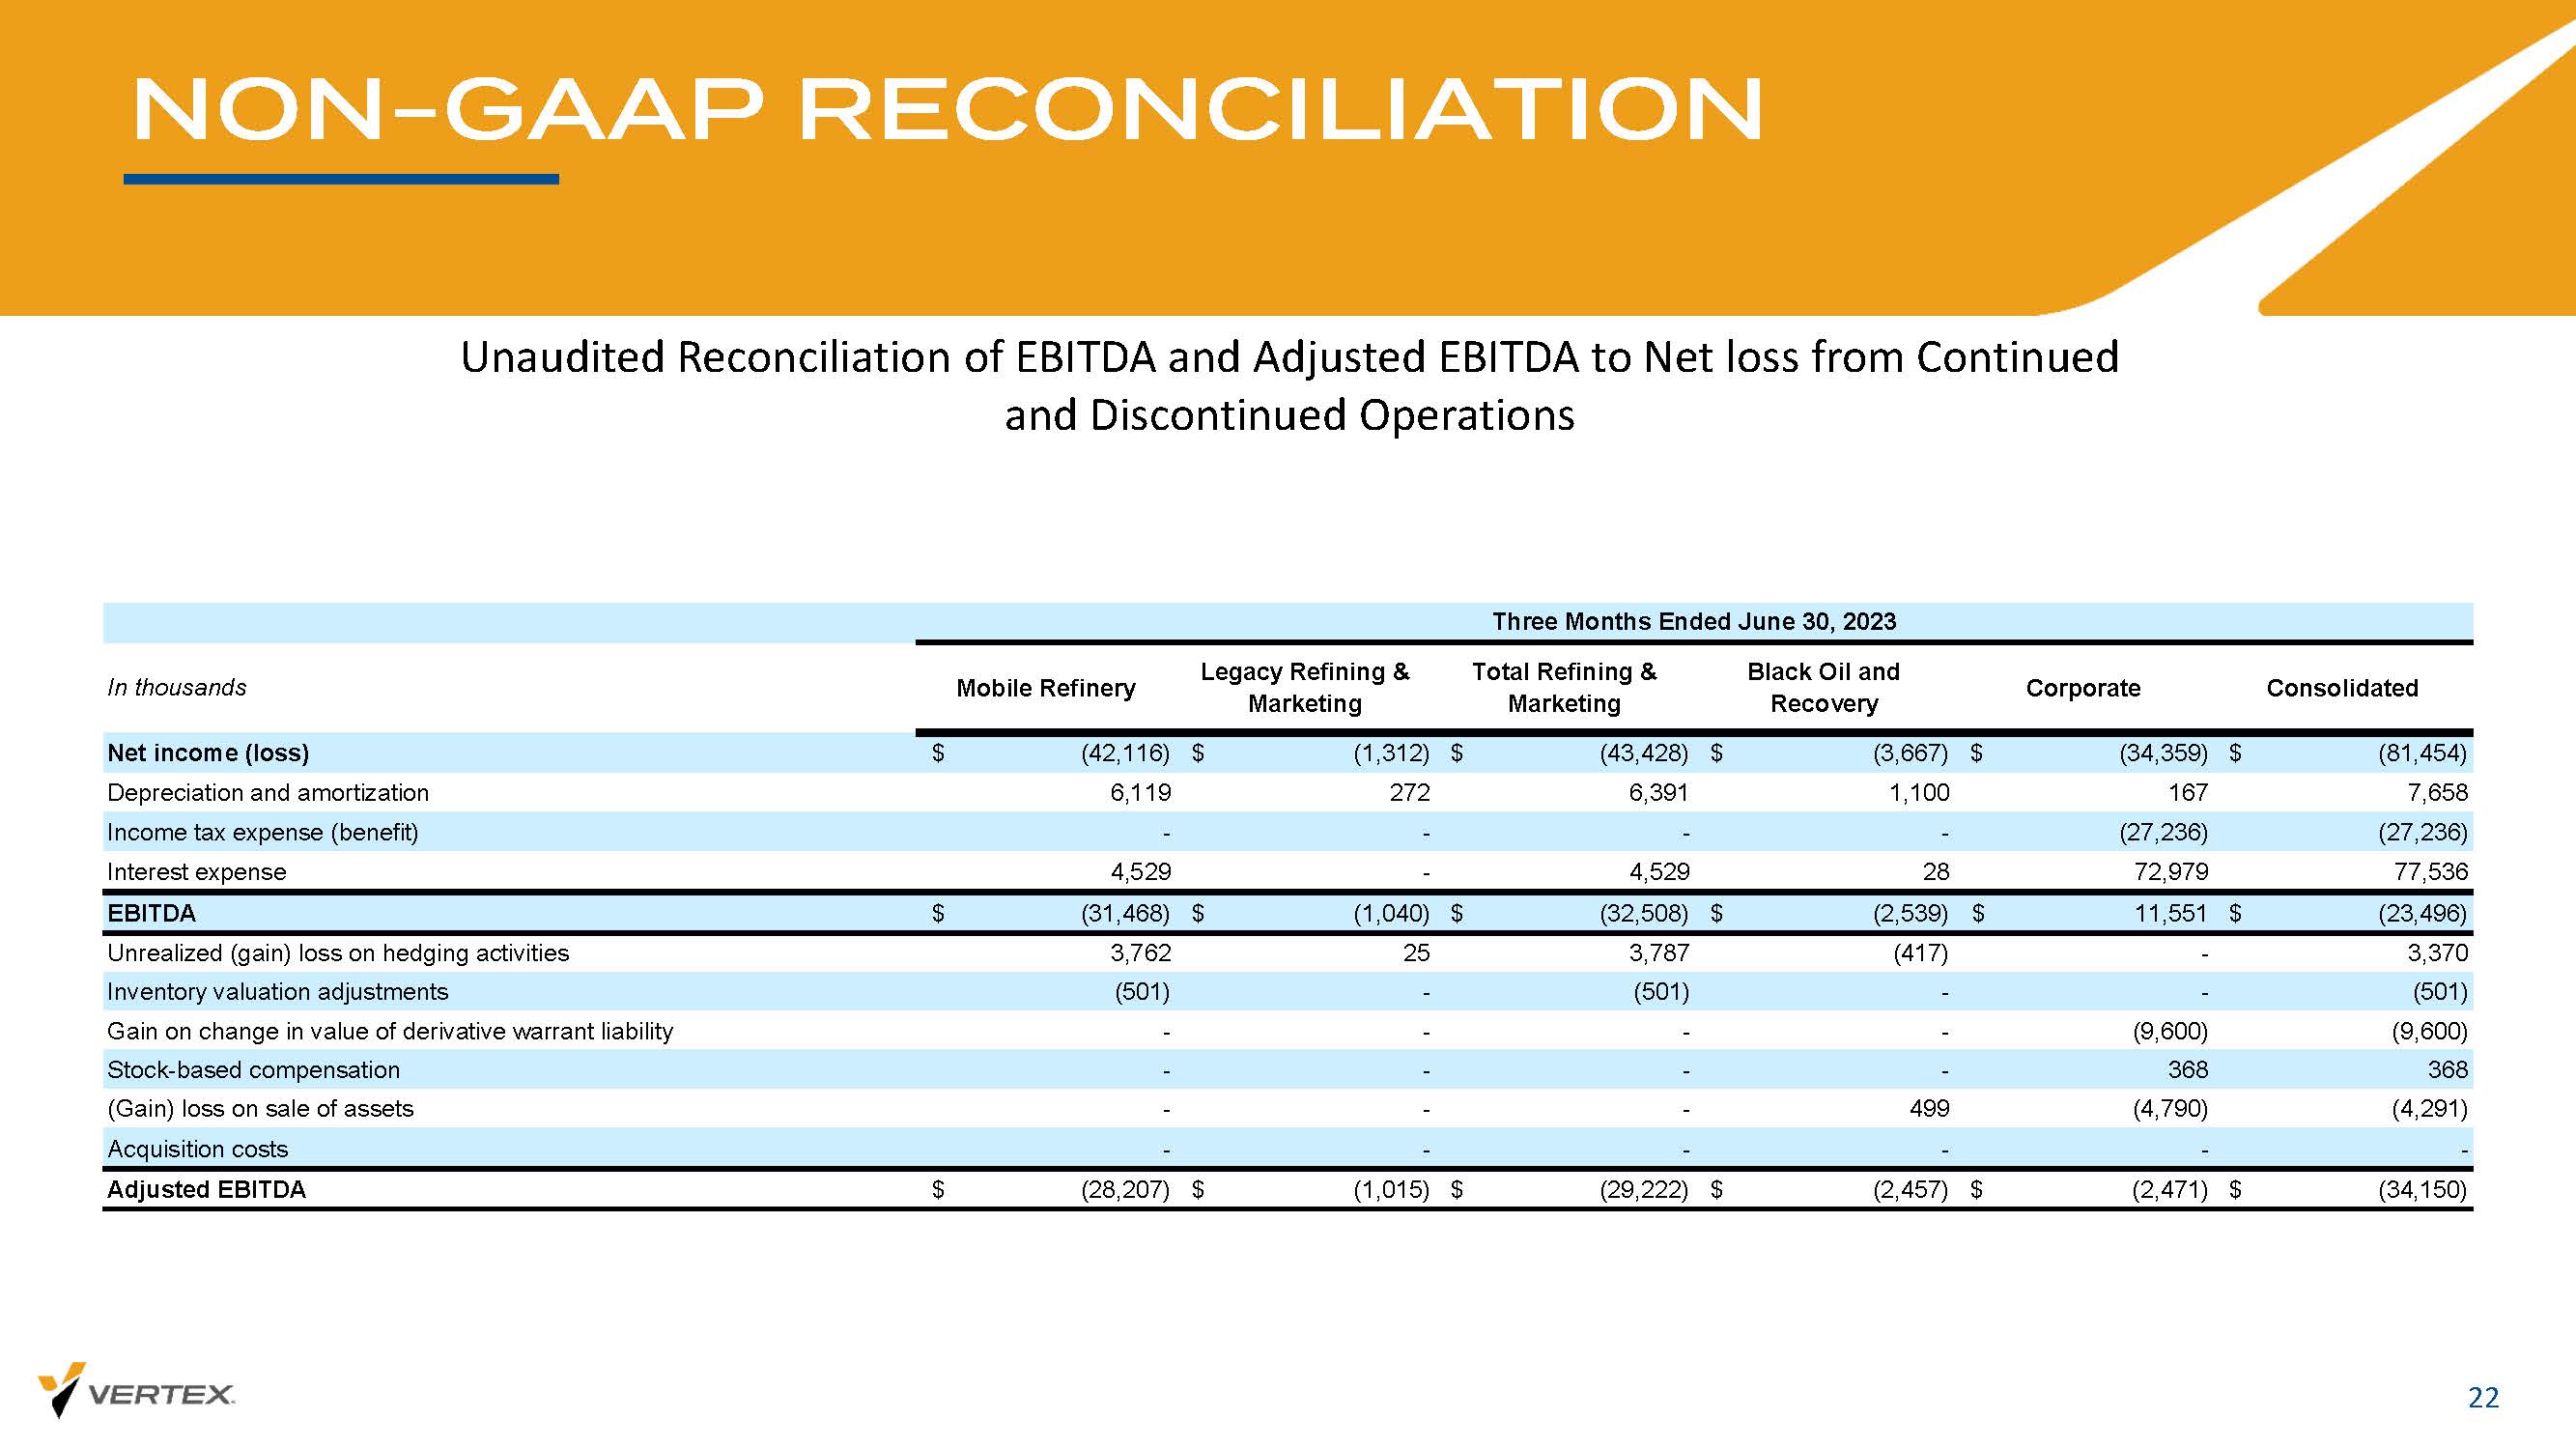
NON - GAAP RECONCILIATION 22 Unaudited Reconciliation of EBITDA and Adjusted EBITDA to Net loss from Continued and Discontinued Operations
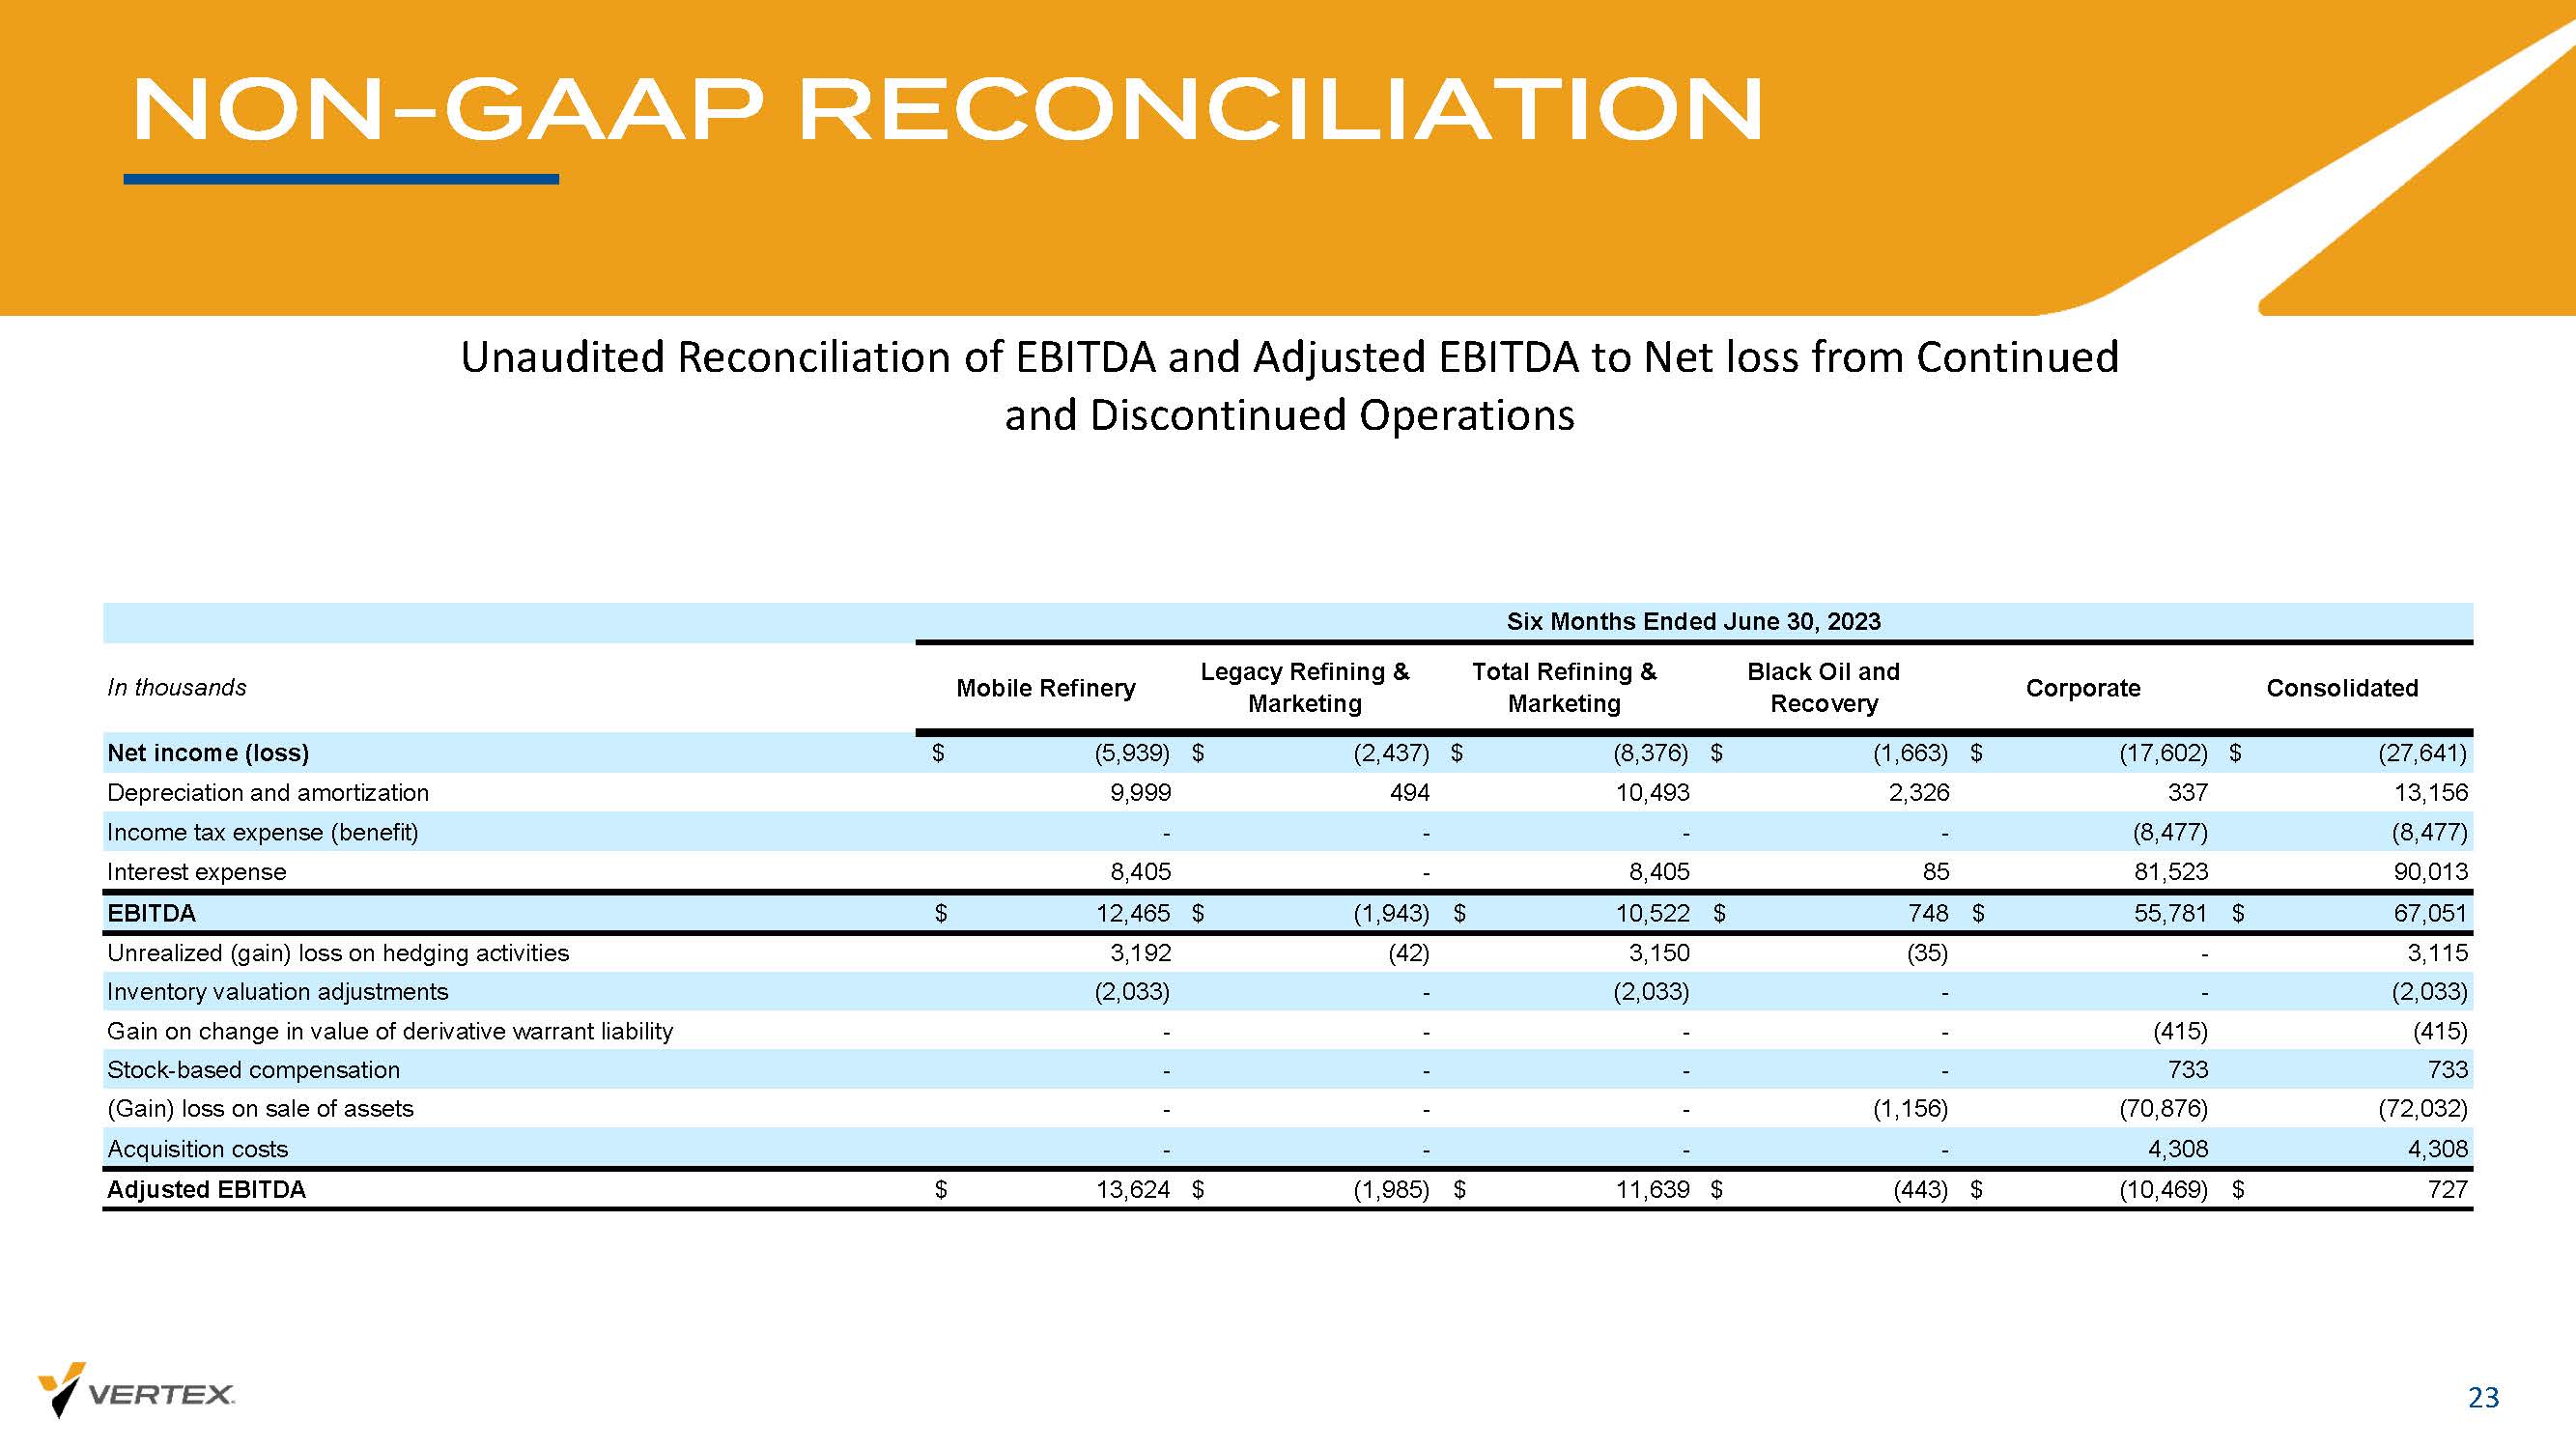
NON - GAAP RECONCILIATION 23 Unaudited Reconciliation of EBITDA and Adjusted EBITDA to Net loss from Continued and Discontinued Operations
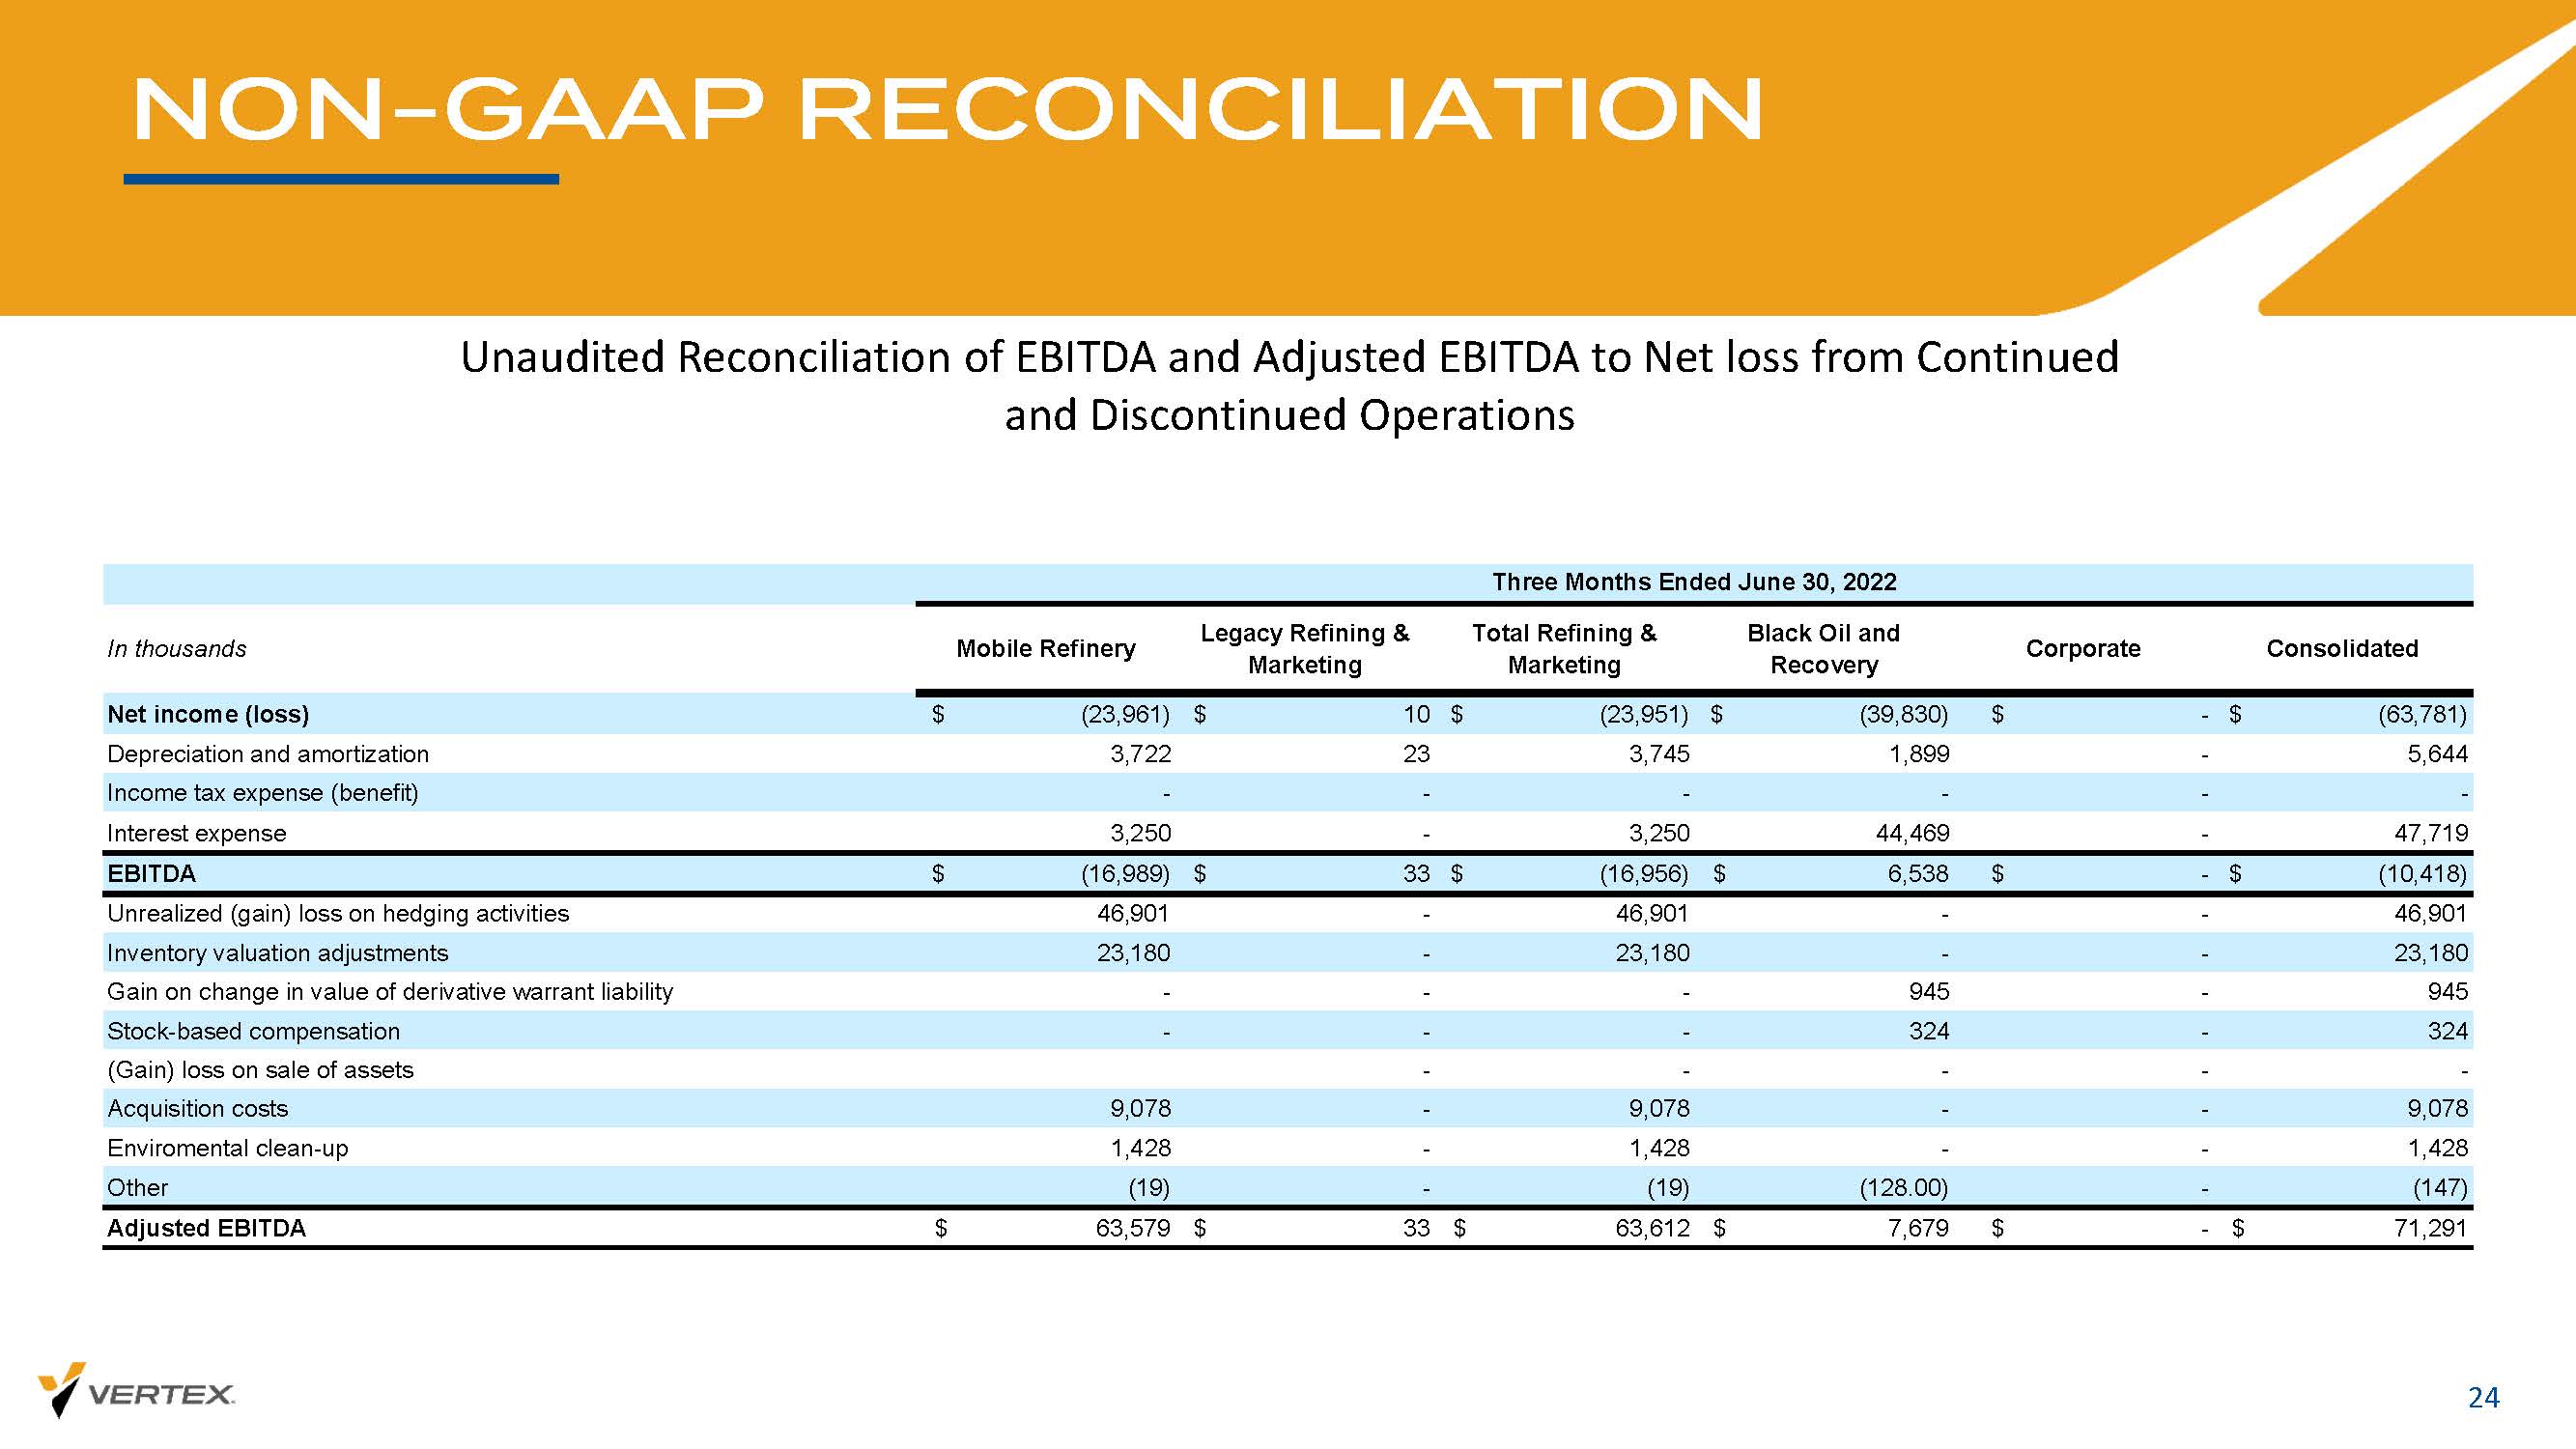
NON - GAAP RECONCILIATION 24 Unaudited Reconciliation of EBITDA and Adjusted EBITDA to Net loss from Continued and Discontinued Operations

NON - GAAP RECONCILIATION 25 Unaudited Reconciliation of EBITDA and Adjusted EBITDA to Net loss from Continued and Discontinued Operations In thousands Mobile Refinery Legacy Refining & Marketing Total Refining & Marketing Black Oil and Recovery Corporate Consolidated Net income (loss) $ (23,961) $ 290 $ (23,671) $ (26,015) $ (14,904) $ (64,590) Depreciation and amortization 3,722 251 3,973 3,315 246 7,534 Income tax expense (benefit) - - - - - - Interest expense 3,250 - 3,250 44,469 4,235 51,954 EBITDA $ (16,989) $ 541 $ (16,448) $ 21,769 $ (10,423) $ (5,102) Unrealized (gain) loss on hedging activities 46,901 - 46,901 (268.00) - 46,633 Inventory valuation adjustments 23,180 - 23,180 - - 23,180 Gain on change in value of derivative warrant liability - - - 945.00 3,579 4,524 Stock-based compensation - - - 324.00 250 574 (Gain) loss on sale of assets - - - (415) - (415) Acquisition costs 9,078 - 9,078 - 4,560 13,638 Enviromental clean-up 1,428 - 1,428 - - 1,428 Other (19) - (19) (128.00) - (147) Adjusted EBITDA $ 63,579 $ 541 $ 64,120 $ 22,227 $ (2,034) $ 84,313 Six Months Ended June 30, 2022
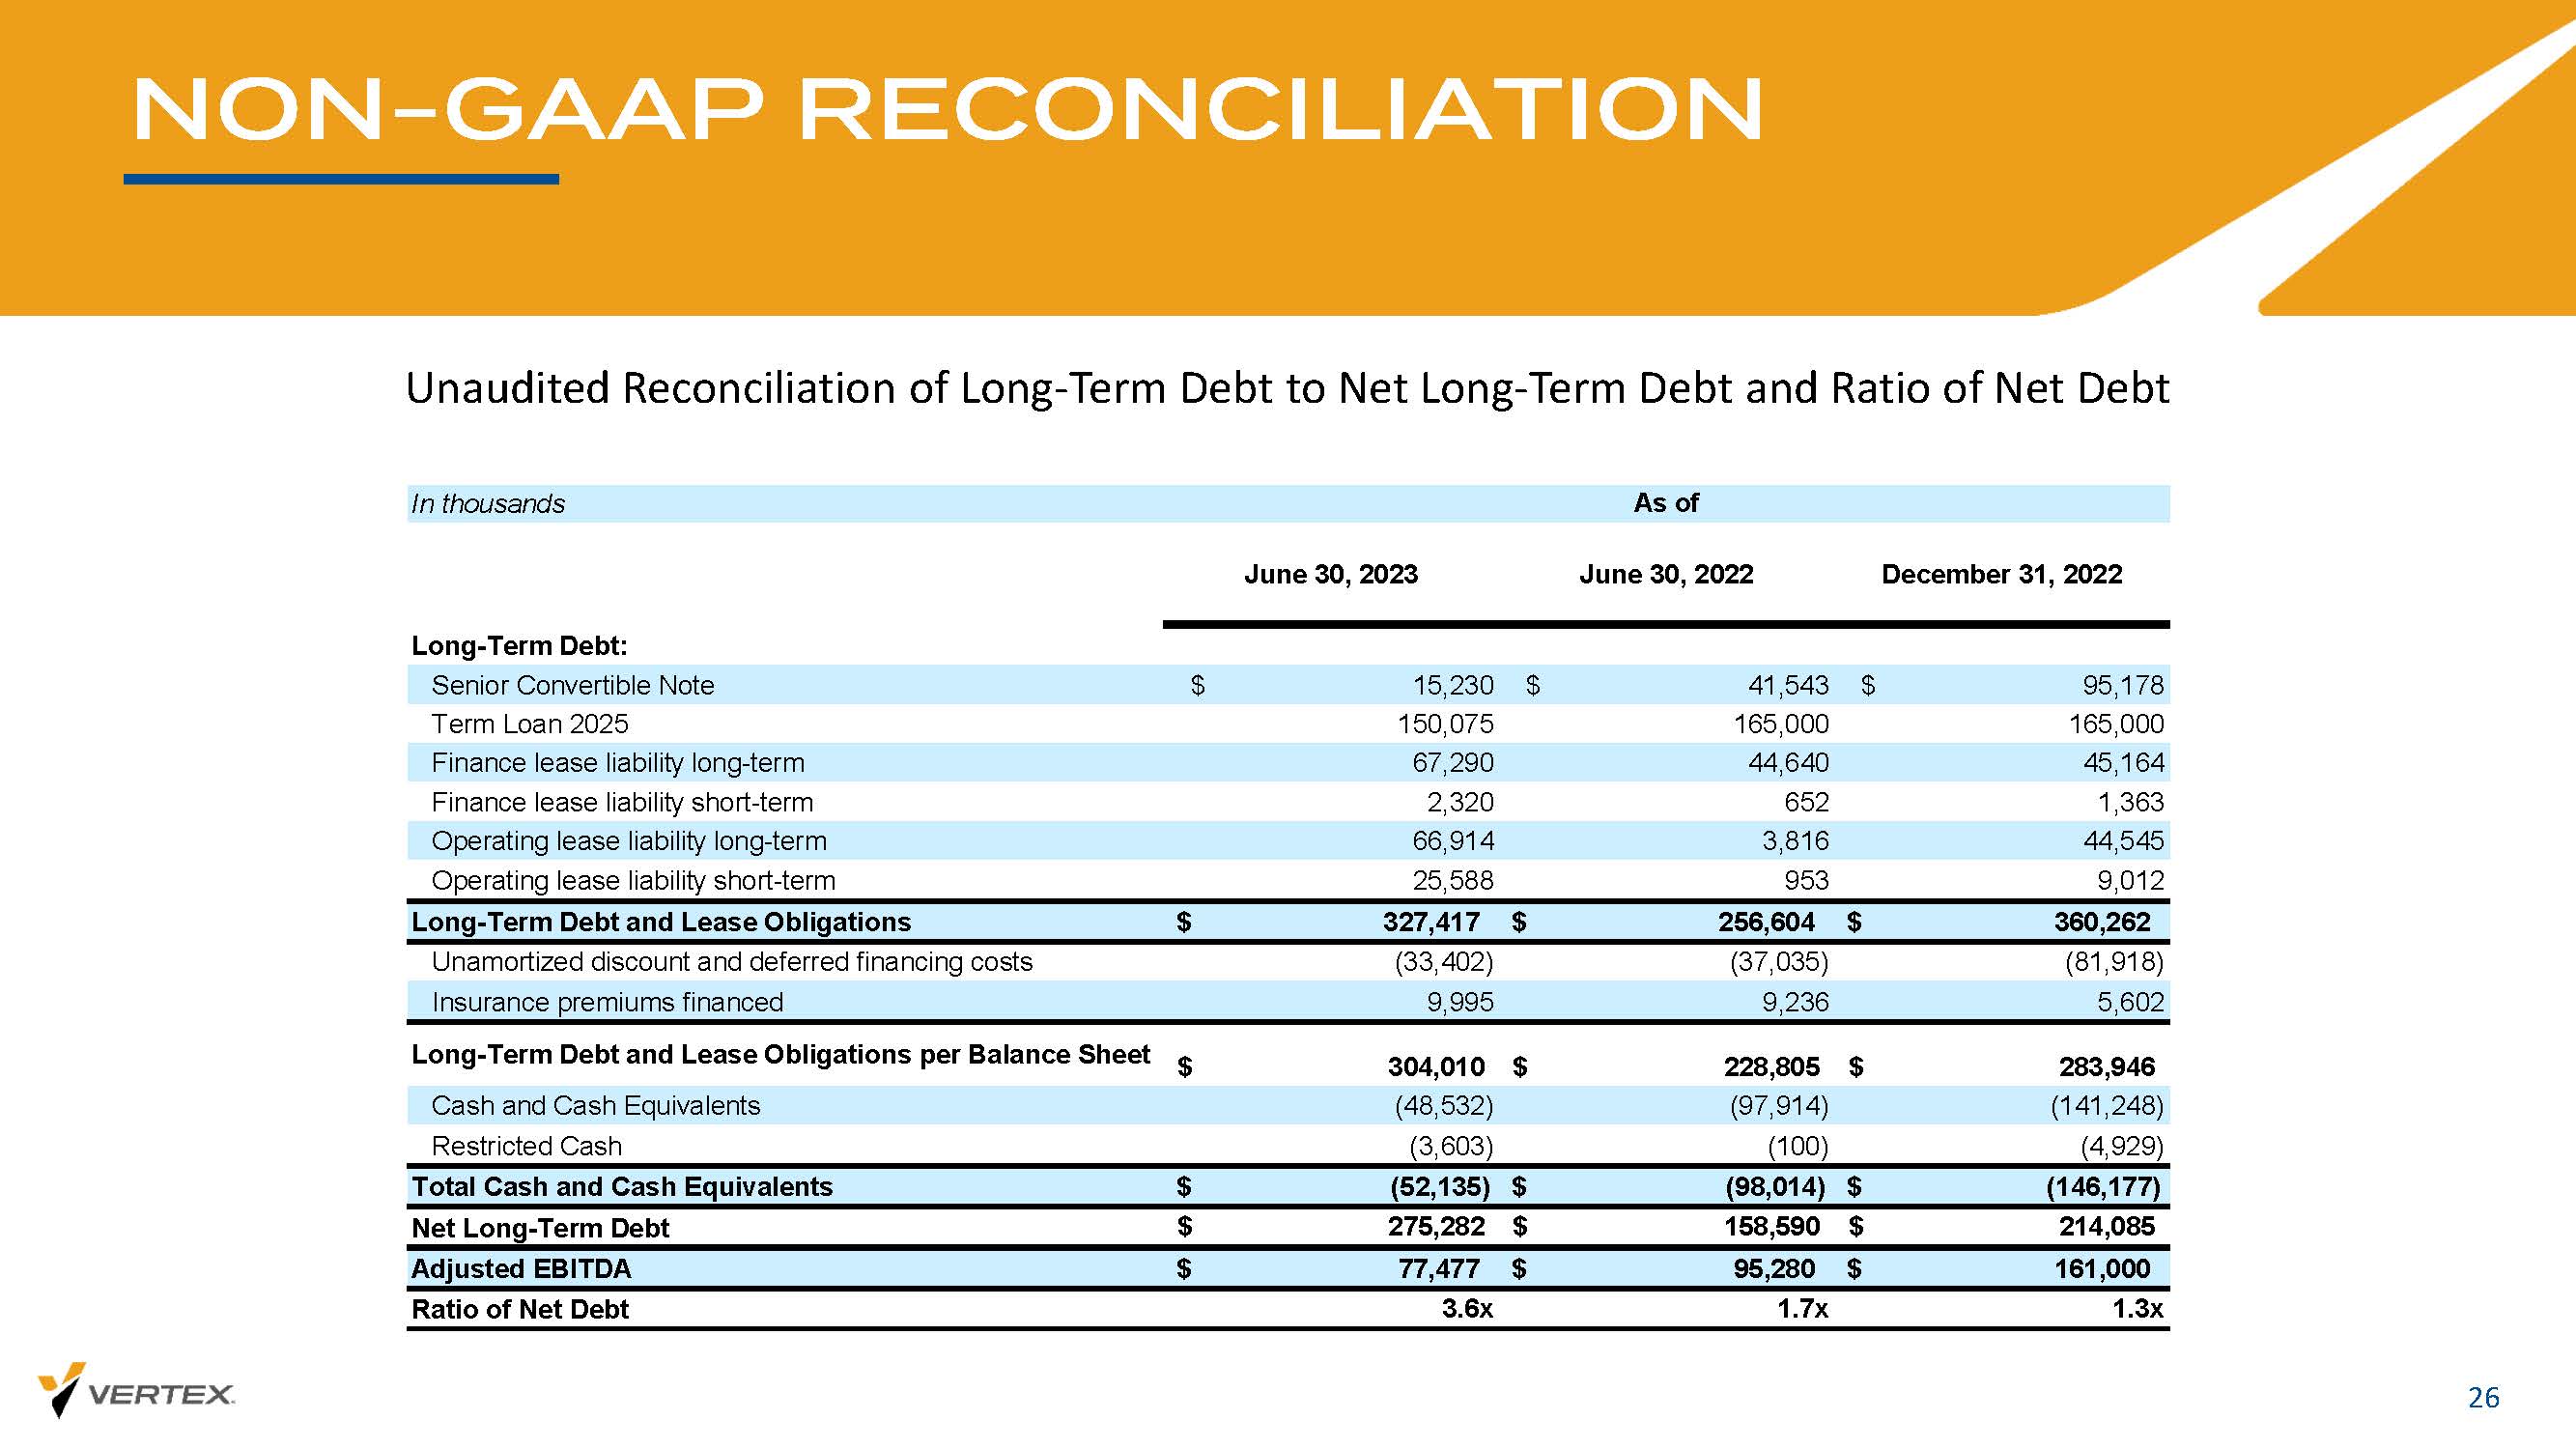
NON - GAAP RECONCILIATION 26 Unaudited Reconciliation of Long - Term Debt to Net Long - Term Debt and Ratio of Net Debt In thousands June 30, 2023 June 30, 2022 December 31, 2022 Long-Term Debt: Senior Convertible Note $ 15,230 $ 41,543 $ 95,178 Term Loan 2025 150,075 165,000 165,000 Finance lease liability long-term 67,290 44,640 45,164 Finance lease liability short-term 2,320 652 1,363 Operating lease liability long-term 66,914 3,816 44,545 Operating lease liability short-term 25,588 953 9,012 Long-Term Debt and Lease Obligations $ 327,417 $ 256,604 $ 360,262 Unamortized discount and deferred financing costs (33,402) (37,035) (81,918) Insurance premiums financed 9,995 9,236 5,602 Long-Term Debt and Lease Obligations per Balance Sheet 304,010$ 228,805$ 283,946$ Cash and Cash Equivalents (48,532) (97,914) (141,248) Restricted Cash (3,603) (100) (4,929) Total Cash and Cash Equivalents $ (52,135) $ (98,014) $ (146,177) Net Long-Term Debt 275,282$ 158,590$ 214,085$ Adjusted EBITDA $ 77,477 $ 95,280 $ 161,000 Ratio of Net Debt 3.6x 1.7x 1.3x As of