附件(C)(2)(B)待審查的初稿和重要修訂項目Alpha補充討論材料2022年7月28日
這些材料由Evercore Group L.L.C.(“Evercore”)為阿爾法(“本公司”)董事會特別委員會準備,並直接向其交付該等材料,不得用於 或依賴於具體預期以外的任何目的。這些材料基於由公司和/或其他潛在交易參與者或代表公司和/或其他潛在交易參與者提供的信息,這些信息來自公共來源或由 Evercore以其他方式審閲。Evercore不承擔獨立調查或核實此類信息的責任,並依賴此類信息在所有實質性方面都是完整和準確的。在該等資料包括由本公司管理層及/或其他潛在交易參與者編制或審閲或從公開來源取得的對未來財務表現的估計 及預測的範圍內,Evercore假設該等估計及預測已根據反映該等管理層目前可得的最佳估計及判斷(或就從公開來源獲得的估計及預測而言,代表合理估計)的基準而合理地編制。對於該等信息的準確性或完整性,不作任何明示或暗示的陳述或 保證,本文中包含的任何內容都不是、也不應被視為關於過去、現在或未來的陳述。這些材料是為熟悉公司業務和事務的特定人士而設計的。這些材料不是為評價提供唯一依據,不應被視為關於以下方面的建議, 任何交易或 其他事項。這些材料由Evercore開發並歸Evercore所有,專門為公司董事會特別委員會的利益和內部使用而準備。這些材料補充了Evercore於2022年7月25日為董事會特別委員會準備的《Alpha項目討論材料》,該材料是Evercore於該日提交給特別委員會的,與這些材料(有時稱為7月25日演示)中所述的擬議交易有關。這些材料沒有重申7月25日演示文稿中提出的所有假設和限制條件,必須與該演示文稿一起閲讀。這些材料是在保密的基礎上編寫的,用於公司董事會特別委員會評估7月25日演示文稿中描述的潛在交易,而不是為了公開披露或根據州或聯邦證券法進行備案,未經Evercore事先書面同意,不得複製、傳播、引用或引用全部或部分材料。這些材料不構成出售或購買任何證券的要約或邀約,也不是Evercore(或任何關聯公司)為任何交易提供或安排任何融資或購買與此相關的任何證券的承諾。Evercore不承擔更新或以其他方式修改這些材料的義務。這些材料可能不反映Evercore及其附屬公司其他業務領域的其他專業人員已知的信息。Evercore及其附屬公司不提供法律、會計或税務建議。 , 本文中包含的任何有關税務事項的聲明既不是Evercore或其關聯公司撰寫的,也不是有意使用的,任何納税人都不能用來逃避可能對該納税人施加的税收處罰。每個人都應根據自己的具體情況,就本文所述交易或事項的影響向獨立顧問尋求法律、會計和税務建議。
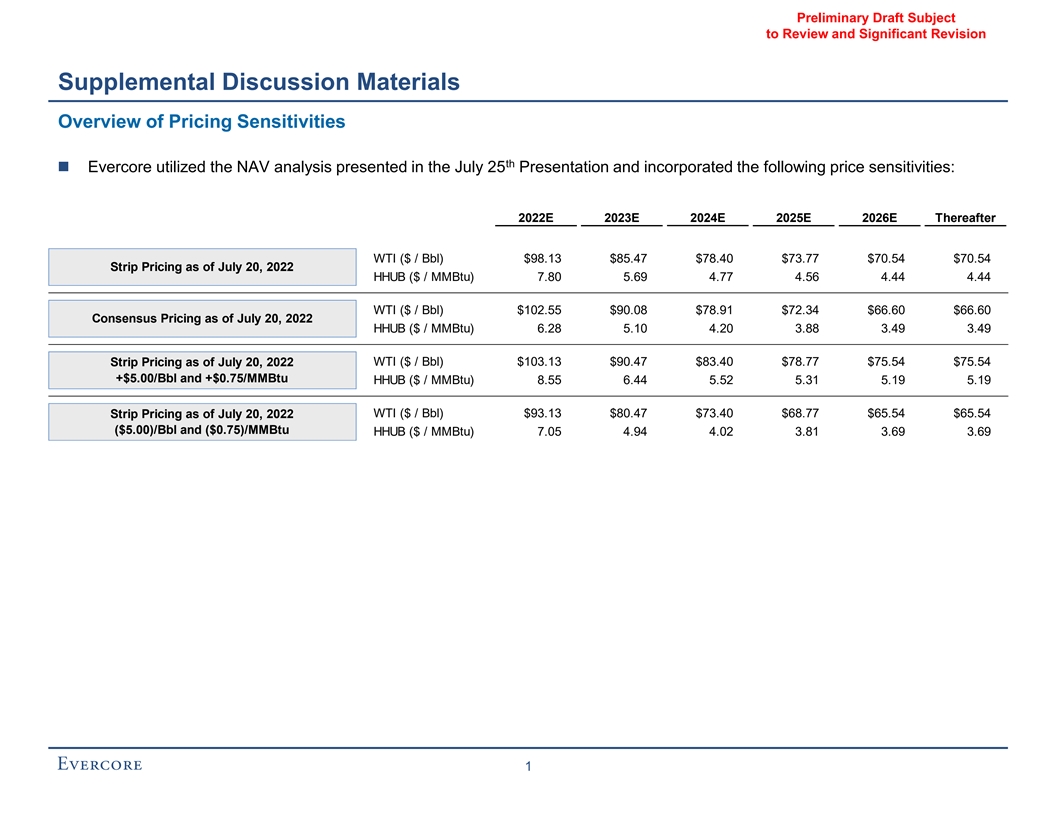
有待審查的初稿和重大修訂補充討論材料定價敏感性概述◼Evercore利用了7月25日演示文稿中提供的資產淨值分析,並納入了以下價格敏感度:2022E 2023E 2024E 2025E 2026E之後WTI($/Bbl) $98.13$85.47$78.40$73.77$70.54$70.54截至7月20日的帶狀定價,2022年HHUB(美元/MMBtu)7.80 5.69 4.77 4.56 4.44 4.44 WTI(美元/桶)$102.55$90.08$78.91$72.34$66.60$66.60共識定價截至2022年7月20日HHUB(美元/MMBtu)6.28 5.10 4.20 3.88 3.49 3.49截至7月20日帶狀定價,2022年WTI(美元/桶)$103.13$90.47$83.4$78.77$75.54$75.54+$5.00/桶和+0.75/MMBtu HHUB(美元/桶)8.55 6.44 5.52 5.31 5.19 5.19 WTI(美元/桶)$93.13$80.47$73.40$68.77$65.54$65.54條帶 截至7月20日的定價,2022(5.00美元)/桶和(0.75美元)/MMBtu HHUB(美元/MMBtu)7.05 4.94 4.02 3.81 3.69 3.69 1
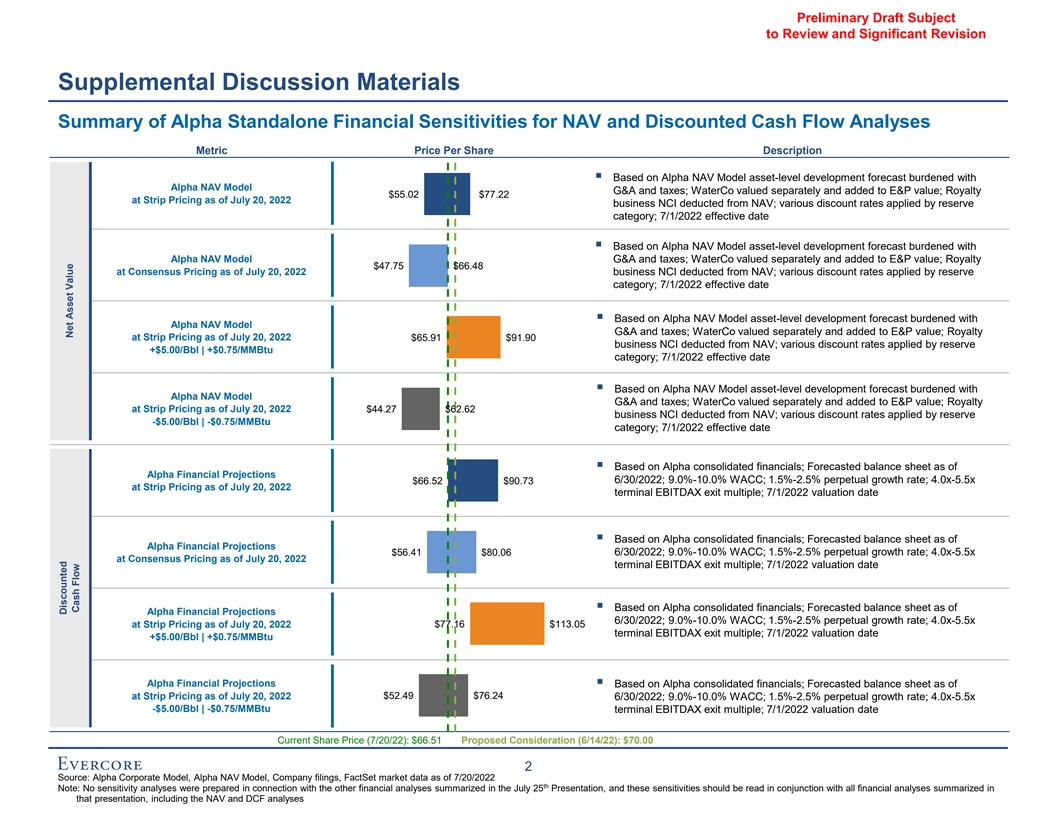
有待審查的初稿和重大修訂補充 討論材料阿爾法獨立的資產淨值財務敏感度摘要和貼現現金流分析每股指標價格説明基於阿爾法資產淨值模型的資產級開發預測▪承擔阿爾法資產淨值模型的資產級開發預測 水務公司單獨估值並計入E&P價值;截至2022年7月20日的特許權使用費$55.02$77.22按資產淨值扣除商業淨資產淨值;按儲備類別應用的各種折扣率;基於阿爾法資產淨值模型的資產級開發預測▪ ;水公司單獨估值並計入E&P價值;特許權使用費$47.75$66.48,截至2022年7月20日,商業NCI從資產淨值中扣除 ;按儲備類別應用的各種折扣率;7/1/2022年生效日期▪基於阿爾法資產淨值模型的資產級發展預測,負擔阿爾法資產淨值G&A模型和税收;水公司單獨估值,添加到E&P 價值;截至2022年7月20日的特許權使用費$65.91$91.90商業NCI從資產淨值中扣除;按儲備應用的各種折扣率+5.00美元/bbl|+0.75美元/MMBtu類別;7/1/2022年生效日期▪基於阿爾法資產淨值模型資產水平 承擔阿爾法資產淨值模型G&A和税費的開發預測;單獨估值並計入E&P價值的水公司;截至2022年7月20日的特許權使用費$44.27$62.62商業淨利潤從資產淨值中扣除; 準備金適用的各種貼現率-5.00美元/bbl|-0.75美元/MMBtu類別;7/1/2022年基於阿爾法合併財務的生效日期▪;截至2022年阿爾法財務預測的資產負債表預測$66.52$90.73 6/30/2022;9.0%-10.0%的WACC;1.5%-2.5%的永久增長率; 截至7月20日的帶狀定價為4.0x-5.5倍, 2022年最終息税前利潤退出倍數;2022年7/1/2022年估值日期▪基於阿爾法合併財務;截至阿爾法財務預測的資產負債表預測$56.41$80.06/2022年6/30;9.0%-10.0% WACC;1.5%-2.5%的永久增長率;截至2022年7月20日的共識定價4.0x-5.5倍;2022年7/1/2022年基於阿爾法合併財務的估值日期▪;截至2022年6月30日阿爾法財務預測的資產負債表預測;9.0%-10.0%WACC;1.5%-2.5%的永久增長率;截至2022年7月20日條帶定價的4.0x-5.5倍$77.16$113.05終端息税前利潤退出倍數;7/1/2022年估值日期+5.00美元/桶|+0.75美元/MMBtu Alpha財務預測 基於阿爾法合併財務的▪;截至2022年7月20日條帶定價的預測資產負債表$52.49$76.24;9.0%-10.0%WACC;1.5%-2.5%的永久增長率;4.0x-5.5x-$5.00/bbl|-$0.75/MMBtu終端EBITDAX退出 倍;估值日期2022年7月1日當前股價(22年7月20日):66.51美元建議對價(22年6月14日):70.00 2來源:Alpha公司模型、Alpha資產淨值模型、公司文件、截至2022年7月20日的事實集市場數據注:未結合7月25日演示文稿中總結的其他財務分析準備敏感度分析 ,這些敏感度應與該演示文稿中總結的所有財務分析一起閲讀,包括資產淨值和折現現金流分析
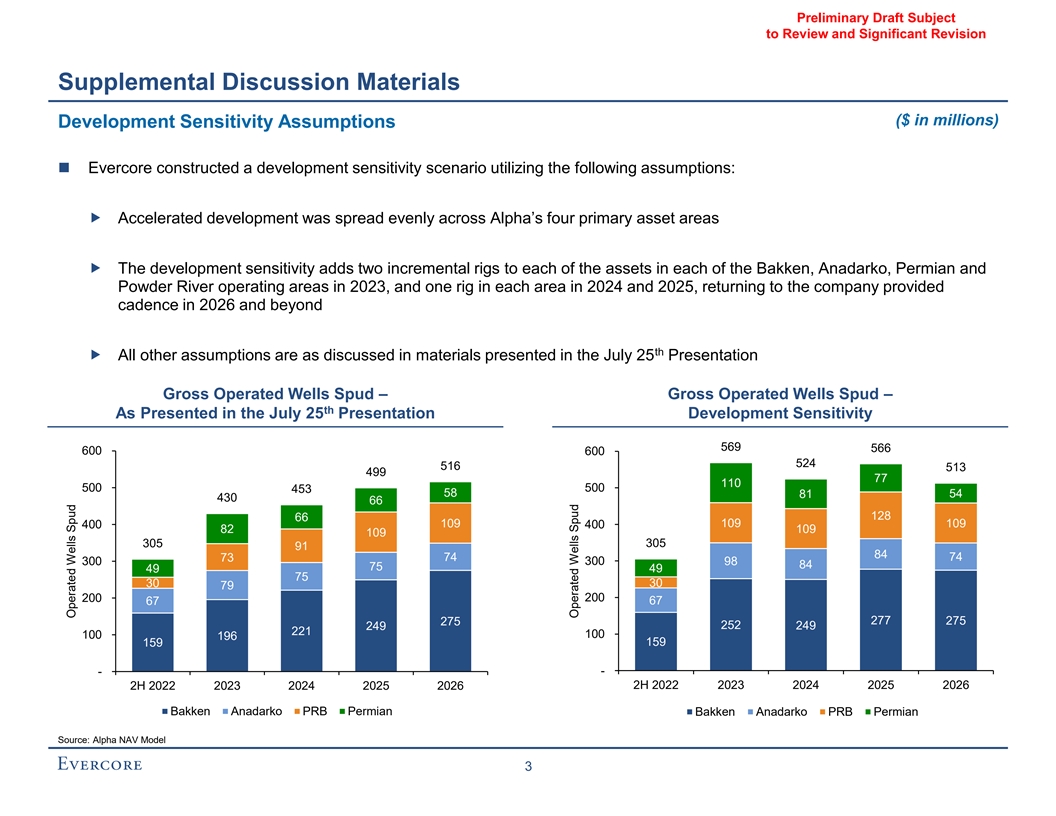
有待審查和重大修訂的初步草案討論材料(百萬美元)開發敏感性假設◼Evercore利用以下假設構建了一個開發敏感性方案:a加速開發均勻分佈在阿爾法的四個主要資產區域;b開發敏感性2023年為巴肯、阿納達科、二疊紀和粉河作業區的每個資產增加兩個增量鑽井平臺,2024年和2025年每個區域增加一個鑽井平臺。回到2026年及以後公司提供的節奏所有其他假設已在7月25日演示文稿中介紹的材料中進行了討論 演示文稿中介紹的開發敏感度569 566 600 600 524 516 513 499 77 110 500 500 453 58 58 81 430 66 128 66 400 109 400 109 109 109 305 305 91 84 73 74 300 300 98 84 75 49 30 30 30 79 200 67 277 275 252 249 221 100 100 196 159--2022 2023 2024 2025 2026 2022 2023 2024 2025 2026 2022 2023 2024 2025 2026 Bakken Anadarko PRB二疊紀Bakken Anadarko PRB二疊紀來源:Alpha NAV Model 3操作井Spud操作井Spud
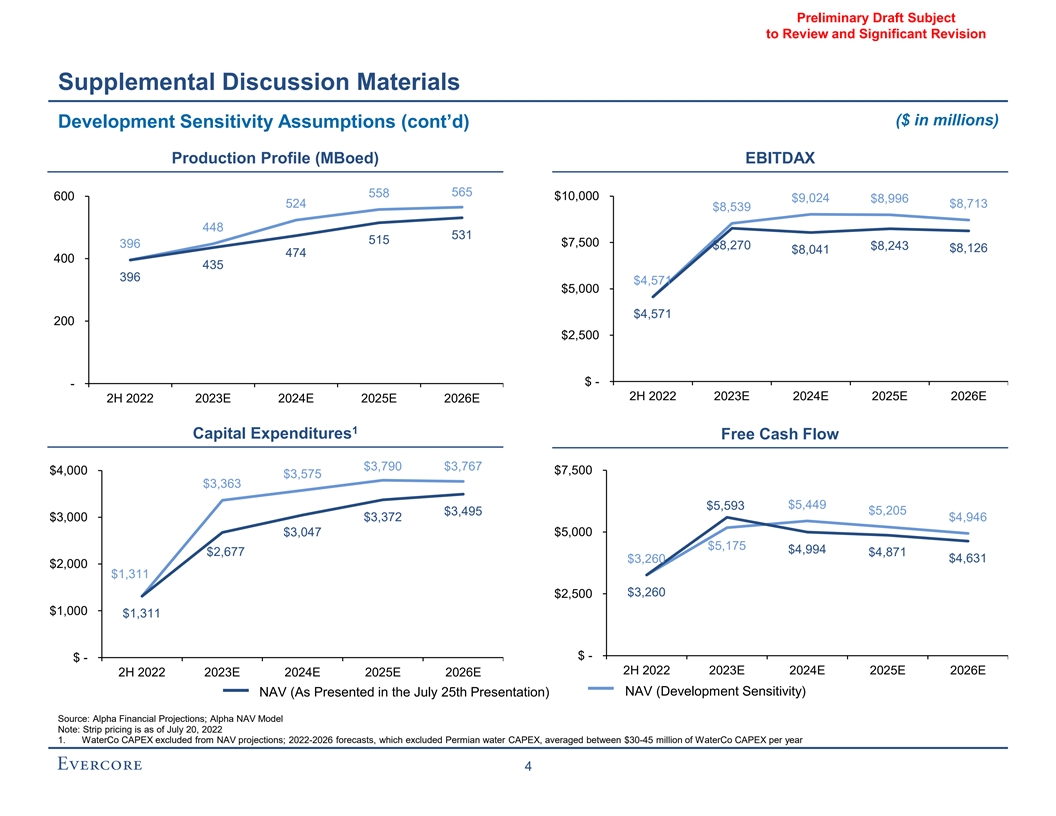
有待審查和重大修訂的討論材料(以百萬美元為單位)發展敏感性假設(續)生產概況(MBOED)EBITDAX 565 558 600$10,000$9,024$8,996 524$8,713$8,539 448 531 515$7,500 396$8,270$8,243$8,126$8,041 474 400 435 396$4,571$5,571$5,571$5,571$5,071 $2,000$2,8H 2022 2023 E 4,331$2,325 E 2025 E 2022 2023E 2024E 2025 E$3,747$3,767,000$3,575$3,363$5,593$449$3,500$205$3,995$3,071$5,000$3,071$5,000$2,000$3,311$3,311$3,311$1,000美元2,747美元2H 2022 2023E 2024E 2025 E$5,767,000$3,575$3,363$5,593$449$3,205$205$4,946$3,071$5,000$3,071$3,071$3,694$2,000$3,311$1,000$2,747$2H 2022 2023E 2024E 2025E$3,767,000$3,575$3,363$5,593$449$3,205$205$3,946$3,071$3,071 $2,694$2,000$3,311$1,000$2,325$2H 2022 2023E 2024E 2024$3,767$3,767,000$3,575$3,363$5,593$449$3,205$205$3,495$3,946$3,071$自由現金流$3,946$3,071$5,2022 2023E 2024E 2025E 2026E 2H 2022 2023E 2024E 2025E 2025E 2026E NAV(發展敏感度)NAV(7月25日演示)來源:Alpha 財務預測;阿爾法淨資產淨值模型注:按2022年7月20日定價1.水務資本支出不包括在資產淨值預測中;2022-2026年預測,不包括二疊紀水務資本支出,平均每年水務資本支出在3,000萬美元至4,500萬美元之間 4
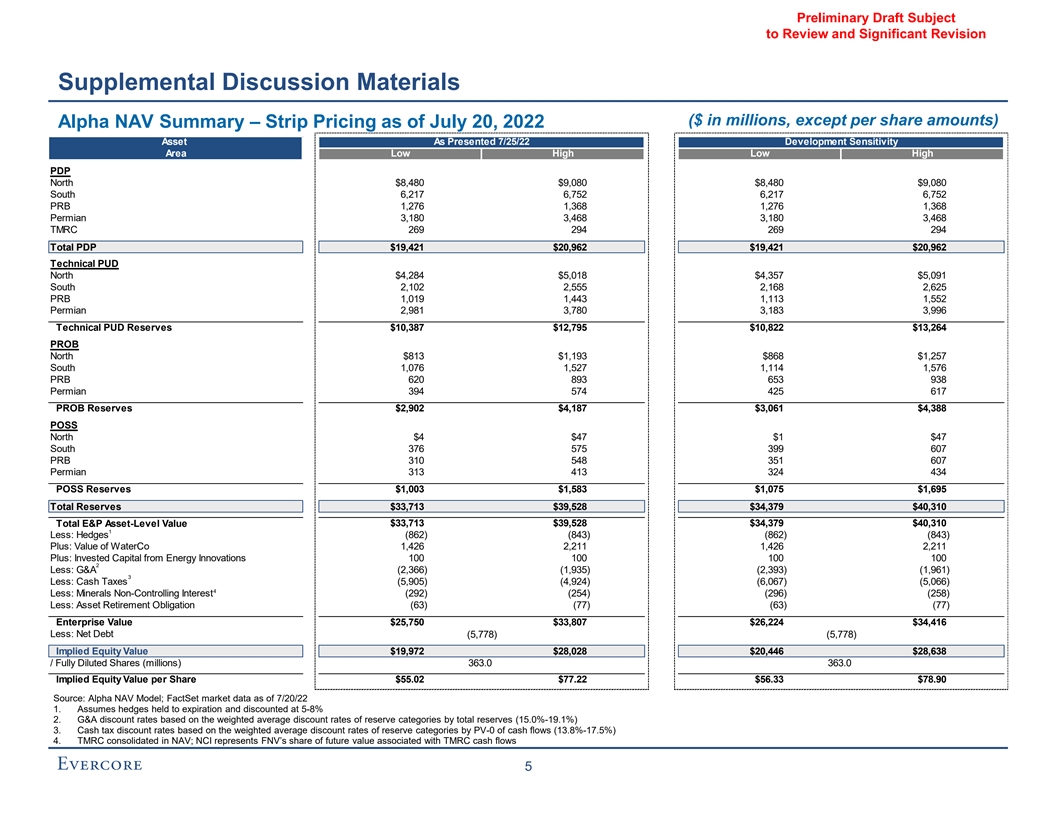
有待審查和重大修訂的初步草案 討論材料(以百萬美元為單位,每股金額除外)阿爾法資產淨值摘要-截至2022年7月20日的資產定價報告7/25/22開發敏感區低高低高PDP北$8,480$9,080$8,480$9,080南6,217 6,752 6,217 6,752 PRB 1,276 1,368 1,276 1,368二疊紀3,180 3,468 3,180 3,468 TMRC 269 294 294總計PDP$19,421$20,962$19,421$20,217962技術PUD北$4,284$5,018$4,357$5,091南2,102 2,555 2,168 2,625 PRB 1,019 1,443 1,113 1,552 二疊系2,981 3,780 3,183 3,996技術PUD儲量$10,387$12,795$10,822$13,264探測北$813$1,193$868$1,257南1,076 1,527 1,527 1,114 1,576 PRB 620 893 953 617探測$2,902$4,187 3,061$4388 POSS北區$4$47$1$47南區376 575 399 607 PRB 310 548 351 607二疊紀313 413 324 434 POSS儲量$1,003$1,583$1,075$1,695總儲量$33,713$39,528$34,379$40,310 E&P總資產水平價值$33,713$39,528$34,379$40,310 1減:對衝 (862)(843)(862)(843)(843)(843)(843)(843)(843)(843)(843)(843)(843)(843)(843)(843)加:水務公司1,426 2,211 1,426 2,211加:來自能源創新的投資資本100 100 100 2366)(1,935)(2,393)(1,961)3少:現金税(5,905)(4,924)(6,067)(5,066)4少:礦產 非控股權益(292)(254)(296)(258)少:資產報廢債務(63)(77)(63)(77)企業價值25,750美元33,807美元26,224美元34,416少:淨債務(5,778)(5,778)隱含股權價值19,972美元28,028美元20,446美元28, 稀釋股份(百萬)363.0 363.0每股隱含權益價值$55.02$77.22$56.33$78.9來源:阿爾法資產淨值模型;FactSet截至7/20/22的市場數據1.假設套期保值持有至到期並以5%-8%的折扣計算2.G&A貼現率基於準備金類別的加權平均貼現率與總準備金的比率(15.0%-19.1%)3.現金税收貼現率基於準備金類別的加權平均貼現率除以現金流的PV-0(13.8%-17.5%)4.TMRC合併在資產淨值中;NCI代表FNV在與TMRC現金流相關的未來價值中所佔的份額
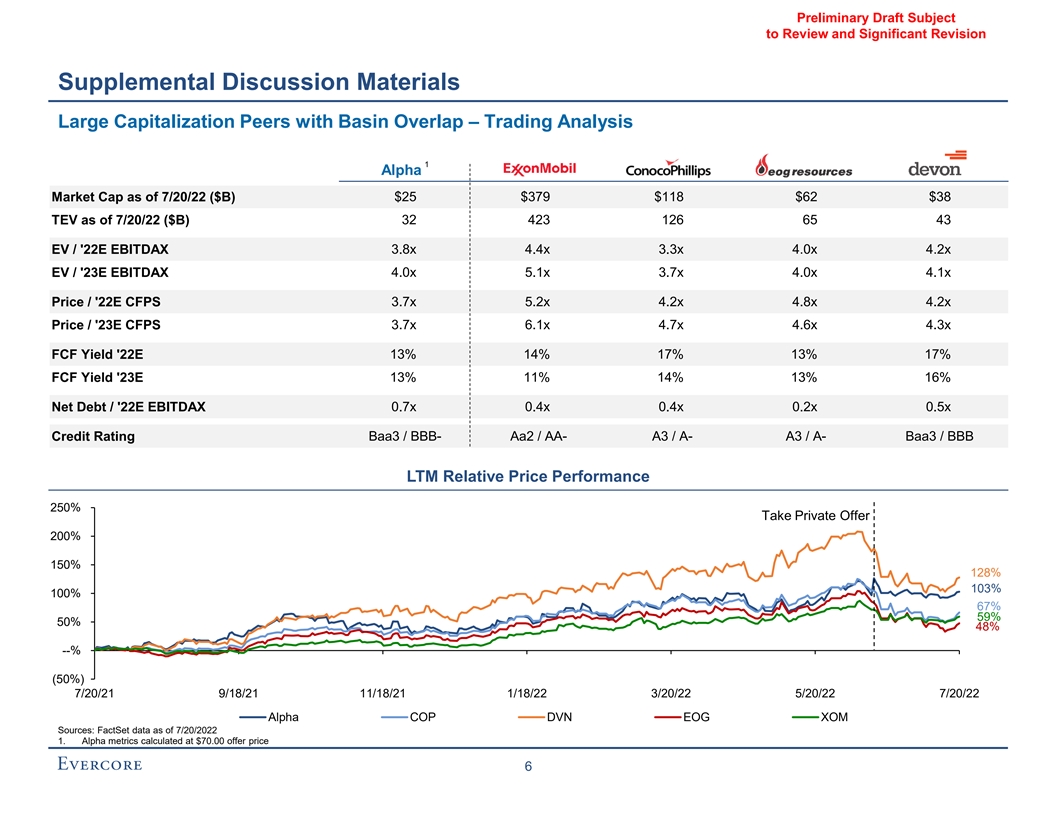
待審查和重大修訂補充討論材料大盤股同行與盆地重疊-交易分析1阿爾法市值截至7/20/22(美元B)$25$379$118$62$38 423 126 65 43 TEV截至7/20/22(美元B)3.8x 4.4x 3.3x 4.0x 4.2x EV/‘22E EBITDAX EV/’23E EBITDAX 4.0x 5.1x 3.7x 4.0x 4.1x價格/‘22E CFPS 3.7x 4.2x 4。8x 4.2 x價格/‘23E CFPS 3.7x 6.1x 4.6x 4.3x FCF收益率’22E 13%14%17%13%17%FCF收益率‘23E 13%11%14%13%16%淨債務/’22E EBITDAX 0.7x 0.4x 0.2x 0.5x信用 評級Baa3/BBB-Aa2/AA-A3/A-A3/A-Baa3/BBB LTM相對性價比250%接受私人要約200%150%128%103%67%59%50%48%--%(50%)7/20/21 9/18/21 11/18/21 1/18/22 3/20/22 5/20/22 7/20/22阿爾法COP DVN EOG XOM來源: 截至2022年7月20日的FactSet數據1.按70.00美元計算的阿爾法指標出價6
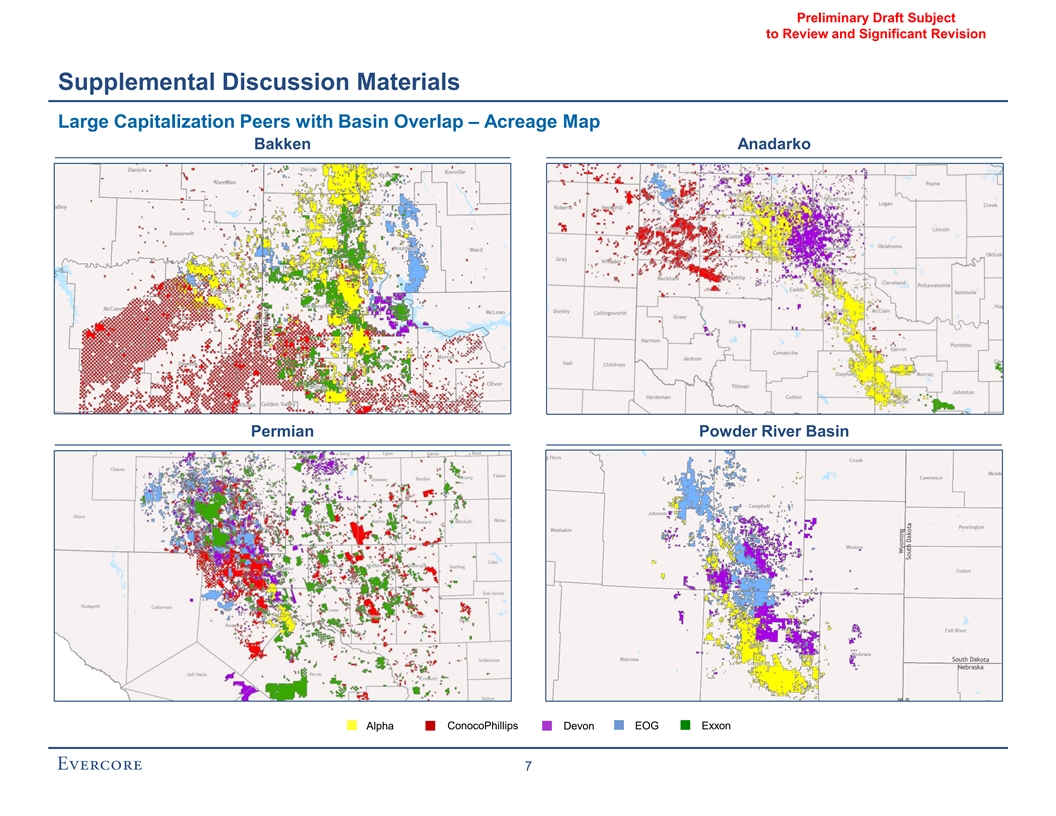
初稿待審閲和重大修訂補充 討論材料大寫與盆地重疊同行-面積圖巴肯阿納達科二疊紀粉河盆地阿爾法康菲石油德文EOG埃克森7
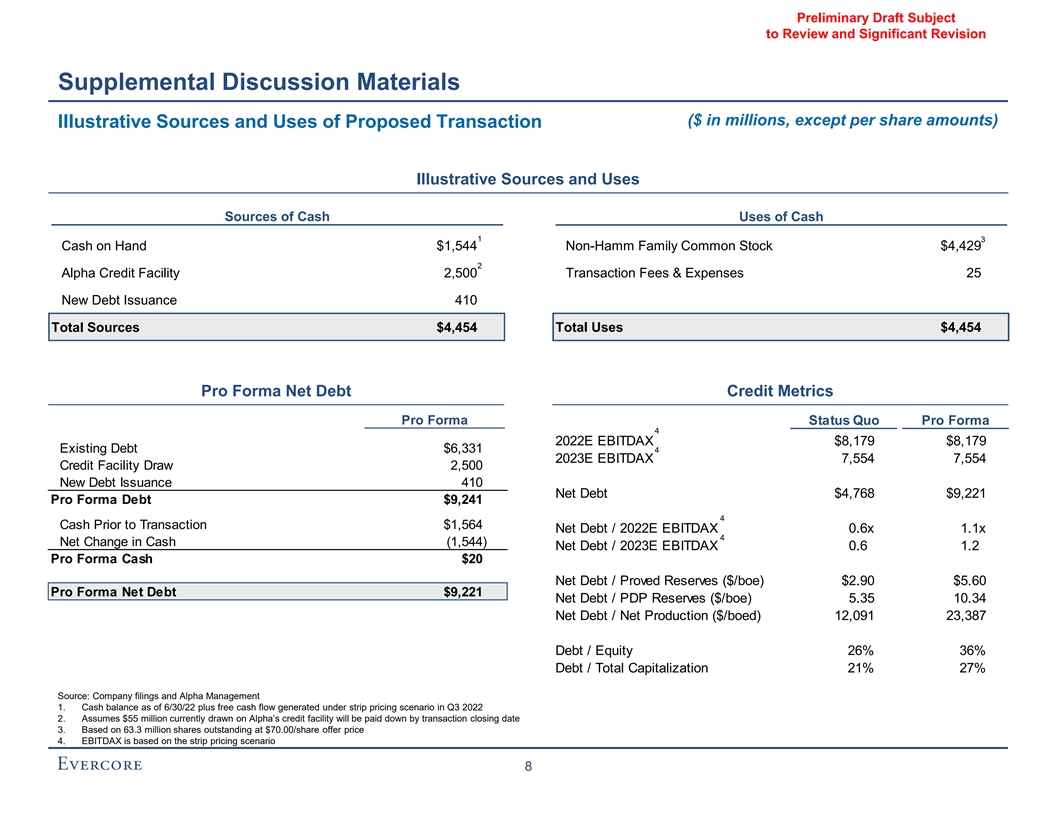
有待審查的初稿和重大修訂 補充討論材料(百萬美元,擬議交易的説明性來源和用途説明性現金使用來源和用途現金1 3手頭現金$1,544非HAMM家族普通股$4,429 2阿爾法信貸安排2,500交易手續費和支出25新債發行410總來源$4,454總使用金額4,454預計淨債務信用指標預計現狀4,179美元現有債務6,331 4 2023E EBITDAX$6,331 4 2023E EBITDAX 7,554 7,554信貸安排2,500新債發行410淨債務4,768美元9,221預計債務9,241 4交易前現金淨債務/2022E EBITDAX 1.1x 4現金淨變化(1,544)淨債務/2023E EBITDAX 0.6 1.2 Pro 形式現金$20淨債務/已探明儲量(美元/boe)$2.90$5.60預計淨債務$9,221淨債務/PDP儲量(美元/boe)5.35 10.34淨債務/淨產量(美元/boed)12,091 23,387債務/股權26%36%債務/總資本21%27%來源: 公司備案和Alpha Management 1.截至2012年6月30日的現金餘額加上在條帶定價方案下產生的自由現金流2022年第三季度2.假設目前從阿爾法信貸安排提取的5500萬美元將在交易完成前償還 日期3。基於6330萬股已發行股票,每股發行價為70.00美元4.EBITDAX基於剝離定價方案8
有待審查的初稿和重大修訂 附錄
待審閲的初稿和重大修訂 補充詳細信息
有待審查的初步草案和重大修訂 阿爾法資產淨值假設的補充詳細概述◼估值假設生效日期為2022年7月1日(即資產淨值現金流的起點)◼預計產量和現金流基於阿爾法於2022年6月28日提供的阿爾法資產淨值模型,並向前滾動至2022年7月1日阿爾法向PDP提供更新的生效日期,剩餘位置和鑽探節奏作為此次前滾的一部分?根據Evercore對阿爾法資產淨值模型◼中提供的類型曲線區域的審查而選定的折現率 在阿爾法資產淨值模型中提供的對衝組合截至2022年5月24日的◼G&A假設是基於公司在阿爾法資產淨值模型中提供的預測每阿爾法管理層, G&A假設為1.5美元/BOE,每年最多3.5億美元。並在2045年阿納達科盆地鑽井平臺全部利用完成後減少50%2021年年末現金税假設淨資本化成本為167億美元,2021年年末聯邦政府和俄克拉荷馬州NOL餘額分別為12億美元和31億美元,分別前滾至2022年7月1日和2022年7月1日◼現金税貼現率基於適用於未貼現現金流的加權平均的現金税貼現率 基於Alpha提供的截至2022年6月30日餘額的◼類淨債務◼完全稀釋後的流通股,基於Alpha提供的股份計數截至2022年5月24日◼水務公司作為獨立實體進行估值包括所有資本支出 ◼完全合併的TMRC,扣除與FNV在風險◼峯會中的經濟權益相關的非控股權益,截至2022年6月30日的投資資本(包括投資於Ekona Power的資本) 9
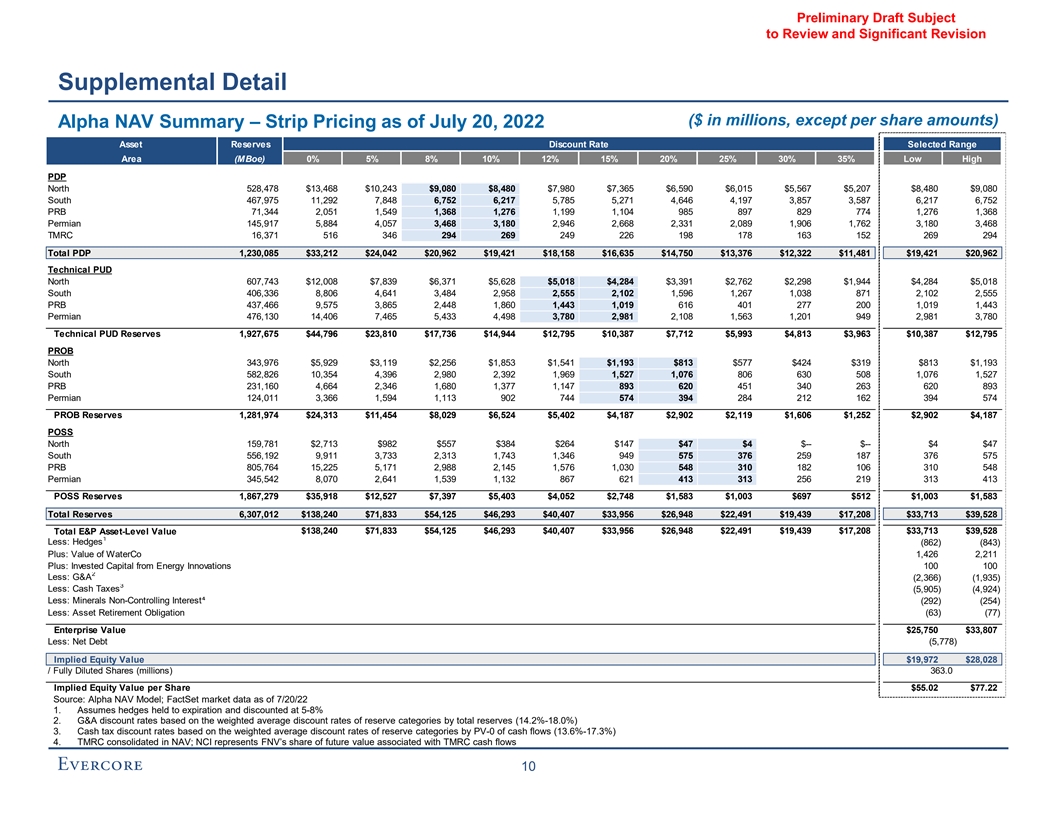
Preliminary Draft Subject to Review and Significant Revision Supplemental Detail ($ in millions, except per share amounts) Alpha NAV Summary – Strip Pricing as of July 20, 2022 Asset Reserves Discount Rate Selected Range Area (MBoe) 0% 5% 8% 10% 12% 15% 20% 25% 30% 35% Low High Discount Rates PDP North 528,478 $13,468 $10,243 $9,080 $8,480 $7,980 $7,365 $6,590 $6,015 $5,567 $5,207 $8,480 $9,080 South 467,975 11,292 7,848 6,752 6,217 5,785 5,271 4,646 4,197 3,857 3,587 6,217 6,752 PRB 71,344 2,051 1,549 1,368 1,276 1,199 1,104 985 897 829 774 1,276 1,368 Permian 145,917 5,884 4,057 3,468 3,180 2,946 2,668 2,331 2,089 1,906 1,762 3,180 3,468 TMRC 16,371 516 346 294 269 249 226 198 178 163 152 269 294 Total PDP 1,230,085 $33,212 $24,042 $20,962 $19,421 $18,158 $16,635 $14,750 $13,376 $12,322 $11,481 $19,421 $20,962 Technical PUD North 607,743 $12,008 $7,839 $6,371 $5,628 $5,018 $4,284 $3,391 $2,762 $2,298 $1,944 $4,284 $5,018 South 406,336 8,806 4,641 3,484 2,958 2,555 2,102 1,596 1,267 1,038 871 2,102 2,555 PRB 437,466 9,575 3,865 2,448 1,860 1,443 1,019 616 401 277 200 1,019 1,443 Permian 476,130 14,406 7,465 5,433 4,498 3,780 2,981 2,108 1,563 1,201 949 2,981 3,780 Technical PUD Reserves 1,927,675 $44,796 $23,810 $17,736 $14,944 $12,795 $10,387 $7,712 $5,993 $4,813 $3,963 $10,387 $12,795 PROB North 343,976 $5,929 $3,119 $2,256 $1,853 $1,541 $1,193 $813 $577 $424 $319 $813 $1,193 South 582,826 10,354 4,396 2,980 2,392 1,969 1,527 1,076 806 630 508 1,076 1,527 PRB 231,160 4,664 2,346 1,680 1,377 1,147 893 620 451 340 263 620 893 Permian 124,011 3,366 1,594 1,113 902 744 574 394 284 212 162 394 574 PROB Reserves 1,281,974 $24,313 $11,454 $8,029 $6,524 $5,402 $4,187 $2,902 $2,119 $1,606 $1,252 $2,902 $4,187 POSS North 159,781 $2,713 $982 $557 $384 $264 $147 $47 $4 $-- $-- $4 $47 South 556,192 9,911 3,733 2,313 1,743 1,346 949 575 376 259 187 376 575 PRB 805,764 15,225 5,171 2,988 2,145 1,576 1,030 548 310 182 106 310 548 Permian 345,542 8,070 2,641 1,539 1,132 867 621 413 313 256 219 313 413 POSS Reserves 1,867,279 $35,918 $12,527 $7,397 $5,403 $4,052 $2,748 $1,583 $1,003 $697 $512 $1,003 $1,583 Total Reserves 6,307,012 $138,240 $71,833 $54,125 $46,293 $40,407 $33,956 $26,948 $22,491 $19,439 $17,208 $33,713 $39,528 Total E&P Asset-Level Value $138,240 $71,833 $54,125 $46,293 $40,407 $33,956 $26,948 $22,491 $19,439 $17,208 $33,713 $39,528 1 Less: Hedges (862) (843) Plus: Value of WaterCo 1,426 2,211 Plus: Invested Capital from Energy Innovations 100 100 2 Less: G&A (2,366) (1,935) 3 Less: Cash Taxes (5,905) (4,924) Less: Minerals Non-Controlling Interest⁴ (292) (254) Less: Asset Retirement Obligation (63) (77) Enterprise Value $25,750 $33,807 Less: Net Debt (5,778) Implied Equity Value $19,972 $28,028 / Fully Diluted Shares (millions) 363.0 Implied Equity Value per Share $55.02 $77.22 Source: Alpha NAV Model; FactSet market data as of 7/20/22 1. Assumes hedges held to expiration and discounted at 5-8% 2. G&A discount rates based on the weighted average discount rates of reserve categories by total reserves (14.2%-18.0%) 3. Cash tax discount rates based on the weighted average discount rates of reserve categories by PV-0 of cash flows (13.6%-17.3%) 4. TMRC consolidated in NAV; NCI represents FNV’s share of future value associated with TMRC cash flows 10
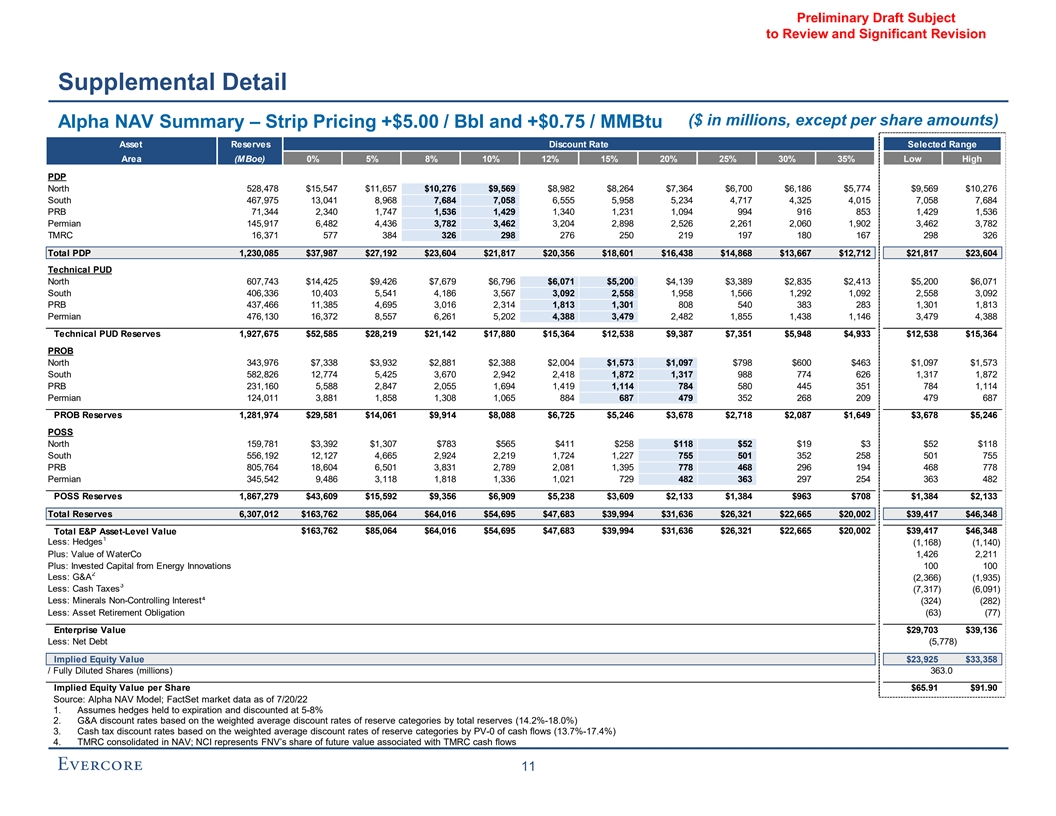
Preliminary Draft Subject to Review and Significant Revision Supplemental Detail ($ in millions, except per share amounts) Alpha NAV Summary – Strip Pricing +$5.00 / Bbl and +$0.75 / MMBtu Asset Reserves Discount Rate Selected Range Area (MBoe) 0% 5% 8% 10% 12% 15% 20% 25% 30% 35% Low High Discount Rates PDP North 528,478 $15,547 $11,657 $10,276 $9,569 $8,982 $8,264 $7,364 $6,700 $6,186 $5,774 $9,569 $10,276 South 467,975 13,041 8,968 7,684 7,058 6,555 5,958 5,234 4,717 4,325 4,015 7,058 7,684 PRB 71,344 2,340 1,747 1,536 1,429 1,340 1,231 1,094 994 916 853 1,429 1,536 Permian 145,917 6,482 4,436 3,782 3,462 3,204 2,898 2,526 2,261 2,060 1,902 3,462 3,782 TMRC 16,371 577 384 326 298 276 250 219 197 180 167 298 326 Total PDP 1,230,085 $37,987 $27,192 $23,604 $21,817 $20,356 $18,601 $16,438 $14,868 $13,667 $12,712 $21,817 $23,604 Technical PUD North 607,743 $14,425 $9,426 $7,679 $6,796 $6,071 $5,200 $4,139 $3,389 $2,835 $2,413 $5,200 $6,071 South 406,336 10,403 5,541 4,186 3,567 3,092 2,558 1,958 1,566 1,292 1,092 2,558 3,092 PRB 437,466 11,385 4,695 3,016 2,314 1,813 1,301 808 540 383 283 1,301 1,813 Permian 476,130 16,372 8,557 6,261 5,202 4,388 3,479 2,482 1,855 1,438 1,146 3,479 4,388 Technical PUD Reserves 1,927,675 $52,585 $28,219 $21,142 $17,880 $15,364 $12,538 $9,387 $7,351 $5,948 $4,933 $12,538 $15,364 PROB North 343,976 $7,338 $3,932 $2,881 $2,388 $2,004 $1,573 $1,097 $798 $600 $463 $1,097 $1,573 South 582,826 12,774 5,425 3,670 2,942 2,418 1,872 1,317 988 774 626 1,317 1,872 PRB 231,160 5,588 2,847 2,055 1,694 1,419 1,114 784 580 445 351 784 1,114 Permian 124,011 3,881 1,858 1,308 1,065 884 687 479 352 268 209 479 687 PROB Reserves 1,281,974 $29,581 $14,061 $9,914 $8,088 $6,725 $5,246 $3,678 $2,718 $2,087 $1,649 $3,678 $5,246 POSS North 159,781 $3,392 $1,307 $783 $565 $411 $258 $118 $52 $19 $3 $52 $118 South 556,192 12,127 4,665 2,924 2,219 1,724 1,227 755 501 352 258 501 755 PRB 805,764 18,604 6,501 3,831 2,789 2,081 1,395 778 468 296 194 468 778 Permian 345,542 9,486 3,118 1,818 1,336 1,021 729 482 363 297 254 363 482 POSS Reserves 1,867,279 $43,609 $15,592 $9,356 $6,909 $5,238 $3,609 $2,133 $1,384 $963 $708 $1,384 $2,133 Total Reserves 6,307,012 $163,762 $85,064 $64,016 $54,695 $47,683 $39,994 $31,636 $26,321 $22,665 $20,002 $39,417 $46,348 Total E&P Asset-Level Value $163,762 $85,064 $64,016 $54,695 $47,683 $39,994 $31,636 $26,321 $22,665 $20,002 $39,417 $46,348 1 Less: Hedges (1,168) (1,140) Plus: Value of WaterCo 1,426 2,211 Plus: Invested Capital from Energy Innovations 100 100 2 Less: G&A (2,366) (1,935) 3 Less: Cash Taxes (7,317) (6,091) Less: Minerals Non-Controlling Interest⁴ (324) (282) Less: Asset Retirement Obligation (63) (77) Enterprise Value $29,703 $39,136 Less: Net Debt (5,778) Implied Equity Value $23,925 $33,358 / Fully Diluted Shares (millions) 363.0 Implied Equity Value per Share $65.91 $91.90 Source: Alpha NAV Model; FactSet market data as of 7/20/22 1. Assumes hedges held to expiration and discounted at 5-8% 2. G&A discount rates based on the weighted average discount rates of reserve categories by total reserves (14.2%-18.0%) 3. Cash tax discount rates based on the weighted average discount rates of reserve categories by PV-0 of cash flows (13.7%-17.4%) 4. TMRC consolidated in NAV; NCI represents FNV’s share of future value associated with TMRC cash flows 11

Preliminary Draft Subject to Review and Significant Revision Supplemental Detail ($ in millions, except per share amounts) Alpha NAV Summary – Strip Pricing -$5.00 / Bbl and -$0.75 / MMBtu Asset Reserves Discount Rate Selected Range Area (MBoe) 0% 5% 8% 10% 12% 15% 20% 25% 30% 35% Low High Discount Rates PDP North 528,478 $11,390 $8,829 $7,883 $7,391 $6,978 $6,467 $5,816 $5,329 $4,948 $4,639 $7,391 $7,883 South 467,975 9,543 6,728 5,821 5,376 5,014 4,584 4,057 3,678 3,388 3,159 5,376 5,821 PRB 71,344 1,762 1,351 1,200 1,123 1,058 978 876 801 742 694 1,123 1,200 Permian 145,917 5,286 3,677 3,154 2,897 2,688 2,439 2,135 1,917 1,752 1,621 2,897 3,154 TMRC 16,371 456 307 261 240 222 202 178 160 147 137 240 261 Total PDP 1,230,085 $28,438 $20,891 $18,321 $17,026 $15,960 $14,668 $13,062 $11,885 $10,976 $10,250 $17,026 $18,321 Technical PUD North 607,743 $9,610 $6,256 $5,065 $4,461 $3,964 $3,368 $2,643 $2,134 $1,760 $1,476 $3,368 $3,964 South 406,336 7,209 3,741 2,783 2,349 2,017 1,647 1,235 968 784 650 1,647 2,017 PRB 437,466 7,765 3,035 1,880 1,406 1,072 738 425 263 171 116 738 1,072 Permian 476,130 12,441 6,373 4,605 3,794 3,173 2,484 1,735 1,270 964 752 2,484 3,173 Technical PUD Reserves 1,927,675 $37,025 $19,406 $14,333 $12,009 $10,226 $8,236 $6,038 $4,635 $3,679 $2,994 $8,236 $10,226 PROB North 343,976 $4,531 $2,308 $1,632 $1,319 $1,079 $813 $528 $356 $247 $175 $528 $813 South 582,826 7,933 3,366 2,289 1,843 1,521 1,183 835 625 486 389 835 1,183 PRB 231,160 3,741 1,845 1,304 1,060 875 672 455 322 236 176 455 672 Permian 124,011 2,851 1,329 919 739 605 460 309 217 157 115 309 460 PROB Reserves 1,281,974 $19,057 $8,849 $6,145 $4,960 $4,079 $3,128 $2,127 $1,520 $1,126 $855 $2,127 $3,128 POSS North 159,781 $2,037 $658 $332 $203 $117 $37 $-- $-- $-- $-- $-- $-- South 556,192 7,694 2,801 1,703 1,267 967 670 395 250 167 115 250 395 PRB 805,764 11,846 3,840 2,144 1,500 1,071 666 317 153 67 19 153 317 Permian 345,542 6,655 2,164 1,260 928 712 513 345 263 216 185 263 345 POSS Reserves 1,867,279 $28,231 $9,464 $5,439 $3,898 $2,867 $1,887 $1,057 $666 $450 $320 $666 $1,057 Total Reserves 6,307,012 $112,752 $58,609 $44,237 $37,894 $33,132 $27,919 $22,284 $18,706 $16,231 $14,418 $28,054 $32,732 Total E&P Asset-Level Value $112,752 $58,609 $44,237 $37,894 $33,132 $27,919 $22,284 $18,706 $16,231 $14,418 $28,054 $32,732 1 Less: Hedges (557) (546) Plus: Value of WaterCo 1,426 2,211 Plus: Invested Capital from Energy Innovations 100 100 2 Less: G&A (2,366) (1,935) 3 Less: Cash Taxes (4,487) (3,753) Less: Minerals Non-Controlling Interest⁴ (259) (226) Less: Asset Retirement Obligation (63) (77) Enterprise Value $21,847 $28,506 Less: Net Debt (5,778) Implied Equity Value $16,069 $22,728 / Fully Diluted Shares (millions) 363.0 Implied Equity Value per Share $44.27 $62.62 Source: Alpha NAV Model; FactSet market data as of 7/20/22 1. Assumes hedges held to expiration and discounted at 5-8% 2. G&A discount rates based on the weighted average discount rates of reserve categories by total reserves (14.2%-18.0%) 3. Cash tax discount rates based on the weighted average discount rates of reserve categories by PV-0 of cash flows (13.5%-17.1%) 4. TMRC consolidated in NAV; NCI represents FNV’s share of future value associated with TMRC cash flows 12
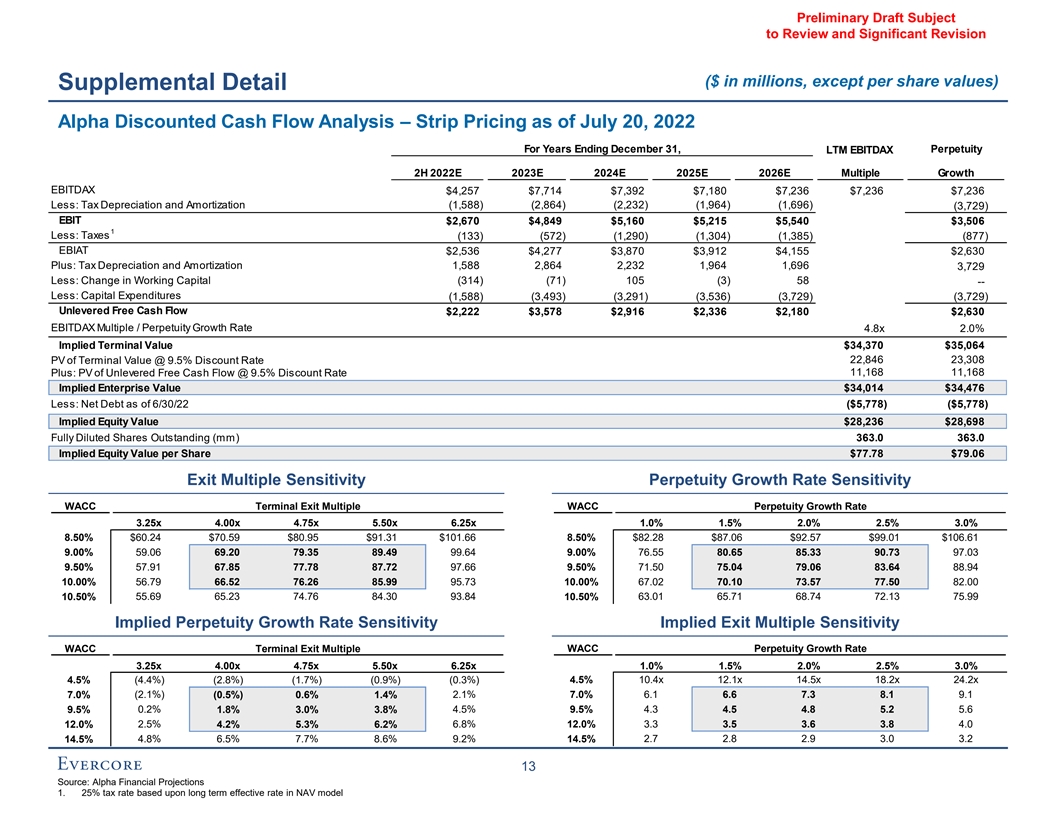
Preliminary Draft Subject to Review and Significant Revision ($ in millions, except per share values) Supplemental Detail Alpha Discounted Cash Flow Analysis – Strip Pricing as of July 20, 2022 For Years Ending December 31, LTM EBITDAX Perpetuity 2H 2022E 2023E 2024E 2025E 2026E Multiple Growth EBITDAX $4,257 $7,714 $7,392 $7,180 $7,236 $7,236 $7,236 Less: Tax Depreciation and Amortization (1,588) (2,864) (2,232) (1,964) (1,696) (3,729) EBIT $2,670 $4,849 $5,160 $5,215 $5,540 $3,506 1 Less: Taxes (133) (572) (1,290) (1,304) (1,385) (877) EBIAT $2,536 $4,277 $3,870 $3,912 $4,155 $2,630 Plus: Tax Depreciation and Amortization 1,588 2,864 2,232 1,964 1,696 3,729 Less: Change in Working Capital (314) (71) 105 (3) 58 -- Less: Capital Expenditures (1,588) (3,493) (3,291) (3,536) (3,729) (3,729) Unlevered Free Cash Flow $2,222 $3,578 $2,916 $2,336 $2,180 $2,630 EBITDAX Multiple / Perpetuity Growth Rate 4.8x 2.0% Implied Terminal Value $34,370 $35,064 PV of Terminal Value @ 9.5% Discount Rate 22,846 23,308 11,168 11,168 Plus: PV of Unlevered Free Cash Flow @ 9.5% Discount Rate Implied Enterprise Value $34,014 $34,476 Less: Net Debt as of 6/30/22 ($5,778) ($5,778) Implied Equity Value $28,236 $28,698 Fully Diluted Shares Outstanding (mm) 363.0 363.0 Implied Equity Value per Share $77.78 $79.06 Exit Multiple Sensitivity Perpetuity Growth Rate Sensitivity WACC Terminal Exit Multiple WACC Perpetuity Growth Rate 3.25x 4.00x 4.75x 5.50x 6.25x 1.0% 1.5% 2.0% 2.5% 3.0% 8.50% $60.24 $70.59 $80.95 $91.31 $101.66 8.50% $82.28 $87.06 $92.57 $99.01 $106.61 9.00% 59.06 69.20 79.35 89.49 99.64 9.00% 76.55 80.65 85.33 90.73 97.03 9.50% 57.91 67.85 77.78 87.72 97.66 9.50% 71.50 75.04 79.06 83.64 88.94 10.00% 56.79 66.52 76.26 85.99 95.73 10.00% 67.02 70.10 73.57 77.50 82.00 10.50% 55.69 65.23 74.76 84.30 93.84 10.50% 63.01 65.71 68.74 72.13 75.99 Implied Perpetuity Growth Rate Sensitivity Implied Exit Multiple Sensitivity WACC Terminal Exit Multiple WACC Perpetuity Growth Rate 3.25x 4.00x 4.75x 5.50x 6.25x 1.0% 1.5% 2.0% 2.5% 3.0% 4.5% (4.4%) (2.8%) (1.7%) (0.9%) (0.3%) 4.5% 10.4x 12.1x 14.5x 18.2x 24.2x 7.0% (2.1%) (0.5%) 0.6% 1.4% 2.1% 7.0% 6.1 6.6 7.3 8.1 9.1 9.5% 0.2% 1.8% 3.0% 3.8% 4.5% 9.5% 4.3 4.5 4.8 5.2 5.6 12.0% 2.5% 4.2% 5.3% 6.2% 6.8% 12.0% 3.3 3.5 3.6 3.8 4.0 14.5% 4.8% 6.5% 7.7% 8.6% 9.2% 14.5% 2.7 2.8 2.9 3.0 3.2 13 Source: Alpha Financial Projections 1. 25% tax rate based upon long term effective rate in NAV model
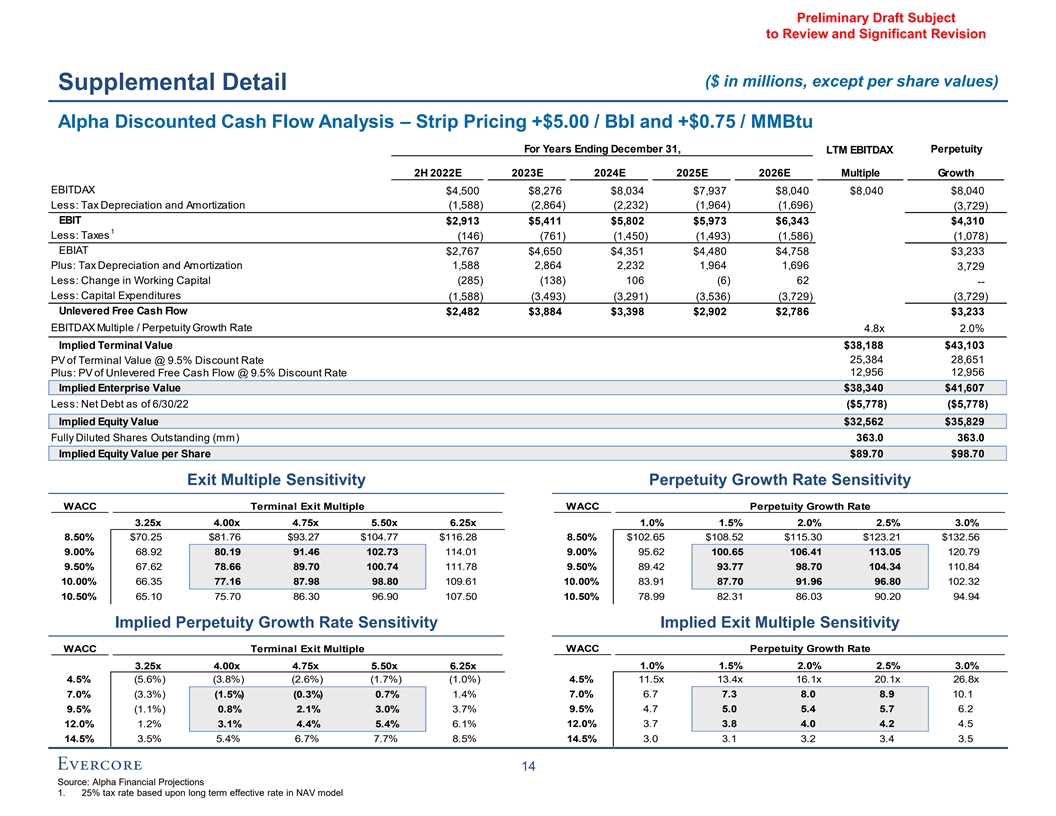
Preliminary Draft Subject to Review and Significant Revision ($ in millions, except per share values) Supplemental Detail Alpha Discounted Cash Flow Analysis – Strip Pricing +$5.00 / Bbl and +$0.75 / MMBtu For Years Ending December 31, LTM EBITDAX Perpetuity 2H 2022E 2023E 2024E 2025E 2026E Multiple Growth EBITDAX $4,500 $8,276 $8,034 $7,937 $8,040 $8,040 $8,040 Less: Tax Depreciation and Amortization (1,588) (2,864) (2,232) (1,964) (1,696) (3,729) EBIT $2,913 $5,411 $5,802 $5,973 $6,343 $4,310 1 Less: Taxes (146) (761) (1,450) (1,493) (1,586) (1,078) EBIAT $2,767 $4,650 $4,351 $4,480 $4,758 $3,233 Plus: Tax Depreciation and Amortization 1,588 2,864 2,232 1,964 1,696 3,729 Less: Change in Working Capital (285) (138) 106 (6) 62 -- Less: Capital Expenditures (1,588) (3,493) (3,291) (3,536) (3,729) (3,729) Unlevered Free Cash Flow $2,482 $3,884 $3,398 $2,902 $2,786 $3,233 EBITDAX Multiple / Perpetuity Growth Rate 4.8x 2.0% Implied Terminal Value $38,188 $43,103 PV of Terminal Value @ 9.5% Discount Rate 25,384 28,651 12,956 12,956 Plus: PV of Unlevered Free Cash Flow @ 9.5% Discount Rate Implied Enterprise Value $38,340 $41,607 Less: Net Debt as of 6/30/22 ($5,778) ($5,778) Implied Equity Value $32,562 $35,829 Fully Diluted Shares Outstanding (mm) 363.0 363.0 Implied Equity Value per Share $89.70 $98.70 Exit Multiple Sensitivity Perpetuity Growth Rate Sensitivity WACC Terminal Exit Multiple WACC Perpetuity Growth Rate 3.25x 4.00x 4.75x 5.50x 6.25x 1.0% 1.5% 2.0% 2.5% 3.0% 8.50% $70.25 $81.76 $93.27 $104.77 $116.28 8.50% $102.65 $108.52 $115.30 $123.21 $132.56 9.00% 68.92 80.19 91.46 102.73 114.01 9.00% 95.62 100.65 106.41 113.05 120.79 9.50% 67.62 78.66 89.70 100.74 111.78 9.50% 89.42 93.77 98.70 104.34 110.84 10.00% 66.35 77.16 87.98 98.80 109.61 10.00% 83.91 87.70 91.96 96.80 102.32 10.50% 65.10 75.70 86.30 96.90 107.50 10.50% 78.99 82.31 86.03 90.20 94.94 Implied Perpetuity Growth Rate Sensitivity Implied Exit Multiple Sensitivity WACC Terminal Exit Multiple WACC Perpetuity Growth Rate 3.25x 4.00x 4.75x 5.50x 6.25x 1.0% 1.5% 2.0% 2.5% 3.0% 4.5% (5.6%) (3.8%) (2.6%) (1.7%) (1.0%) 4.5% 11.5x 13.4x 16.1x 20.1x 26.8x 7.0% (3.3%) (1.5%) (0.3%) 0.7% 1.4% 7.0% 6.7 7.3 8.0 8.9 10.1 9.5% 4.7 5.0 5.4 5.7 6.2 9.5% (1.1%) 0.8% 2.1% 3.0% 3.7% 12.0% 1.2% 3.1% 4.4% 5.4% 6.1% 12.0% 3.7 3.8 4.0 4.2 4.5 14.5% 3.5% 5.4% 6.7% 7.7% 8.5% 14.5% 3.0 3.1 3.2 3.4 3.5 14 Source: Alpha Financial Projections 1. 25% tax rate based upon long term effective rate in NAV model
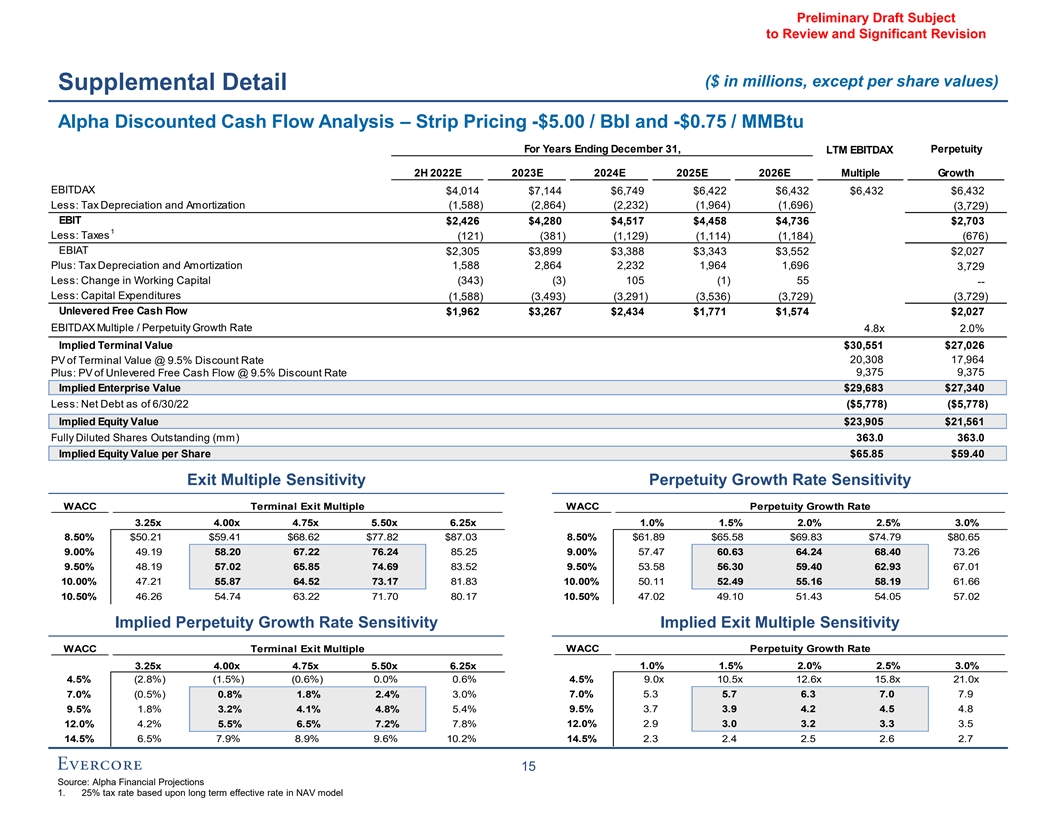
Preliminary Draft Subject to Review and Significant Revision ($ in millions, except per share values) Supplemental Detail Alpha Discounted Cash Flow Analysis – Strip Pricing -$5.00 / Bbl and -$0.75 / MMBtu For Years Ending December 31, LTM EBITDAX Perpetuity 2H 2022E 2023E 2024E 2025E 2026E Multiple Growth EBITDAX $4,014 $7,144 $6,749 $6,422 $6,432 $6,432 $6,432 Less: Tax Depreciation and Amortization (1,588) (2,864) (2,232) (1,964) (1,696) (3,729) EBIT $2,426 $4,280 $4,517 $4,458 $4,736 $2,703 1 Less: Taxes (121) (381) (1,129) (1,114) (1,184) (676) EBIAT $2,305 $3,899 $3,388 $3,343 $3,552 $2,027 Plus: Tax Depreciation and Amortization 1,588 2,864 2,232 1,964 1,696 3,729 Less: Change in Working Capital (343) (3) 105 (1) 55 -- Less: Capital Expenditures (1,588) (3,493) (3,291) (3,536) (3,729) (3,729) Unlevered Free Cash Flow $1,962 $3,267 $2,434 $1,771 $1,574 $2,027 EBITDAX Multiple / Perpetuity Growth Rate 4.8x 2.0% Implied Terminal Value $30,551 $27,026 PV of Terminal Value @ 9.5% Discount Rate 20,308 17,964 9,375 9,375 Plus: PV of Unlevered Free Cash Flow @ 9.5% Discount Rate Implied Enterprise Value $29,683 $27,340 Less: Net Debt as of 6/30/22 ($5,778) ($5,778) Implied Equity Value $23,905 $21,561 Fully Diluted Shares Outstanding (mm) 363.0 363.0 Implied Equity Value per Share $65.85 $59.40 Exit Multiple Sensitivity Perpetuity Growth Rate Sensitivity WACC Terminal Exit Multiple WACC Perpetuity Growth Rate 3.25x 4.00x 4.75x 5.50x 6.25x 1.0% 1.5% 2.0% 2.5% 3.0% 8.50% $50.21 $59.41 $68.62 $77.82 $87.03 8.50% $61.89 $65.58 $69.83 $74.79 $80.65 9.00% 49.19 58.20 67.22 76.24 85.25 9.00% 57.47 60.63 64.24 68.40 73.26 9.50% 48.19 57.02 65.85 74.69 83.52 9.50% 53.58 56.30 59.40 62.93 67.01 10.00% 47.21 55.87 64.52 73.17 81.83 10.00% 50.11 52.49 55.16 58.19 61.66 10.50% 46.26 54.74 63.22 71.70 80.17 10.50% 47.02 49.10 51.43 54.05 57.02 Implied Perpetuity Growth Rate Sensitivity Implied Exit Multiple Sensitivity WACC Terminal Exit Multiple WACC Perpetuity Growth Rate 3.25x 4.00x 4.75x 5.50x 6.25x 1.0% 1.5% 2.0% 2.5% 3.0% 4.5% (2.8%) (1.5%) (0.6%) 0.0% 0.6% 4.5% 9.0x 10.5x 12.6x 15.8x 21.0x 7.0% (0.5%) 0.8% 1.8% 2.4% 3.0% 7.0% 5.3 5.7 6.3 7.0 7.9 9.5% 3.7 3.9 4.2 4.5 4.8 9.5% 1.8% 3.2% 4.1% 4.8% 5.4% 12.0% 4.2% 5.5% 6.5% 7.2% 7.8% 12.0% 2.9 3.0 3.2 3.3 3.5 14.5% 6.5% 7.9% 8.9% 9.6% 10.2% 14.5% 2.3 2.4 2.5 2.6 2.7 15 Source: Alpha Financial Projections 1. 25% tax rate based upon long term effective rate in NAV model
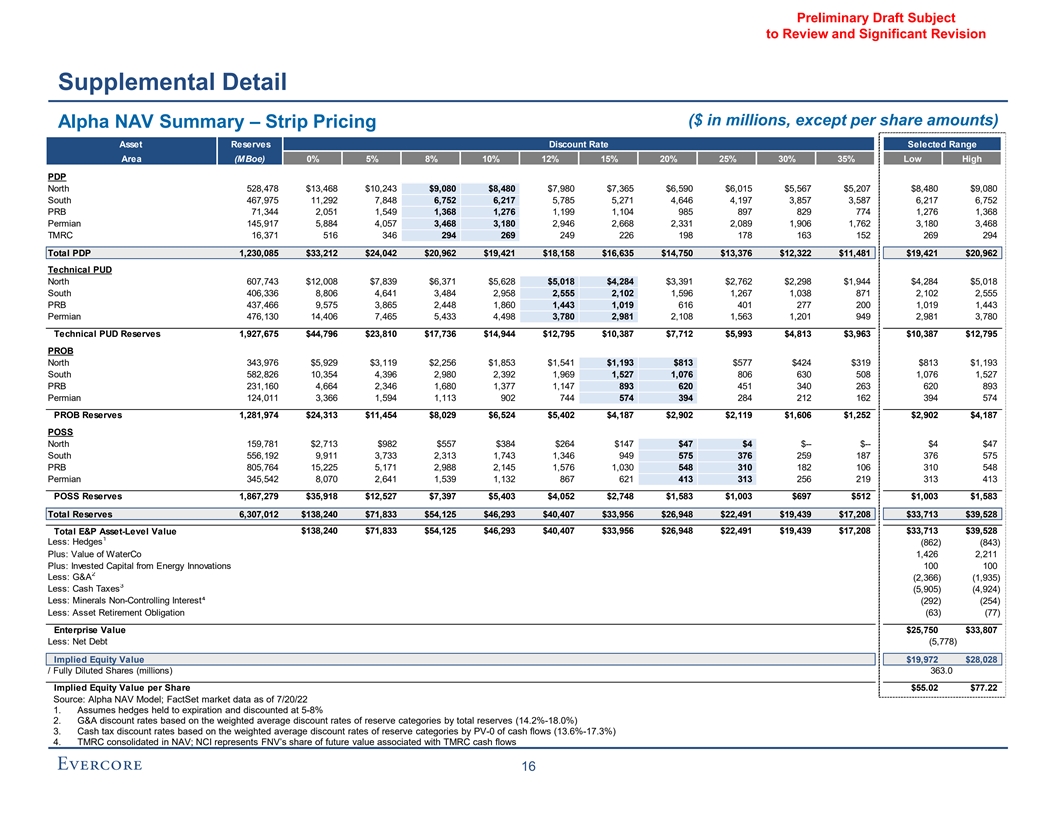
Preliminary Draft Subject to Review and Significant Revision Supplemental Detail ($ in millions, except per share amounts) Alpha NAV Summary – Strip Pricing Asset Reserves Discount Rate Selected Range Area (MBoe) 0% 5% 8% 10% 12% 15% 20% 25% 30% 35% Low High Discount Rates PDP North 528,478 $13,468 $10,243 $9,080 $8,480 $7,980 $7,365 $6,590 $6,015 $5,567 $5,207 $8,480 $9,080 South 467,975 11,292 7,848 6,752 6,217 5,785 5,271 4,646 4,197 3,857 3,587 6,217 6,752 PRB 71,344 2,051 1,549 1,368 1,276 1,199 1,104 985 897 829 774 1,276 1,368 Permian 145,917 5,884 4,057 3,468 3,180 2,946 2,668 2,331 2,089 1,906 1,762 3,180 3,468 TMRC 16,371 516 346 294 269 249 226 198 178 163 152 269 294 Total PDP 1,230,085 $33,212 $24,042 $20,962 $19,421 $18,158 $16,635 $14,750 $13,376 $12,322 $11,481 $19,421 $20,962 Technical PUD North 607,743 $12,008 $7,839 $6,371 $5,628 $5,018 $4,284 $3,391 $2,762 $2,298 $1,944 $4,284 $5,018 South 406,336 8,806 4,641 3,484 2,958 2,555 2,102 1,596 1,267 1,038 871 2,102 2,555 PRB 437,466 9,575 3,865 2,448 1,860 1,443 1,019 616 401 277 200 1,019 1,443 Permian 476,130 14,406 7,465 5,433 4,498 3,780 2,981 2,108 1,563 1,201 949 2,981 3,780 Technical PUD Reserves 1,927,675 $44,796 $23,810 $17,736 $14,944 $12,795 $10,387 $7,712 $5,993 $4,813 $3,963 $10,387 $12,795 PROB North 343,976 $5,929 $3,119 $2,256 $1,853 $1,541 $1,193 $813 $577 $424 $319 $813 $1,193 South 582,826 10,354 4,396 2,980 2,392 1,969 1,527 1,076 806 630 508 1,076 1,527 PRB 231,160 4,664 2,346 1,680 1,377 1,147 893 620 451 340 263 620 893 Permian 124,011 3,366 1,594 1,113 902 744 574 394 284 212 162 394 574 PROB Reserves 1,281,974 $24,313 $11,454 $8,029 $6,524 $5,402 $4,187 $2,902 $2,119 $1,606 $1,252 $2,902 $4,187 POSS North 159,781 $2,713 $982 $557 $384 $264 $147 $47 $4 $-- $-- $4 $47 South 556,192 9,911 3,733 2,313 1,743 1,346 949 575 376 259 187 376 575 PRB 805,764 15,225 5,171 2,988 2,145 1,576 1,030 548 310 182 106 310 548 Permian 345,542 8,070 2,641 1,539 1,132 867 621 413 313 256 219 313 413 POSS Reserves 1,867,279 $35,918 $12,527 $7,397 $5,403 $4,052 $2,748 $1,583 $1,003 $697 $512 $1,003 $1,583 Total Reserves 6,307,012 $138,240 $71,833 $54,125 $46,293 $40,407 $33,956 $26,948 $22,491 $19,439 $17,208 $33,713 $39,528 Total E&P Asset-Level Value $138,240 $71,833 $54,125 $46,293 $40,407 $33,956 $26,948 $22,491 $19,439 $17,208 $33,713 $39,528 1 Less: Hedges (862) (843) Plus: Value of WaterCo 1,426 2,211 Plus: Invested Capital from Energy Innovations 100 100 2 Less: G&A (2,366) (1,935) 3 Less: Cash Taxes (5,905) (4,924) Less: Minerals Non-Controlling Interest⁴ (292) (254) Less: Asset Retirement Obligation (63) (77) Enterprise Value $25,750 $33,807 Less: Net Debt (5,778) Implied Equity Value $19,972 $28,028 / Fully Diluted Shares (millions) 363.0 Implied Equity Value per Share $55.02 $77.22 Source: Alpha NAV Model; FactSet market data as of 7/20/22 1. Assumes hedges held to expiration and discounted at 5-8% 2. G&A discount rates based on the weighted average discount rates of reserve categories by total reserves (14.2%-18.0%) 3. Cash tax discount rates based on the weighted average discount rates of reserve categories by PV-0 of cash flows (13.6%-17.3%) 4. TMRC consolidated in NAV; NCI represents FNV’s share of future value associated with TMRC cash flows 16
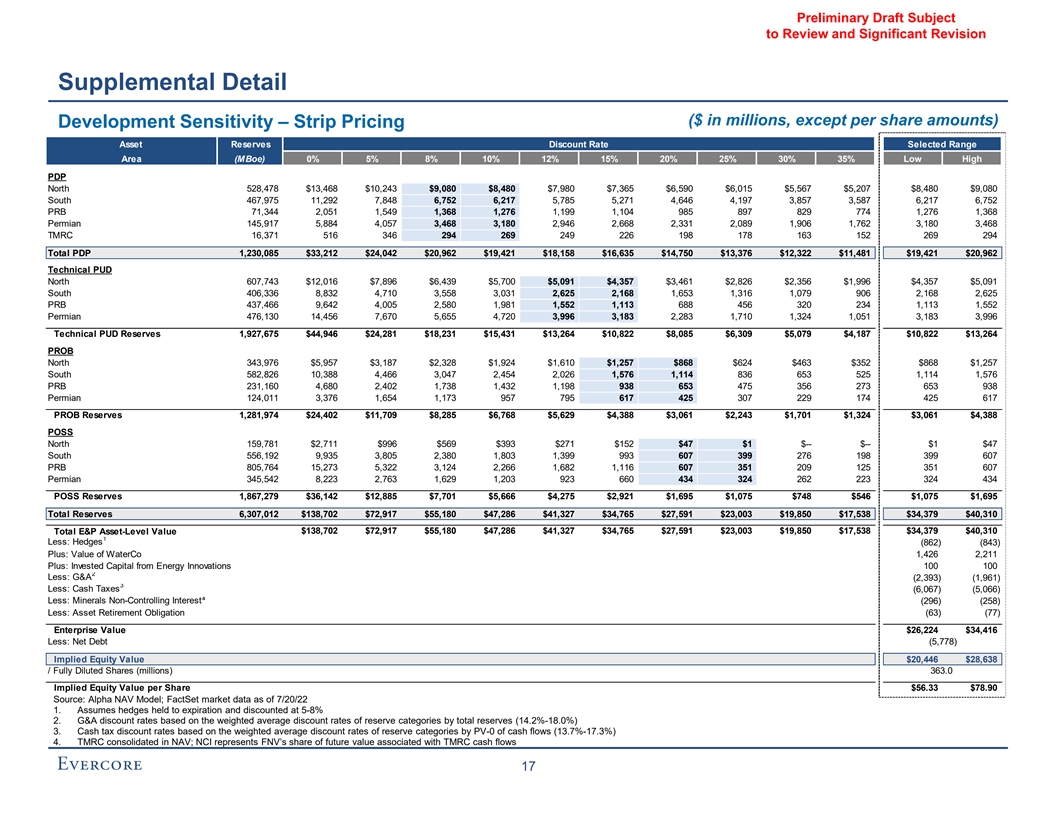
Preliminary Draft Subject to Review and Significant Revision Supplemental Detail ($ in millions, except per share amounts) Development Sensitivity – Strip Pricing Asset Reserves Discount Rate Selected Range Area (MBoe) 0% 5% 8% 10% 12% 15% 20% 25% 30% 35% Low High Discount Rates PDP North 528,478 $13,468 $10,243 $9,080 $8,480 $7,980 $7,365 $6,590 $6,015 $5,567 $5,207 $8,480 $9,080 South 467,975 11,292 7,848 6,752 6,217 5,785 5,271 4,646 4,197 3,857 3,587 6,217 6,752 PRB 71,344 2,051 1,549 1,368 1,276 1,199 1,104 985 897 829 774 1,276 1,368 Permian 145,917 5,884 4,057 3,468 3,180 2,946 2,668 2,331 2,089 1,906 1,762 3,180 3,468 TMRC 16,371 516 346 294 269 249 226 198 178 163 152 269 294 Total PDP 1,230,085 $33,212 $24,042 $20,962 $19,421 $18,158 $16,635 $14,750 $13,376 $12,322 $11,481 $19,421 $20,962 Technical PUD North 607,743 $12,016 $7,896 $6,439 $5,700 $5,091 $4,357 $3,461 $2,826 $2,356 $1,996 $4,357 $5,091 South 406,336 8,832 4,710 3,558 3,031 2,625 2,168 1,653 1,316 1,079 906 2,168 2,625 PRB 437,466 9,642 4,005 2,580 1,981 1,552 1,113 688 456 320 234 1,113 1,552 Permian 476,130 14,456 7,670 5,655 4,720 3,996 3,183 2,283 1,710 1,324 1,051 3,183 3,996 Technical PUD Reserves 1,927,675 $44,946 $24,281 $18,231 $15,431 $13,264 $10,822 $8,085 $6,309 $5,079 $4,187 $10,822 $13,264 PROB North 343,976 $5,957 $3,187 $2,328 $1,924 $1,610 $1,257 $868 $624 $463 $352 $868 $1,257 South 582,826 10,388 4,466 3,047 2,454 2,026 1,576 1,114 836 653 525 1,114 1,576 PRB 231,160 4,680 2,402 1,738 1,432 1,198 938 653 475 356 273 653 938 Permian 124,011 3,376 1,654 1,173 957 795 617 425 307 229 174 425 617 PROB Reserves 1,281,974 $24,402 $11,709 $8,285 $6,768 $5,629 $4,388 $3,061 $2,243 $1,701 $1,324 $3,061 $4,388 POSS North 159,781 $2,711 $996 $569 $393 $271 $152 $47 $1 $-- $-- $1 $47 South 556,192 9,935 3,805 2,380 1,803 1,399 993 607 399 276 198 399 607 PRB 805,764 15,273 5,322 3,124 2,266 1,682 1,116 607 351 209 125 351 607 Permian 345,542 8,223 2,763 1,629 1,203 923 660 434 324 262 223 324 434 POSS Reserves 1,867,279 $36,142 $12,885 $7,701 $5,666 $4,275 $2,921 $1,695 $1,075 $748 $546 $1,075 $1,695 Total Reserves 6,307,012 $138,702 $72,917 $55,180 $47,286 $41,327 $34,765 $27,591 $23,003 $19,850 $17,538 $34,379 $40,310 Total E&P Asset-Level Value $138,702 $72,917 $55,180 $47,286 $41,327 $34,765 $27,591 $23,003 $19,850 $17,538 $34,379 $40,310 1 Less: Hedges (862) (843) Plus: Value of WaterCo 1,426 2,211 Plus: Invested Capital from Energy Innovations 100 100 2 Less: G&A (2,393) (1,961) 3 Less: Cash Taxes (6,067) (5,066) Less: Minerals Non-Controlling Interest⁴ (296) (258) Less: Asset Retirement Obligation (63) (77) Enterprise Value $26,224 $34,416 Less: Net Debt (5,778) Implied Equity Value $20,446 $28,638 / Fully Diluted Shares (millions) 363.0 Implied Equity Value per Share $56.33 $78.90 Source: Alpha NAV Model; FactSet market data as of 7/20/22 1. Assumes hedges held to expiration and discounted at 5-8% 2. G&A discount rates based on the weighted average discount rates of reserve categories by total reserves (14.2%-18.0%) 3. Cash tax discount rates based on the weighted average discount rates of reserve categories by PV-0 of cash flows (13.7%-17.3%) 4. TMRC consolidated in NAV; NCI represents FNV’s share of future value associated with TMRC cash flows 17