| 1900 Crystal Drive零售(渲染) 投資者演示文稿 2022年11月 |

| 披露 向前 - 展望STATEMENTS Certain statements contained herein may constitute “forward - looking statements” as such term is defined in Section 27 A of the Securities Act of 1933 , 經 修訂, and Section 21 E of the Securities Exchange Act of 1934 , as amended . Forward - looking statements are not guarantees of performance . They represent our intentions, 計劃, expectations and beliefs and are subject to numerous assumptions, risks and uncertainties . Consequently, the future results of JBG SMITH Properties (“JBG SMITH”, The “公司”, “我們”, “我們”, “our” or similar terms) may differ materially from those expressed in these forward - looking statements . You can find many of these statements by looking for words such as “approximate”, “假設”, “潛在”, “相信”, “預期”, “預期”, “估計”, “打算”, “計劃”, “將”, “may” or similar expressions in this Investor Presentation . Investors are cautioned to interpret many of the risks identified under the section titled “Risk Factors” in our Annual Report on Form 10 - K for the fiscal year ended December 31 , 2021 as being heightened as a result of the ongoing and numerous adverse impacts of the COVID - 19 pandemic . We also note the following may impact our forward - looking statements : the risks associated with the failure to enter into and/or complete contemplated acquisitions or dispositions within the price ranges anticipated and on the terms and timing anticipated, 或 位於 全部 ; the impact of COVID - 19 and the ensuing economic turmoil on our Company, 淨營業收入 淨 same store net operating income, 淨資產 價值, 股票 價格, 入住率 , revenue from our multifamily and commercial portfolios, 運營成本, 延期 租金, uncollectible operating lease receivables, 停車 收入, and burn - off of rent abatement ; whether the recent decline in demand for office space will continue or accelerate and the impact of such decline on our ability to renew or lease - up expiring office space ; whether the assumed capitalization rates for components of our portfolio are accurate ; whether our National Landing office portfolio is significantly undervalued to the extent that our assumptions suggest or at all ; whether we would be successful in securing the proceeds of our estimated potential multifamily borrowing capacity on attractive terms or at all ; the impact of disruptions to the credit and capital markets on our ability to access capital, including refinancing maturing debt ; changes to the amount and manner in which tenants use space ; whether we incur additional costs or make additional concessions or offer other incentives to existing or prospective tenants to reconfigure space ; 是否 華盛頓 DC region will be more resilient than other parts of the country in any recession and whether DC metro asking rents will be more resilient than those in other gateway markets ; our annual dividend per share and dividend yield ; annualized net operating income ; whether in the case of our multifamily portfolio, our anticipated incremental annualized net operating income will be realized ; whether our future capital recycling efforts will be successful and will be at or above NAV ; whether in the case of our under - construction assets, 預估 平方英尺, estimated number of units and in the case of our near - term and future development assets, estimated potential development density are accurate ; the amount and timing of planned infrastructure and educational improvements in National Landing related to Amazon . com, Inc . ’s (“Amazon”) additional headquarters and the Virginia Tech Innovation Campus ; 經濟影響 job growth and related demand for multifamily and commercial properties of Amazon’s additional headquarters on the DC region and National Landing and the speed with which such impact occurs{Br}and Amazon’s plans for accelerated hiring and in - person work requirements ; the impact of our role as the exclusive developer, property manager and retail leasing agent in connection with Amazon’s new headquarters ; our development plans related to Amazon’s additional headquarters ; whether National Landing will benefit economically from its proximity to the Department of Defense and elevated defense spending ; whether our plans related to our investment in 5 G wireless spectrum across National Landing will be a significant demand catalyst ; whether the required 5 G sites will be delivered on the anticipated timeline or at all ; whether our target markets continue to be fast - growing ; whether future supply or construction delays will inhibit our ability to time new multifamily deliveries to meet market demand ; whether the number of retailers and multifamily units in National Landing will increase on the anticipated timelines ; whether the entitlement process for our Development Pipeline will be completed at all and on the expected timeline ; whether anticipated near - term net operating income contributions, anticipated resiliency of the DC area and our contemplated shift to multifamily will be realized and, 如果 實現, will have a positive impact on our share price ; in the case of our Under Construction and Near - Term Development Pipeline, 預計 完成日期 , 穩定 日期, 估計的 增量投資, 成本的收益率 , 總投資, 預計的 噪聲, 目標的 噪聲 收益率, estimated stabilized value and estimated value creation ; whether we will shift to majority multifamily on the timing anticipated or at all ; whether we can access agency debt secured by our currently unencumbered multifamily assets in a timely manner, 在 中,我們 估計的 金額, on reasonable terms or at all ; whether our estimated borrowing capacity is accurate ; whether our newly delivered assets and the assets in our Development Pipeline will generate the stabilized annualized NOI anticipated ; whether our newly delivered assets will stabilize on the timing anticipated and deliver the expected annualized NOI ; whether we will succeed in our contemplated recycling of disposition proceeds into acquisitions yielding the anticipated stabilized capitalization rates ; and whether the allocation of capital to our share repurchase plan has any impact on our share price . Many of the factors that will determine the outcome of these and our other forward - looking statements are beyond our ability to control or predict . These factors include, among others : adverse economic conditions in the Washington, DC 大都市區, including in relation to COVID - 19 , the timing of and costs associated with development and property improvements, 融資 承諾, and general competitive factors . For further discussion of factors that could materially affect the outcome of our forward - looking statements and other risks and uncertainties, 參見 “風險因素 ,” “Management’s Discussion and Analysis of Financial Condition and Results of Operations” and the Cautionary Statement Concerning Forward - Looking Statements in the Company’s Annual Report on Form 10 - K for the year ended December 31 , 2021 and other periodic reports the Company files with the Securities and Exchange Commission . For these statements, we claim the protection of the safe harbor for forward - looking statements contained in the Private Securities Litigation Reform Act of 1995 . You are cautioned not to place undue reliance on our forward - looking statements . All subsequent written and oral forward - looking statements attributable to us or any person acting on our behalf are expressly qualified in their entirety by the cautionary statements contained or referred to in this section . We do not undertake any obligation to release publicly any revisions to our forward - looking statements to reflect events or circumstances occurring after the date hereof . 2 |

| 按比例披露 INFORMATION We present certain financial information and metrics in this release “at JBG SMITH Share,“ which refers to our ownership percentage of consolidated and unconsolidated assets in real estate ventures (collectively, “real estate ventures”) as applied to these financial measures and metrics . Financial information “at JBG SMITH Share” is calculated on an asset - by - asset basis by applying our percentage economic interest to each applicable line item of that asset‘s financial information . “At JBG SMITH Share” information, which we also refer to as being “at share,” “our pro rata share” or “our share,” 不是 , 和 是 不是 預期的 , a presentation in accordance with GAAP . Given that a substantial portion of our assets are held through real estate ventures, we believe this form of presentation, which presents our economic interests in the partially owned entities, provides investors valuable information regarding a significant component of our portfolio, 其 成分, performance and capitalization . We do not control the unconsolidated real estate ventures and do not have a legal claim to our co - venturers‘ share of assets, 負債, revenue and expenses . The operating agreements of the unconsolidated real estate ventures generally allow each co - venturer to receive cash distributions to the extent there is available cash from operations . The amount of cash each investor receives is based upon specific provisions of each operating agreement and varies depending on certain factors including the amount of capital contributed by each investor and whether any investors are entitled to preferential distributions . With respect to any such third - party arrangement, we would not be in a position to exercise sole decision - making authority regarding the property, real estate venture or other entity, 和 可能在 某些 情況下, be exposed to economic risks not present were a third - party not involved . We and our respective co - venturers may each have the right to trigger A buy - sell or forced sale arrangement, which could cause us to sell our interest, or acquire our co - venturers‘ interests, or to sell the underlying asset, either on unfavorable terms or at a time when we otherwise would not have initiated such a transaction . Our real estate ventures may be subject to debt, and the repayment or refinancing of such debt may require equity capital calls . To the extent our co - venturers do not meet their obligations to us or our real estate ventures or they act inconsistent with the interests of the real estate venture, we may be adversely affected . Because of these limitations, the non - GAAP “at JBG SMITH Share” financial information should not be considered in isolation or as a substitute for our financial statements as reported under GAAP . Occupancy, non - GAAP financial measures, 利用 指標, 運營 資產, and operating metrics presented in our investor presentation exclude our 10 . 0 % subordinated interest in one commercial building and our 33 . 5 % subordinated interest in four commercial buildings, as well as the associated non - recourse mortgages payable, held through unconsolidated real estate ventures, as our investment in each real estate venture is zero, we do not anticipate receiving any near - term cash flow distributions from the real estate ventures and we have not guaranteed their obligations or otherwise committed to providing 金融 支持 。 市場DATA Market data and industry forecasts are used in this Investor Presentation, including data obtained from publicly available sources . These sources generally state that the information they provide has been obtained from sources believed to be reliable, but the accuracy and completeness of the information is not assured . We have not independently verified any such information . 3 |
| DISCLOSURES AMAZON In November 2018 , Amazon announced it had selected sites in National Landing as the location of its new headquarters . We currently have leases with Amazon totaling 1 . 0 million square Feet at six office buildings in National Landing . We have sold to Amazon two of our National Landing development sites, Metropolitan Park and Pen Place . We are currently constructing two new office buildings for Amazon on Metropolitan Park, totaling 2 . 1 million square feet, 含 超過 50 , 000 square feet of street - level retail with new shops and restaurants . We are the developer, property manager and retail leasing agent for Amazon‘s new headquarters at National Landing . In connection with Amazon’s new headquarters in National Landing, the Commonwealth of Virginia enacted an incentives bill, which provides tax incentives to Amazon to create a minimum of 25 , 000 new full - time jobs and potentially 37 , 850 full - time jobs in National Landing with average annual wage targets for each calendar year, 2019年從 $ 150 , 000 開始 , and escalating 1 . 5 % per year . JBG SMITH, 與 亞馬遜、 弗吉尼亞理工、 和 聯邦、 state and local governments plan to invest more than $ 12 billion,並駕齊驅 including infrastructure investments, that will directly benefit National Landing . This includes approximately $ 6 billion of infrastructure investments planned by state and local governments, 其中 已完全 提交, including : lowering of elevated sections of U . S . Route 1 that currently divide parts of National Landing to create better multimodal access and walkability ; two new Metro entrances (Crystal Drive and Potomac Yard) ; a pedestrian bridge to Reagan National Airport ; a new commuter rail station located between two of our Crystal Drive office assets ; 和 長 橋, the planned two - track rail connection between Washington, DC and National Landing . We include certain statistics in the following slides as outlined in the Memorandum of Understanding (MOU) between Amazon and the Commonwealth of Virginia, 已於 年11月12日執行 ,2018年執行 , and that identify the proximity of our portfolio to National Landing : specifically, 96 % 我們的 投資組合,不包括 非 - 核心 資產, is within a 20 - minute commute of National Landing, as calculated on a pre - COVID - 19 Monday morning . VIRGINIA技術 在 2020年秋季 , Virginia Tech virtually launched the inaugural academic year of its currently under construction $ 1 billion Innovation Campus in National Landing . This expected powerful demand driver sits adjacent to 2 . 0 million square feet of development density we own in National Landing and a new, under - construction Potomac Yard Metro station, all approximately one mile south of Amazon‘s new headquarters . The campus is part of a 20 - acre innovation district, of which the fully entitled first phase encompasses approximately 1 . 7 million square feet of space, including four office towers and two residential buildings, with ground - level retail . On this campus, Virginia Tech intends to create an innovation ecosystem by co - locating academic and private sector uses to accelerate research and development spending, as well as the commercialization of technology . When the Innovation Campus is fully operational, Virginia Tech plans to annually graduate approximately 750 master students and 150 PhD students in STEM fields . Virginia Tech, which is expected to occupy 675 , 000 square feet in the Innovation Campus, is also attracting funding from STEM employers (technology, 國防 和 航空航天), including over $ 65 million publicly announced to date from Amazon, Boeing and Northrop Grumman . DEFINITIONS和RECONCILIATIONS For certain definitions and reconciliations see pages 20 - 26 . 4 |
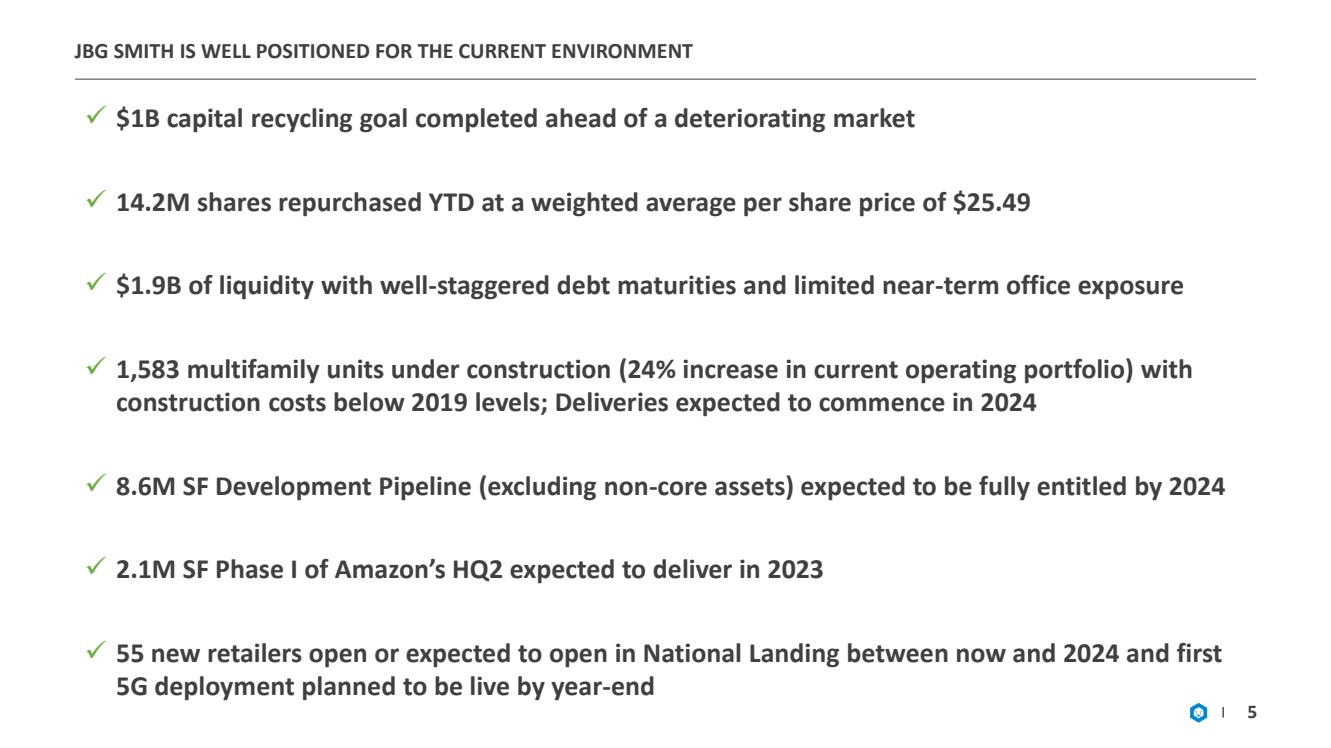
| JBG Smith在當前環境中處於有利地位 5 ✓ 在市場惡化之前完成了10億美元的資本回收目標 ✓ 1420萬股以加權平均每股25.49美元的價格在年初回購了19億美元的流動性, - 錯開的債務到期日和有限的 - 定期寫字樓風險敞口 ✓ 1,583個在建多户單位(當前運營組合增加24%),建設成本低於2019年水平;預計將於2024年開始交付 ✓ 860萬SF開發管道(不包括非 - 核心資產)預計到2024年將獲得完全授權 ✓ 亞馬遜HQ2的210萬SF第一階段預計將於2023年交付 ✓ 從現在到2024年在National Landing開設或預計開設55家新零售商,以及計劃在一年前投入使用的第一個5G部署 - 結束 |
| 我們的核心業務在過去12個月中繼續表現出色 (1)基於我們的National Landing產品組合。 (2)基於根據建築物入住率調整後的Kastle數據。我們認為,入住率高峯期通常出現在週二、週三和週四,是衡量辦公空間實際利用率的最佳晴雨表之一。65% 代表10月前幾周的最高平均星期二 - 星期四。 6 ✓ 執行了207K SF辦公室租賃;超過50%包括National Landing的新租賃 ▪ 兩個新的36K+SF國防和技術租賃(聯合無線和HII);11年以上的租期 ▪ 續訂的租户保留了約90%的空間 (1) ✓ 與聯合無線合作,在全國落地提供5G專用無線 ▪ 聯合無線計劃將其總部遷至國家落地,並在我們的一棟建築中佔用36K SF空間 ✓ 我們的運營組合增加了相同商店的NOI 11.5%,多家庭入住率同比增長140bps▪ 多家庭入住率上升140bps至93.7%;續訂後租金上漲6.7%,同時實現了57%的續約率 ▪ 10月份我們的National Landing商業投資組合的每日實物入住率平均超過65% ,是1月份低點的兩倍多 (2) ✓ 收購了我們的合作伙伴在三個多家庭資產中的權益,總計1.8億美元 ▪ 第三季度和最近的亮點穩定在4.5%至5%的加權平均資本化率 |

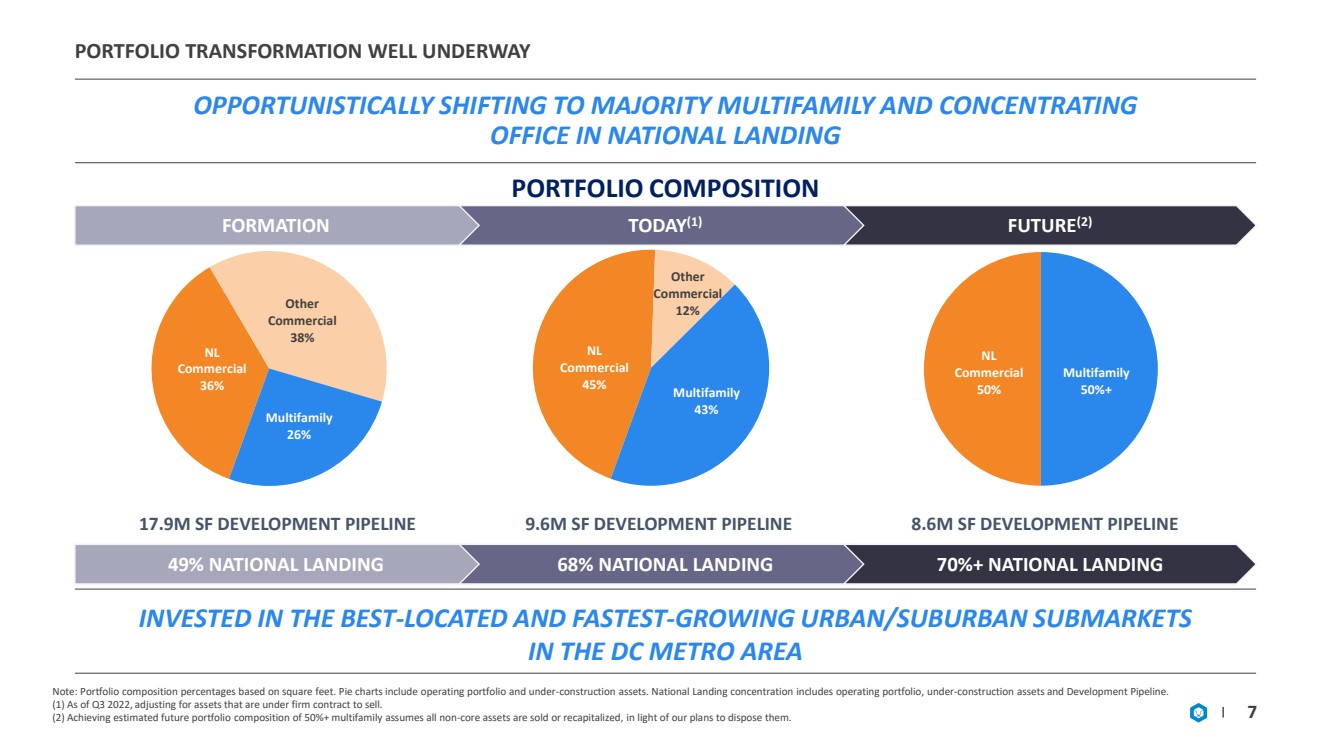
| 投資組合轉型正在順利進行中 機會主義地轉向多數家庭和集中地 亭 辦事處在全國落地 7 投資組合COMPOSITION FORMATION TODAY (1) FUTURE (2) INVESTED位於DC大都市區內位置最好、增長最快的 - 城市/郊區郊區市場 注意:投資組合構成百分比以平方英尺為單位。餅圖包括運營資產組合和在建資產。國家落地集中度包括運營資產組合,在 - 建設資產和開發管道下。 (1)截至2022年第三季度,根據簽訂了固定合同要出售的資產進行調整。 (2)實現估計的未來投資組合構成50%+多家族假設所有非 - 核心資產均已出售或資本重組, 鑑於我們計劃處置them. NL Commercial 36% Other Commercial 38% Multifamily 26% NL Commercial 45% Other Commercial 12% Multifamily 43% NL Commercial 50% Multifamily 50% + 49%全國着陸點 68%國家落地 70%+國家落地 17.9m SF開發管線 9.6m SF開發管線 8.6米SF開發管線 |
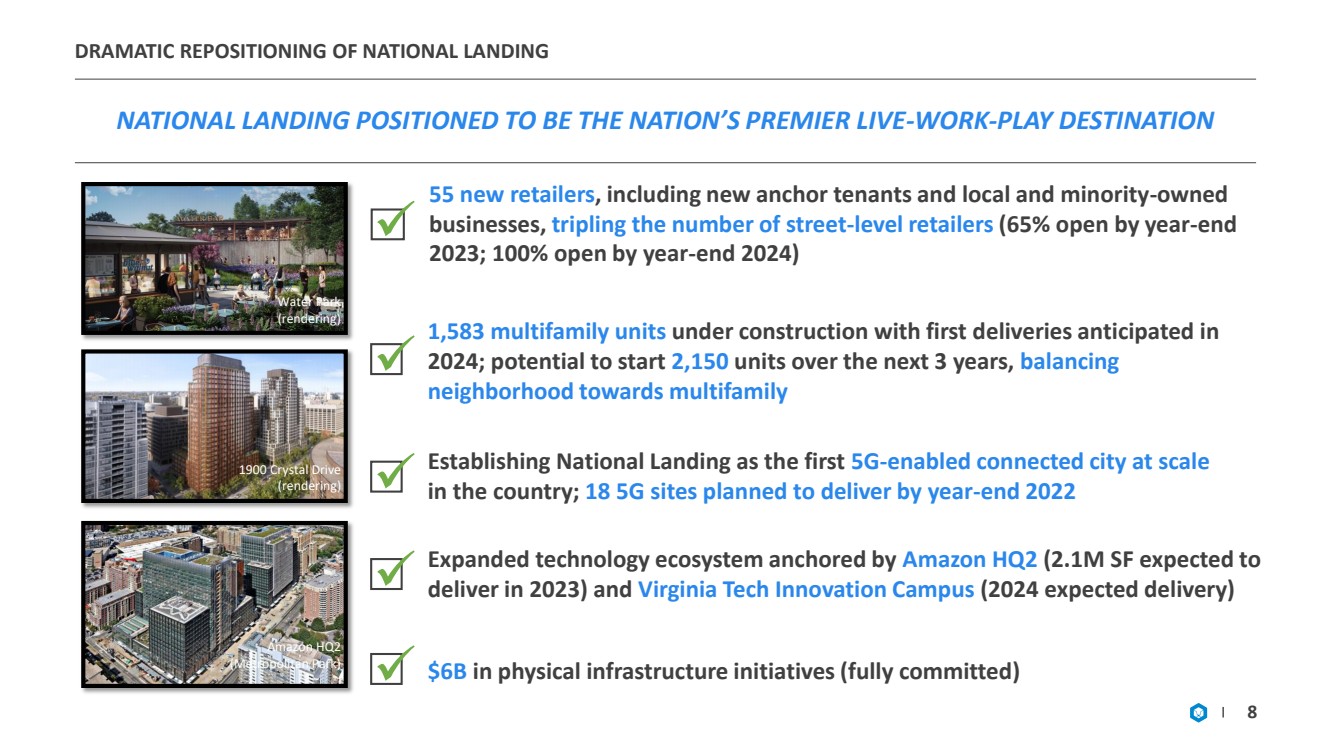
| 國家落地的戲劇性重新定位 國家落地定位為全國首屈一指的現場 - 作品 - 遊玩目的地 8 1,583個多户住宅單元正在建設中 預計將於2024年首次交付; 未來3年可能開始 2,150 個單位, 平衡 社區和多家庭 ✓ 55 新零售商 ,包括新的主要租户和當地和少數族裔擁有的 企業, 街道 - 級別零售商的數量增加兩倍 (到2023年開業65%) - 年底 ;到2024年底100%開通) ✓ 將全國落地打造為全國首個5G - 規模的互聯城市; 計劃到2022年底交付18個5G站點 ✓ ✓ $6B 物理基礎設施計劃(完全投入) ✓ 以亞馬遜HQ2 (預計在2023年交付210萬SF)和 弗吉尼亞理工創新園區 (預計2024年交付)為基礎的擴展技術生態系統 亞馬遜HQ2 (大都會公園) 水上公園 (渲染) 1900水晶硬盤 (渲染) 亞馬遜HQ2 (大都會公園) |
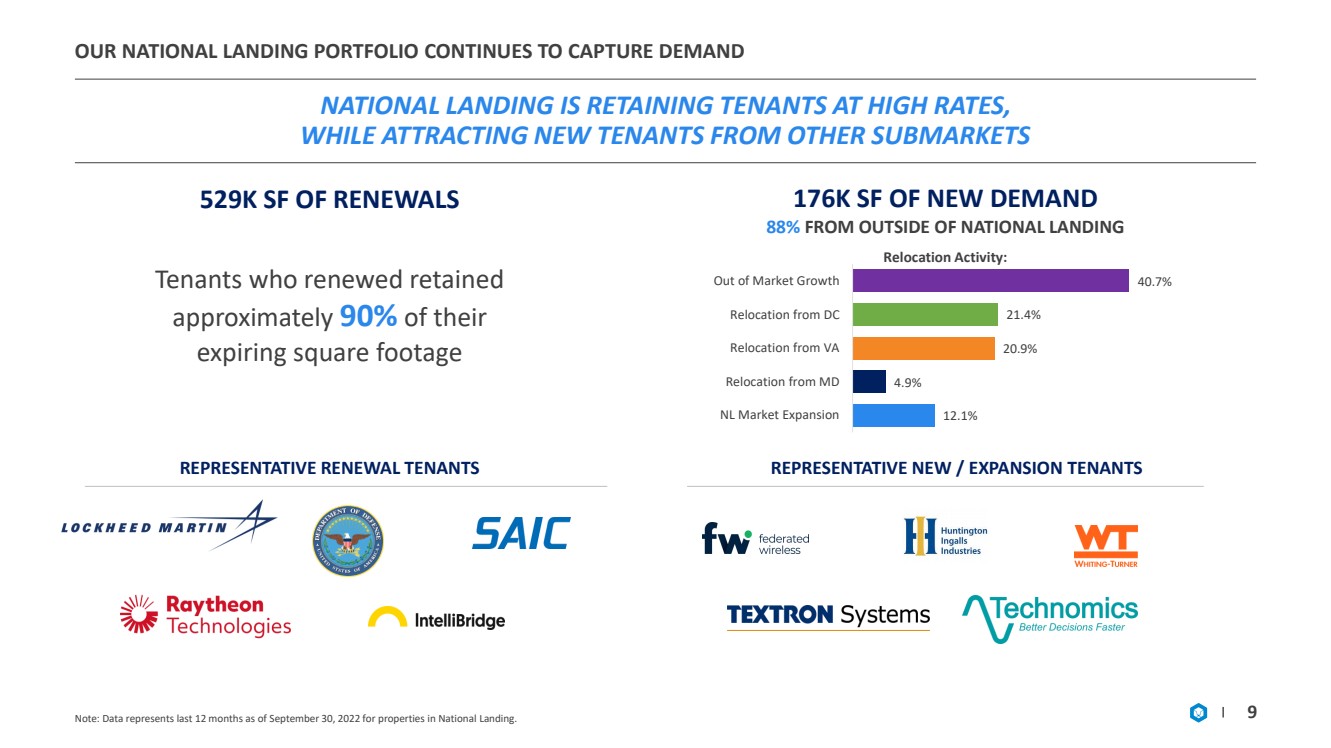
| 176K SF的新需求 88% 來自國家落地之外的新需求 我們的國家落地組合繼續捕獲需求 國家落地以高利率留住租户,同時吸引來自其他子市場的新租户 注意:數據代表截至9月30日的過去12個月,2022年用於國家落地物業。 9 529K SF續訂 有代表性的續訂租户 有代表性的新租户/擴展租户 續訂的租户保留了大約 90% 即將到期的廣場footage 12.1% 4.9% 20.9% 21.4% 40.7% NL市場擴展 從MD搬遷 從VA搬遷 從DC搬遷 非市場增長 搬遷活動: |
| 新的需求概況:國防和技術增長 我們認為租户在DC地區選擇國家登陸而不是其他標誌 是因為其獨特的價值主張 10 總RSF: ~37K 租期: 11.5年 搬遷自: DC Ballpark海軍船廠和國家登陸非 - JBGS擁有 搬遷到: 2451 Crystal Drive 為什麼選擇國家登陸? 五角大樓和HII的擴展客户遍佈美國國防部,並幫助HII 擴大其在全國國會大廈地區的整體存在。 · 通過高度可見的外部標牌,提供具有主要品牌機會的特定房地產解決方案,展示面向客户的空間和華盛頓特區的廣闊視野。在HII構建和交付成長型市場中的所有 - 域防禦 技術解決方案時,可以訪問JBGS的數字基礎設施,如無人系統和自主、大數據、 AI/ML、網絡和LVC解決方案。 HII是美國最大的軍事造船公司,在財富500強中排名第371位。他們剛剛推出了世界上最大的航空母艦。 總RSF: ~ 36K 租期: 11.7年 搬遷: 羅斯林 - 巴爾斯頓走廊(弗吉尼亞州北部)25K SF 搬遷並擴建到: 2121 Crystal Drive 為什麼選擇National Landing? JBGS與聯合航空合作,為創新租户提供專用5G網絡 - 便利設施對於JBGS和聯合的強大展示。 · 被National Landing的數字基礎設施融合網絡所吸引,這在全國是獨一無二的。 · 靠近公共部門的決策者 - 非常重要。 · 通過弗吉尼亞理工創新園區團隊連接到JBGS, 其中創始人 擁有深厚的人脈。 國防技術 企業技術 聯合是一家高增長的私人無線網絡公司,已籌集超過2億美元,並正在為政府和私營部門部署專用網絡。 |

| $6.4 $6.6 $6.9 $8.0 $10.6 $12.7 $21.5 $22.6 $27.4 $74.2 L3Harris BAE系統公司 Humana 亨廷頓英格斯公司 安瑟 諾斯羅普·格魯曼公司 波音公司 通用動力公司 雷神公司 洛克希德·馬丁公司 全球國防開支增長和對技術的關注是國家國防開支增長和技術關注的強大利好因素登陸 資料來源:美聯儲/經濟局,北約,華爾街日報,納斯達克,德國世界報,彭博政府,美國環保署 國防部,美國政府問責局,突破國防, 國會研究辦公室,聯邦時報,突破國防,德爾泰克,AEI,注:國防開支顯示國防部預算申請 對比 2022年綜合撥款法案國防部(051行)。 11 雖然北約國家自2015年以來增加了國防開支,但 平均支出僅佔國內生產總值的1.6% ,儘管這種情況正在改變。 美國和北約國家登陸的存在 增加了美國和北約的國防 預算 惠及國家登陸國內生產總值(tenants . COUNTRY 2021 DEFENSE (%) 2022年更新 美國 3.9% 參議院撥款 委員會建議 $850B 2023年預算 德國 1.5% 承諾2022年為2% 英國 2.3% 建議by Parliament France 2.0% Increase增加25%待定,但總裁·馬克龍 意大利 1.4% 首相德拉吉 西班牙 1.0% 承諾在北約六大經濟體中增加2%但不清楚的國防開支 德國最近 承諾將100億歐元用於國防現代化建設,並在 3月, 訂購了35輛 洛克希德F - 35架,價值4B歐元。 波蘭承諾將國防開支提高到GDP的3%,並將用價值60億美元的美國通用動力學模型 取代其俄羅斯坦克。 五角大樓每年在技術研究和實施上花費 70B美元。 國會批准的2022財年國防部預算申請 $743B+ 科學和技術方面的支出為147億美元 用於密碼技術現代化的支出為9.81億美元 用於人工智能的支出為8.74億美元 用於5G通信的支出為3.98億美元 五角大樓的年度IT支出為55億美元 最近對五角大樓IT預算的分析確定了5G、物聯網和人工智能 作為預算 優先事項的驅動因素。 最新的聯合雲競標池沒有傳統的 國防承包商: 用於網絡安全的56億美元 包括… 美國和海外國防開支的歷史性增長使National Landing能夠滿足不斷增長的國防需求,尤其是隨着技術和國防的日益緊密 。 2020財年合同 義務(B美元) 包括... |

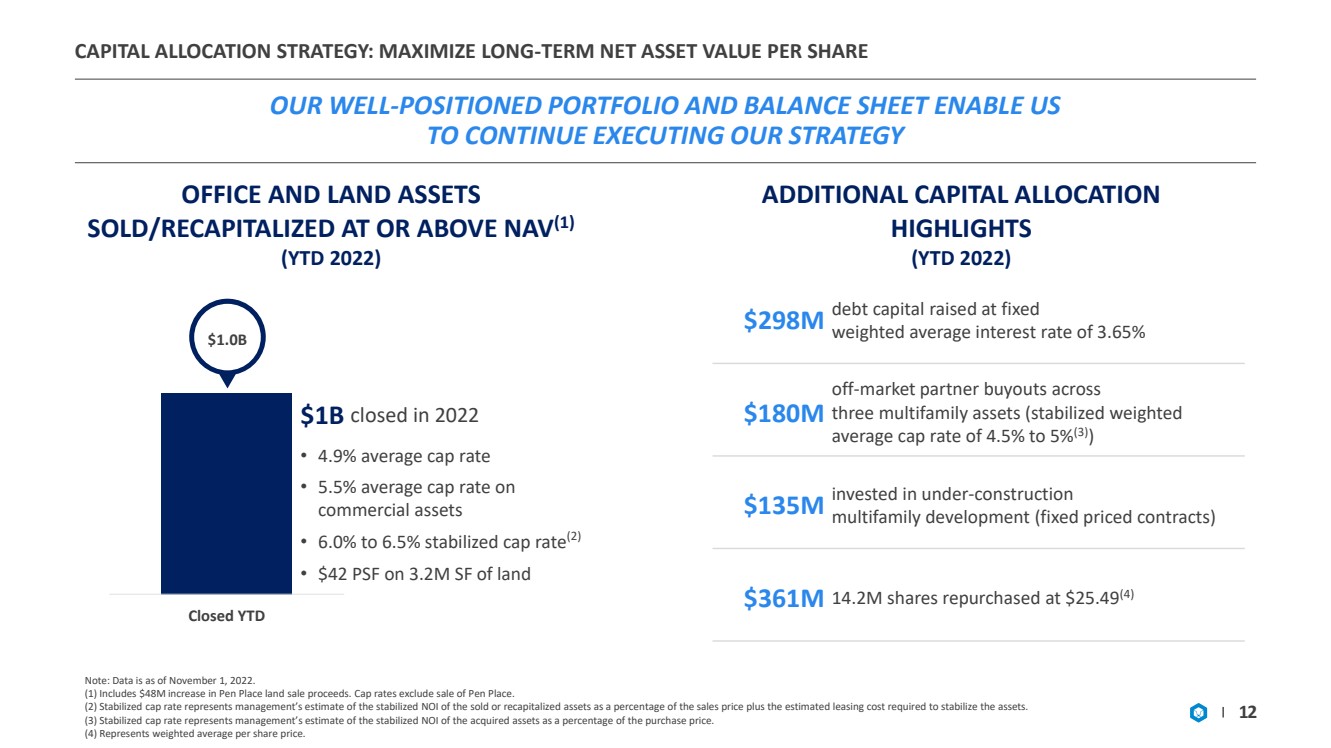
| 資本配置策略:最大化長期 - 每股資產淨值 我們定位良好的投資組合和資產負債表使美國 能夠繼續執行我們的戰略 12 $2.98億 債務資本以固定的 加權平均利率3.65% $1.8億 的加權平均利率籌集 - 市場合作夥伴收購三個多家族資產(穩定的加權 平均上限利率為4.5%至5% Br}(3) ) 投資1.35億美元 在建項目 多户開發(固定價格合同) 3.61億美元 1420萬股以25.49美元回購 (4) 辦公樓和土地資產 按資產淨值或以上出售/資本重組 (1) (YTD 2022) 注:數據截至11月1日,2022年。 (1)包括Pen Place土地銷售收益增加4800萬美元。上限利率不包括出售Pen Place。 (2)穩定上限利率表示管理層對已出售或資本重組資產的穩定NOI的估計,即銷售價格加上穩定資產所需的估計租賃成本的百分比。 (3)穩定上限利率表示管理層對收購資產的穩定NOI的估計佔追逐價格的百分比。 (4)代表加權平均每股價格。 收盤價 $10B{Br}$1B 2022年結束 · 4.9%平均上限税率 · 5.5%商業資產的平均上限税率 · 6.0%至6.5%穩定上限税率 (2) · 320萬SF土地上的$42 PSF 額外的資本分配 亮點 (YTD 2022) |
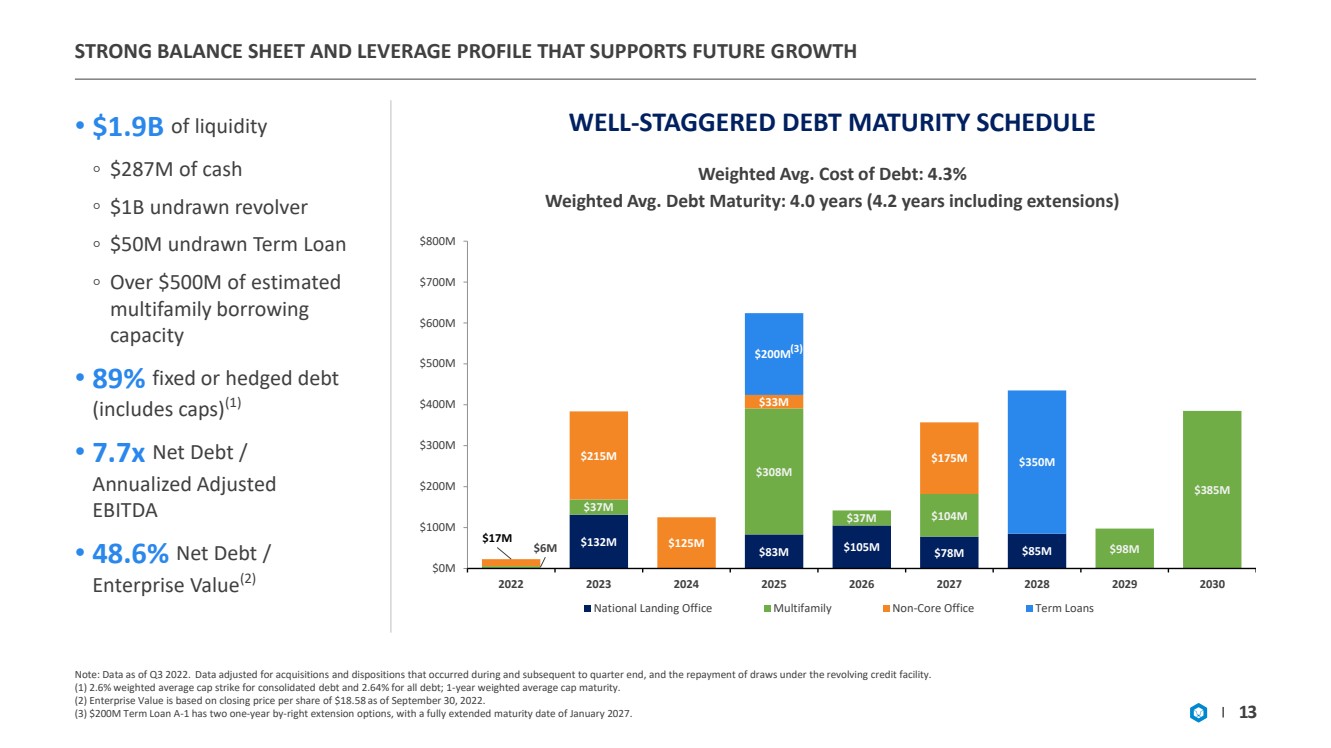
| 強勁的資產負債表和槓桿狀況,支持未來的G 增長 注意:截至2022年第三季度的數據。經季度末及之後發生的收購和處置調整的數據,循環信貸安排項下提款的償還。 (1)合併債務的加權平均上限執行率為2.6%,所有債務的加權平均上限執行率為2.64%;1 - 年加權平均上限到期日。 (2)企業價值基於截至2022年9月30日的每股收盤價18.58美元。 (3)2億美元定期貸款A - 1有兩個 - 年至 - 權利延期選項,到期日期完全延長至2027年1月。 13 · $1.9億 流動資金 ◦ $2.87億美元現金 ◦ $1B未提取左輪手槍 ◦ $5000萬美元未提取定期貸款 ◦ 超過5億美元的估計多户借款 能力 · 89% 固定或對衝債務 (包括上限) (1) · 7.7xBr}淨債務/ 年化調整後EBITDA · 48.6% 淨債務/ 企業價值 (2) 好 - 交錯債務到期表 加權平均。債務成本:4.3% 加權平均。債務期限:4年(含extensions) $132M $83M $105M $78M $85M $6M $37M $308M $37M $104M $98M $385M $17M $215M $125M $33M $175M $200M $350M $0M $100M $200M $300M $400M $500M $600M{為4.2年Br}$700M $800M 2022 2023 2024 2025 2026 2027 2028 2029 2030 National落地辦公室 多户 非核心辦公室 定期貸款 (3) |
| 關鍵的ESG里程碑和計劃 14 ✓ 於2021年9月在我們的運營組合中實現了能源消耗的碳中和 ▪ 這有什麼重要的? 解決利益相關者羣體的最優先利益,並使JBG符合低碳經濟 ✓ 與整個組織的主要業務領導人組成了一個ESG委員會 ▪ 為什麼這很重要? 進一步將ESG的考慮納入財務決策 - 制定和董事會諮詢 ✓ 推進ESG確保做好準備準備美國證券交易委員會關於climate - related disclosures ▪ Why的擬議規則這很重要? 使JBGS平穩過渡到新的氣候報告標準, 網絡安全和人力資本 ✓ 制定淨零戰略 ▪ 這有什麼重要的? 解決利益相關者羣體的最優先利益,使JBGS能夠保護資產價值和減少氣候相關風險 ✓ JBGS - 管理影響池迄今通過華盛頓住房計劃資助了1,750個負擔得起的勞動力單元 住房計劃 ▪ 為什麼重要? 通過保護經濟適用房促進包容性增長和經濟流動性 |

| 附錄 |

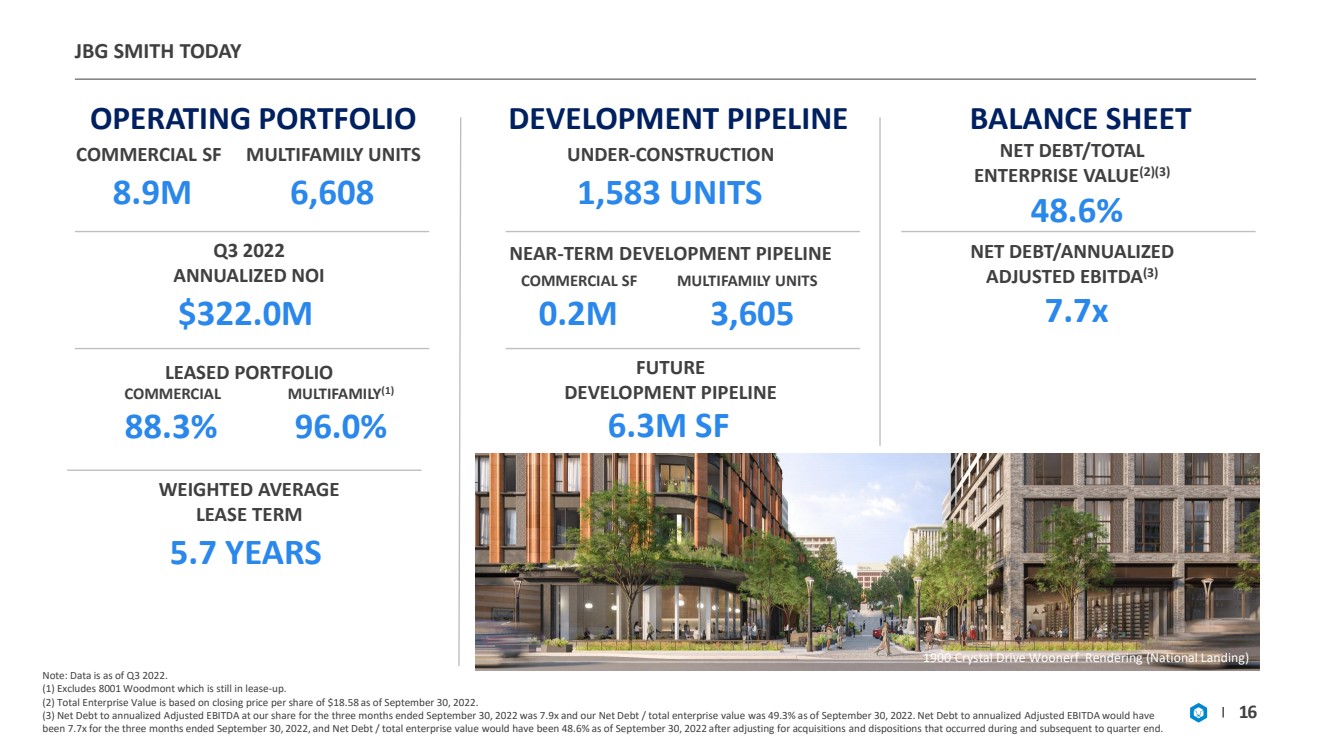
| JBG Smith Today 注:數據是截至2022年第三季度。 (1)不包括仍在租賃中的8001 Woodmont - 。 (2)企業總價值基於截至2022年9月30日的每股收盤價18.58美元。 (3)截至2022年9月30日的三個月,我們股票的淨債務與年化調整後EBITDA之比為7.9倍,截至2022年9月30日的淨企業價值為49.3%。截至2022年9月30日的三個月,淨債務與年化調整後EBITDA之比為7.7倍,截至9月30日,淨債務/企業總價值為48.6%。經季度末及之後發生的收購和處置進行調整後的2022年。 16 運營組合 商業SF 多家庭單元 890萬 6,608 2022季度年化NOI $322.0M 租賃組合 開發PIPELINE UNDER - CONSTRUCTION 1,583單元 接近 - 長期開發管道 0.2M 未來 開發管道 630萬SF 3,605 商業SF 多個家庭單位 資產負債表 淨債務/總 企業價值 (2)(3) 48.6% 1900 Crystal Drive Woonerf渲染(全國登陸) 96.0% 加權平均 租賃期 5.7年 淨債務/年化調整後EBITDA (3) 7.7x COMMERCIAL MULTIFAMILY{Br}(1) 88.3% |
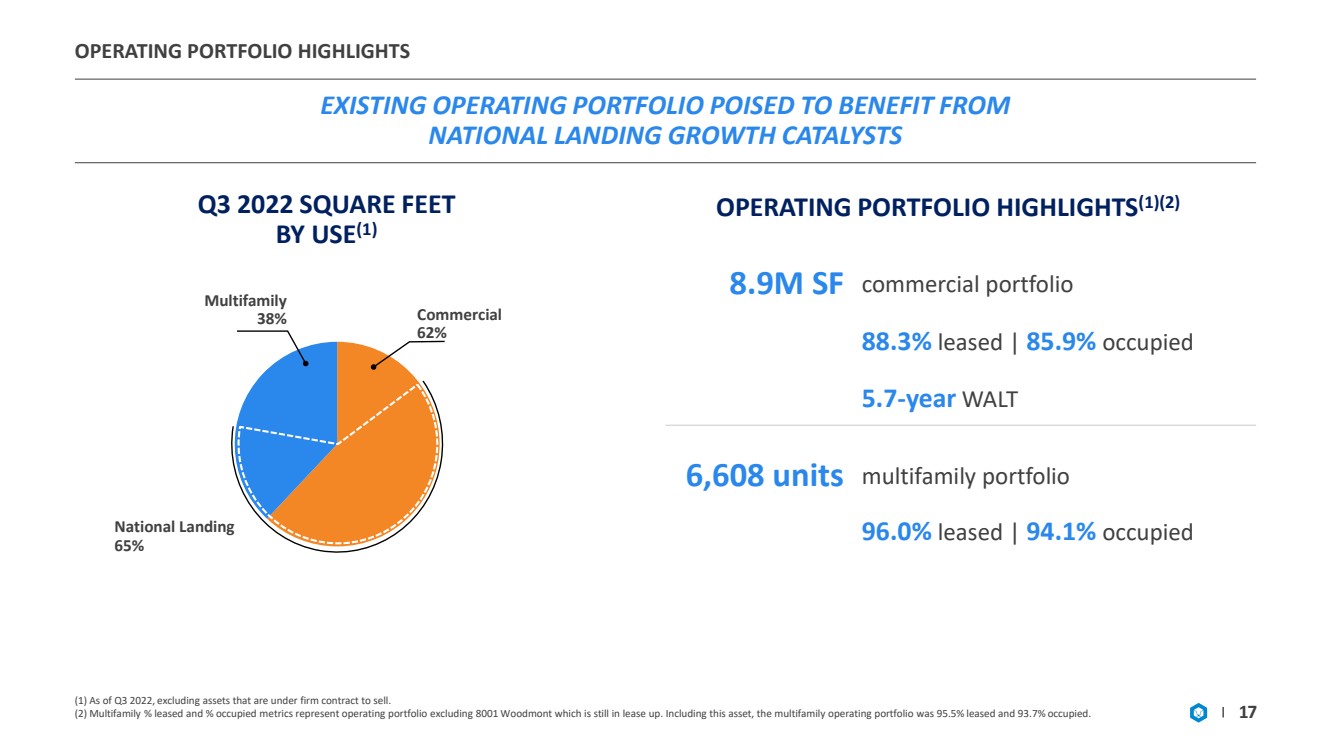
| 運營組合重點介紹了 準備受益於國家落地增長催化劑的現有運營組合 (1)截至2022年第三季度,不包括簽訂了固定銷售合同的資產。 (2)多家庭租賃百分比和佔用百分比指標代表運營組合,不包括仍在租賃中的8001 Woodmont 向上 。包括這筆資產在內,多家庭經營組合中95.5%是租賃的,93.7%是入住率。 17 國家Landing 65% Commercial 62% Multifamily 38% Q3 2022平方英尺 使用 (1) 890萬SF 商業投資組合 88.3% 租賃的| 85.9% occupied 5.7 - year WALT 運營組合亮點 (1)(2) 6,608個單元 多個系列組合 96.0% 租賃| 94.1% 佔用 |
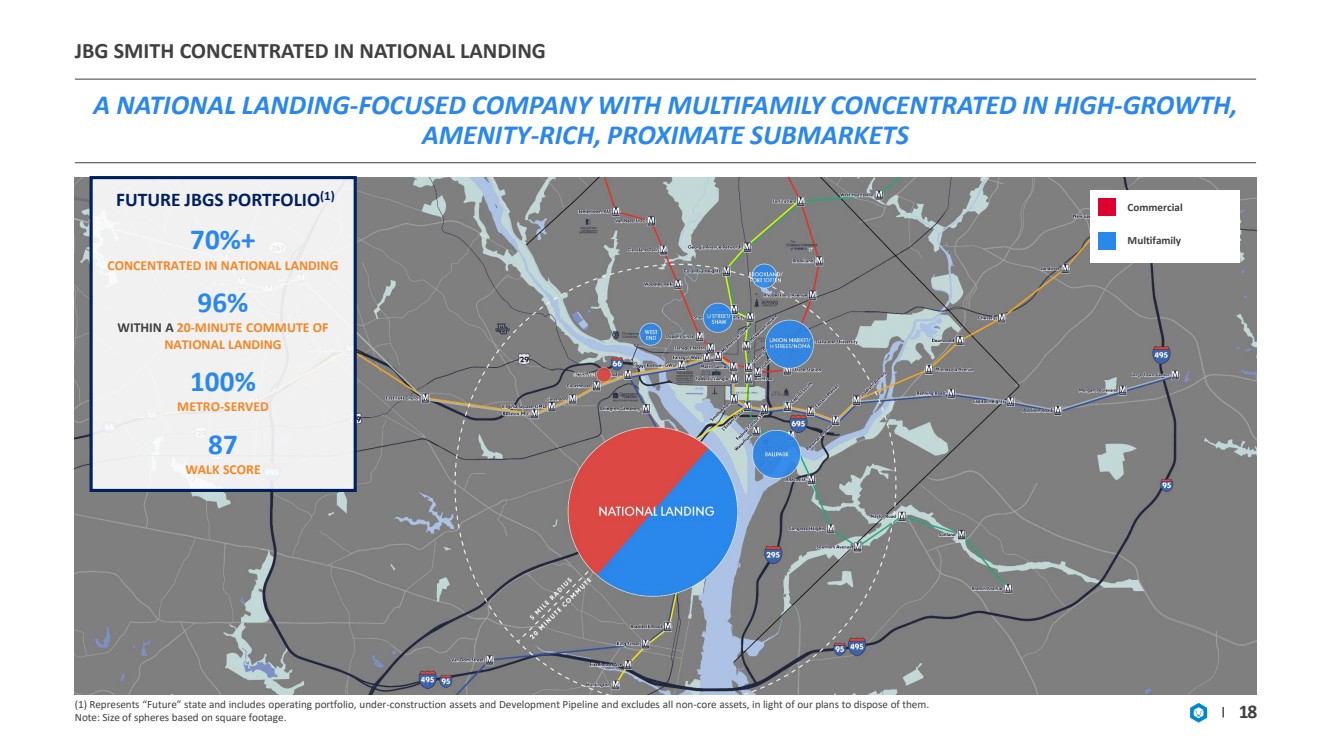
| JBG Smith集中在全國落地 一家專注於全國落地的公司,多個家庭集中在 - 高增長, 設施 - 豐富,鄰近的子市場 18 (1)代表未來狀態,包括運營組合,在 - 建設資產和開發管道下,不包括所有非 - 核心資產,根據我們的處置計劃。 注:以平方英尺為基礎的球體大小。 未來JBGS投資組合 (1) 70%+ 集中在全國落地 96% A 20 - 通勤 全國LANDING 100% METRO - SERVED 87 WALK得分 多家庭 商業 |
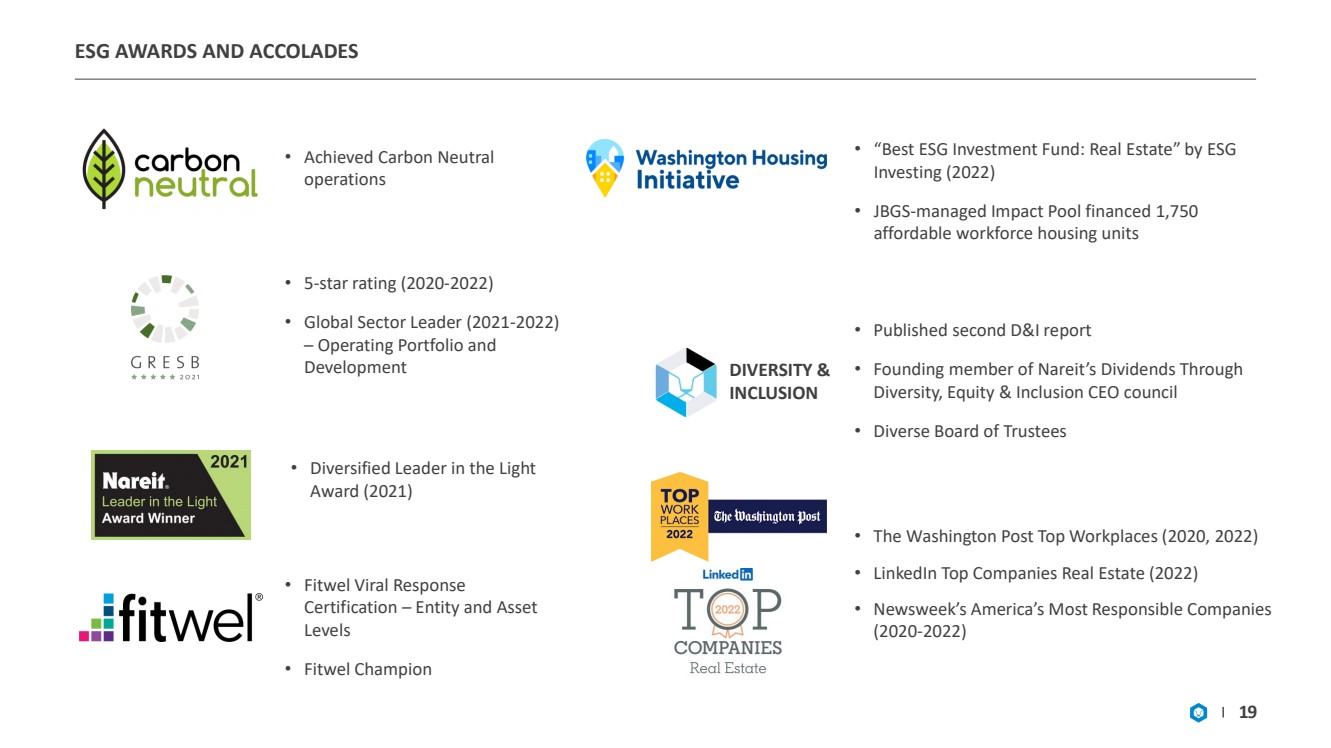
| ESG獎項和榮譽 19 · 實現碳中和運營 · 5 - 星級評級(2020 - 2022) · 全球行業領導者(2021 - 2022) - 運營組合和 發展 · 多元化領導在輕 獎(2021) · 病毒反應 認證 }- 實體和資產 級別 · Fitwel冠軍 · ESG《最佳ESG投資基金:房地產》 投資(2022) · JBGS - 管理影響池資助了1,750 保障性勞動力住房單元 · 發佈了第二份D&I報告 · NAREIT通過多樣性分紅的創始成員,股權和包容性CEO理事會 · 多元化董事會 · 華盛頓郵報頂級工作場所(2020,2022) · LinkedIn頂級公司房地產(2022) · 《新聞週刊》美國最負責任公司 (2020 - 2022) 多元化和 包容性 |
| 定義 碳中性 “碳中性”是指從JBG Smith的建築作業 時代排放到大氣中的任何範圍1或範圍2的碳排放與被清除的等量碳平衡。範圍1 排放量是指運營資產在 - 場地上消耗的天然氣。範圍2排放量是指按運營資產在 - 現場消耗的購買電量。到目前為止,我們的碳中和成就已經通過驗證的碳抵消和購買並退役的綠色 - e認證的可再生能源信用來實現。 開發管道 “開發管道”是指近期的 - 長期開發和未來開發管道。 息税折舊及攤銷前收益( “EBITDA”),房地產EBITDA(“EBITDA re ”) 和“調整後的EBITDA” 利息前收益 税金, Depreciation and Amortization (“EBITDA”), EBITDA for Real Estate (“EBITDAre”) and “Adjusted EBITDA” are non - GAAP financial measures . EBITDA and EBITDAre are used by management as supplemental operating performance measures, which we believe help investors and lenders meaningfully evaluate and compare our operating performance from period - to - period by removing from our operating results the impact of our capital structure (primarily interest charges from our outstanding debt and the impact of our interest rate swaps) and certain non - cash expenses (primarily depreciation and amortization on our{Br}assets) . EBITDAre is computed in accordance with the definition established by Nareit . Nareit defines EBITDAre as GAAP net income (loss) adjusted to exclude interest expense, 所得税 depreciation and amortization expenses, gains and losses on sales of real estate and impairment write - downs of certain real estate assets and investments in entities when the impairment is directly attributable to Decreases in the value of depreciable real estate held by the entity, including our share of such adjustments of unconsolidated real estate ventures . These supplemental measures may help investors and lenders understand our ability to incur and service debt and to make capital expenditures . EBITDA and EBITDAre are not substitutes for net income (loss) (computed in accordance with GAAP) and may not be comparable to similarly titled measures used by other companies . Adjusted EBITDA represents EBITDAre adjusted for items we believe are not representative of ongoing operating results, such as Transaction and Other Costs, impairment write - downs of right - of - use assets associated with leases in which we are a lessee, gain (loss) on the extinguishment of debt, earnings (losses) and distributions in excess of our investment in unconsolidated real estate ventures, 租賃 負債 調整, 投資收入 , business interruption insurance proceeds and share - based compensation expense related to the Formation Transaction and special equity awards . We believe that adjusting such items not considered part 在我們的 可比的 操作中, provides a meaningful measure to evaluate and compare our performance from period - to - period . Because EBITDA, EBITDAre and Adjusted EBITDA have limitations as analytical tools, 我們使用 息税前利潤, EBITDAre and Adjusted EBITDA to supplement GAAP financial measures . Additionally, we believe that users of these measures should consider EBITDA, EBITDAre and Adjusted EBITDA in conjunction with net income (loss) and other GAAP measures in understanding our operating results . A reconciliation of net income (loss) to EBITDA, EBITDAre and Adjusted EBITDA is presented on page 25 . ESTIMATED增量INVESTMENT “Estimated Incremental Investment” means management‘s estimate of the remaining cost to be incurred in connection with the{Br}development of an asset as of September 30 , 2022 , including all remaining acquisition costs, 硬成本, 軟成本, tenant improvements (excluding Free Rent converted to tenant improvement allowances), leasing costs and other similar costs to develop and stabilize the asset but excluding any financing costs and ground rent expenses . Actual incremental investment may differ substantially from Our estimates due to numerous factors, 包括 意外 費用, delays in the estimated start and/or completion date, changes in design and other contingencies . ESTIMATED潛力開發DENSITY “Estimated Potential Development Density” reflects management‘s estimate of developable gross square feet based on our current business plans with respect{Br}to real estate owned or controlled as of September 30 , 2022 . Our current business plans may contemplate development of less than the maximum potential development density for individual assets . As market conditions change, 我們的 業務計劃, 和 因此, the Estimated Potential Development Density, could change accordingly . Given timing, zoning requirements and other factors, we make no assurance that Estimated Potential Development Density amounts will become actual density to the extent we complete development of assets for which we have made such estimates . 20 |

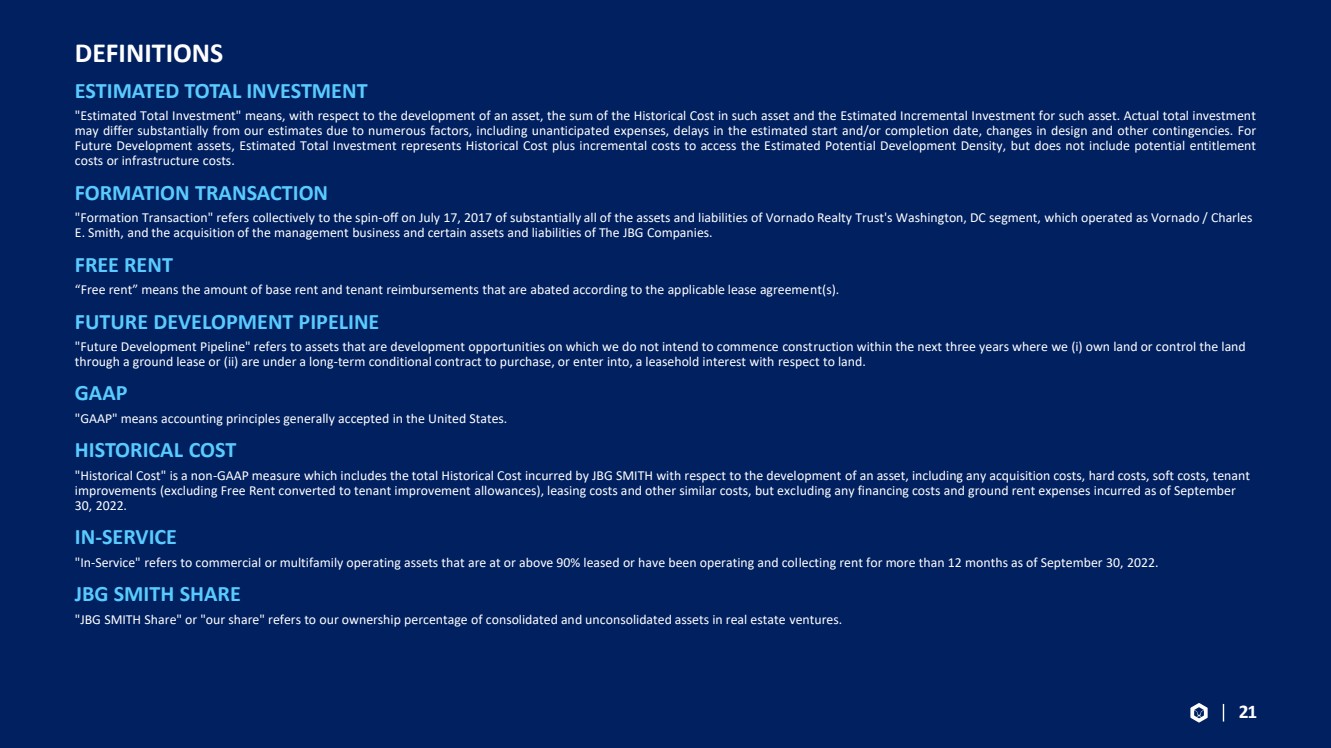
| 定義 預計總INVESTMENT “Estimated Total Investment” means, with respect to the development of an asset, the sum of the Historical Cost in such asset and the Estimated Incremental Investment for such asset . Actual total investment may differ substantially from our estimates due to numerous factors, 包括 意外 費用, delays in the estimated start and/or completion date, changes in design and other contingencies . For Future Development assets, Estimated Total Investment represents Historical Cost plus incremental costs to access the Estimated Potential Development Density, but does not include potential entitlement costs or infrastructure costs . FORMATION交易 “形成交易”是指於2017年7月17日剝離Vornado Realty Trust華盛頓特區部門的幾乎所有資產和負債 - ,該部門的運營名稱為Vornado/Charles E.Smith,以及收購JBG公司的管理業務和某些資產和負債。 免租 “免租”是指根據適用的租賃協議 NT( s)減免的基本租金和租户報銷金額。 未來開發管道 “未來開發管道”是指我們不打算在未來三年內進行開發機會的資產 RUC 我們(I)擁有土地或通過土地租賃控制土地的資產 或(Ii)簽訂了長期有條件購買合同,或進入, 與土地有關的租賃權益。 GAAP “GAAP”是指美國公認的會計原則。 歷史成本 “歷史成本”是一種非 - GAAP計量,包括JBG Smith與資產開發有關的歷史成本總額,包括任何收購成本、硬成本、軟成本、租户 改善(不包括免費租金轉換為租户改善津貼)、租賃成本和其他類似成本。但不包括截至9月30日發生的任何融資成本和地租費用,2022. IN - SERVICE “In - Service”是指截至9月30日租賃90%或以上或已運營並收取租金超過12個月的商業或多户經營性資產。2022. JBG Smith Share “JBG Smith Share”或“Our Share”是指我們在房地產合併和未合併資產中的所有權百分比 甚至 期貨。 21 |
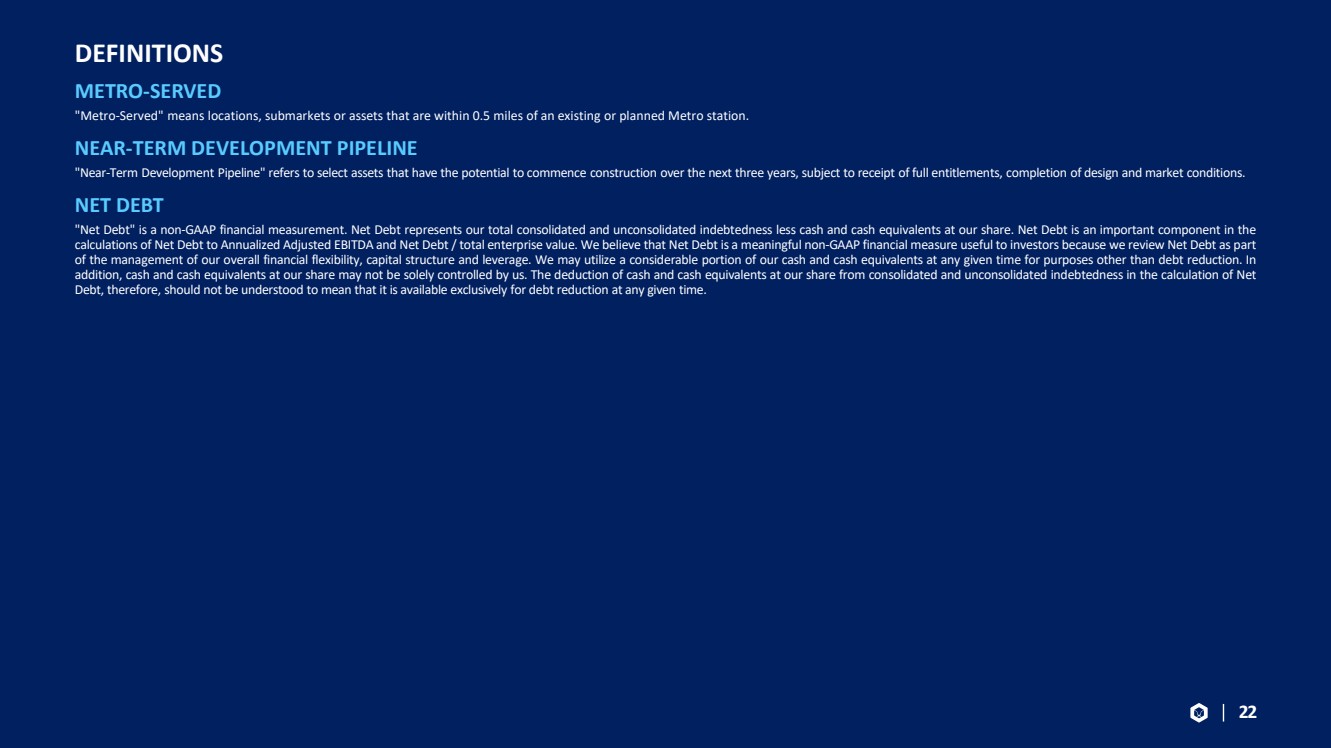
| DEFINITIONS METRO - SERVED “Metro - Served”的意思是地點,位於現有或規劃中的地鐵站0.5英里範圍內的子市場或資產。 靠近 - Term Development PIPELINE “Near - Term Development Pipeline” refers to select assets that have the potential to commence construction over the next three years, subject to receipt of full entitlements, completion of design and market conditions . NET DEBT “Net Debt” is a non - GAAP financial measurement . Net Debt represents our total consolidated and unconsolidated indebtedness less cash and cash equivalents at our share . Net Debt is an important component in the calculations of Net Debt to Annualized Adjusted EBITDA and Net Debt / total enterprise value . We believe that Net Debt is a meaningful non - GAAP financial measure useful to investors because we review Net Debt as part of the management of our overall financial flexibility, capital structure and leverage . We may utilize a considerable portion of our cash and cash equivalents at any given time for purposes other than debt reduction . In addition, cash and cash equivalents at our share may not be solely controlled by us . The deduction of cash and cash equivalents at our share from consolidated and unconsolidated Indebtedness in the calculation of Net Debt, 因此, should not be understood to mean that it is available exclusively for debt reduction at any given time . 22 |
| DEFINITIONS NET OPERATING INCOME ("NOI"), "ANNUALIZED NOI", "ESTIMATED STABI LIZED NOI" AND "PROJECTED NOI YIELD" Net Operating Income ("NOI"), "Annualized NOI", "Estimated Stabilized NOI" and "Projected NOI Yield" are non - GAAP financial measures management uses to assess a segment's performance . The most directly comparable GAAP measure is net income (loss) attributable to common shareholders . We use NOI internally as a performance measure and believe NOI provides useful information to investors regarding our financial condition and results of operations because it reflects only property related revenue (which includes base rent, tenant reimbursements and other operating revenue, net of Free Rent and payments associated with assumed lease liabilities) less operating expenses and ground rent for operating leases, if applicable . NOI also excludes deferred rent, related party management fees, interest expense, and certain other non - cash adjustments, including the accretion of acquired below - market leases and the amortization of acquired above - market leases and below - market ground lease intangibles . Management uses NOI as a supplemental performance measure of our assets and believes it provides useful information to investors because it reflects only those revenue and expense items that are incurred at the asset level, excluding non - cash items . In addition, NOI is considered by many in the real estate industry to be a useful starting point for determining the value of a real estate asset or group of assets . However, because NOI excludes depreciation and amortization and captures neither the changes in the value of our assets that result from use or market conditions, nor the level of capital expenditures and capitalized leasing commissions necessary to maintain the operating performance of our assets, all of which have real economic effect and could materially impact the financial performance of our assets, the utility of NOI as a measure of the operating performance of our assets is limited . NOI presented by us may not be comparable to NOI reported by other REITs that define these measures differently . We believe to facilitate a clear understanding of our operating results, NOI should be examined in conjunction with net income (loss) attributable to common shareholders as presented in our financial statements . NOI should not be considered as an alternative to net income (loss) attributable to common shareholders as an indication of our performance or to cash flows as a measure of liquidity or our ability to make distributions . Annualized NOI, for all assets except Crystal City Marriott, represents NOI for the three months ended September 30 , 2022 multiplied by four . Due to seasonality in the hospitality business, Annualized NOI for Crystal City Marriott represents the trailing 12 month NOI as of September 30 , 2022 . Management believes Annualized NOI provides useful information in understanding our financial performance over a 12 month period, however, investors and other users are cautioned against attributing undue certainty to our calculation of Annualized NOI . Actual NOI for any 12 month period will depend on a number of factors beyond our ability to control or predict, including general capital markets and economic conditions, any bankruptcy, insolvency, default or other failure to pay rent by one or more of our tenants and the destruction of one or more of our assets due to terrorist attack, natural disaster or other casualty, among others . We do not undertake any obligation to update our calculation to reflect events or circumstances occurring after the date of this earnings release . There can be no assurance that the Annualized NOI shown will reflect our actual results of operations over any 12 month period . This Investor Presentation also contains management's estimate of stabilized NOI and projections of NOI yield for Under - Construction and Near - Term Development Pipeline assets, which are based on management's estimates of property - related revenue and operating expenses for each asset . These estimates are inherently uncertain and represent management's plans, expectations and beliefs and are subject to numerous assumptions, risks and uncertainties . The property - related revenues and operating expenses for our assets may differ materially from the estimates included in this Investor Presentation . Management's projections of NOI yield are not projections of our overall financial performance or cash flow, and there can be no assurance that the Projected NOI Yield set forth in this Investor Presentation will be achieved . Projected NOI Yield means our Estimated Stabilized NOI reported as a percentage of (i) Estimated Total Investment and (ii) Estimated Incremental Investment . Actual initial full year stabilized NOI yield may vary from the Projected NOI Yield based on the actual incremental investment to complete the asset and its actual initial full year stabilized NOI, and there can be no assurance that we will achieve the Projected NOI Yields described in this Investor Presentation . We do not provide reconciliations for non - GAAP estimates on a future basis, including Estimated Stabilized NOI and expected annualized NOI because we are unable to provide a meaningful or accurate calculation or estimate of reconciling items and the information is not available without unreasonable effort . This inability is due to the inherent difficulty of forecasting the timing and/or amounts of various items that would impact net income (loss) . Additionally, no reconciliation of Projected NOI Yield to the most directly comparable GAAP measure is included in this Investor Presentation because we are unable to quantify certain amounts that would be required to be included in the comparable GAAP financial measures without unreasonable efforts because such data is not currently available or cannot be currently estimated with confidence . Accordingly, we believe such reconciliations would imply a degree of precision that would be confusing or misleading to investors . NON - SAME STORE “Non - same store” refers to all operating assets excluded from the Same Store pool. 23 |

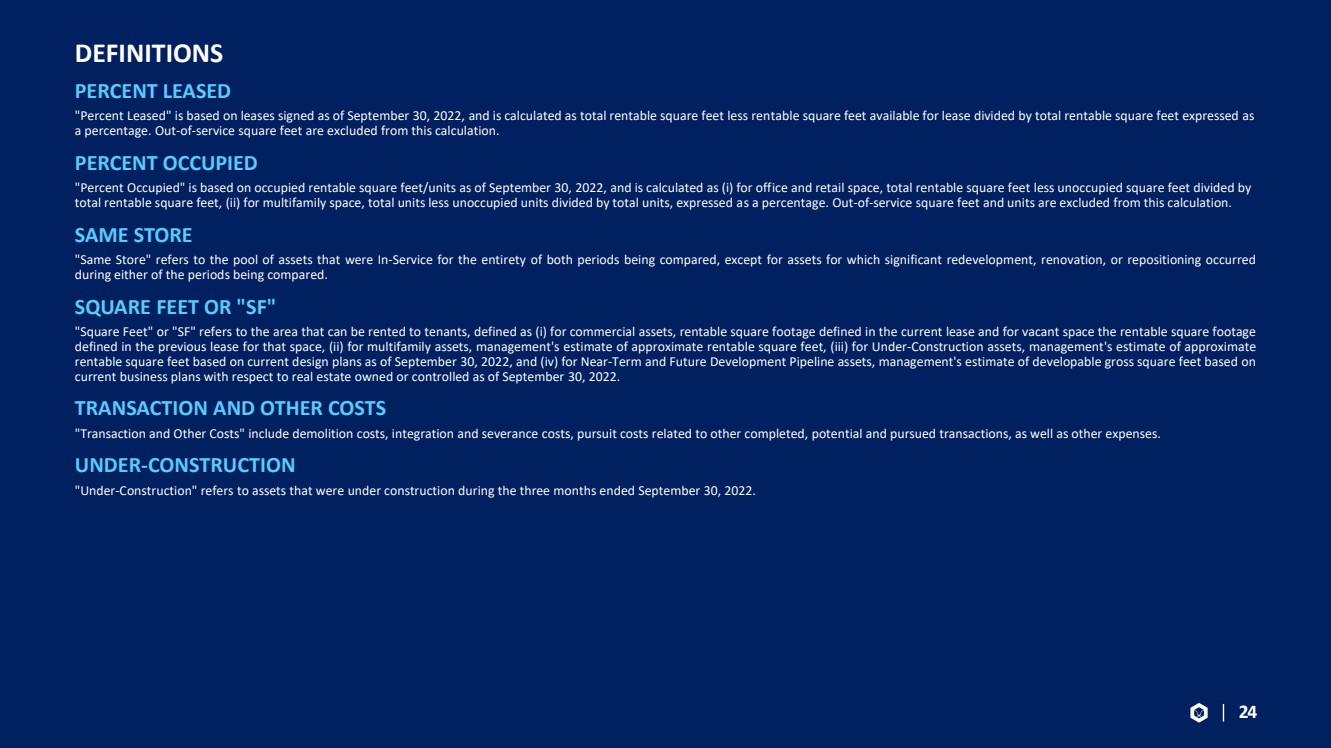
| DEFINITIONS PERCENT LEASED "Percent Leased" is based on leases signed as of September 30, 2022, and is calculated as total rentable square feet less ren tab le square feet available for lease divided by total rentable square feet expressed as a percentage. Out - of - service square feet are excluded from this calculation. PERCENT OCCUPIED "Percent Occupied" is based on occupied rentable square feet/units as of September 30, 2022, and is calculated as (i) for off ice and retail space, total rentable square feet less unoccupied square feet divided by total rentable square feet, (ii) for multifamily space, total units less unoccupied units divided by total units, expressed a s a percentage. Out - of - service square feet and units are excluded from this calculation. SAME STORE "Same Store" refers to the pool of assets that were In - Service for the entirety of both periods being compared, except for assets for which significant redevelopment, renovation, or repositioning occurred during either of the periods being compared . SQUARE FEET OR "SF" "Square Feet" or "SF" refers to the area that can be rented to tenants, defined as (i) for commercial assets, rentable square footage defined in the current lease and for vacant space the rentable square footage defined in the previous lease for that space, (ii) for multifamily assets, management's estimate of approximate rentable square feet, (iii) for Under - Construction assets, management's estimate of approximate rentable square feet based on current design plans as of September 30 , 2022 , and (iv) for Near - Term and Future Development Pipeline assets, management's estimate of developable gross square feet based on current business plans with respect to real estate owned or controlled as of September 30 , 2022 . TRANSACTION AND OTHER COSTS "Transaction and Other Costs" include demolition costs, integration and severance costs, pursuit costs related to other completed, potential and pursued transactions, as well as other expenses . UNDER - CONSTRUCTION "Under - Construction" refers to assets that were under construction during the three months ended September 30, 2022. 24 |
| EBITDA, EBITDARE AND ADJUSTED EBITDA RECONCILIATIONS (NON - GAAP) (UNAUDITED) Note: All EBITDA measures as shown above are attributable to common limited partnership units. (1) Related to decreases in the value of the underlying assets. (2) Includes demolition costs, integration and severance costs, pursuit costs related to other completed, potential and pursued t ran sactions, as well as other expenses. (3) Calculated using Net Debt. Quarterly Adjusted EBITDA is annualized by multiplying by four. Adjusted EBITDA for the nine month s e nded September 30, 2022 and 2021 is annualized by multiplying by 1.33. Net Debt to annualized Adjusted EBITDA would have been 7.7x and 8.8x for the three and nine months ended September 30, 2022, after adjusting for acquisitions and dispositions that occ urred during and subsequent to quarter end. (4) Net of premium/discount and deferred financing costs. 25 dollars in thousands Three Months Ended September 30, Nine Months Ended September 30, 2022 2021 2022 2021 EBITDA, EBITDAre and Adjusted EBITDA Net income (loss) $ (21,581) $ 996 $ 119,836 $ (26,391) Depreciation and amortization expense 50,056 56,726 157,597 178,130 Interest expense 17,932 17,243 50,251 50,312 Income tax expense 166 217 2,600 4,527 Unconsolidated real estate ventures allocated share of above adjustments 7,725 10,147 27,048 30,892 EBITDA attributable to noncontrolling interests (28) (54) (101) 976 EBITDA $ 54,270 $ 85,275 $ 357,231 $ 238,446 Gain on the sale of real estate, net — — (158,631) (11,290) Gain on the sale of unconsolidated real estate assets — (23,137) (6,179) (28,326) Impairment related to unconsolidated real estate ventures (1) 15,401 1,380 15,401 1,380 EBITDAre $ 69,671 $ 63,518 $ 207,822 $ 200,210 Transaction and other costs, net of noncontrolling interests (2) 1,746 2,951 4,598 7,803 (Income) loss from investments, net 567 — (14,721) — Loss on the extinguishment of debt 1,444 — 3,073 — Share - based compensation related to Formation Transaction and special equity awards 548 3,480 4,369 12,866 Earnings and distributions in excess of our investment in unconsolidated real estate venture (18) (280) (583) (702) Unconsolidated real estate ventures allocated share of above adjustments 34 130 2,079 170 Adjusted EBITDA $ 73,992 $ 69,799 $ 206,637 $ 220,347 Net Debt to Annualized Adjusted EBITDA (3) 7.9 x 7.9 x 8.4 x 7.5 x September 30, 2022 September 30, 2021 Net Debt (at JBG SMITH Share) Consolidated indebtedness (4) $ 2,382,429 $ 2,063,426 Unconsolidated indebtedness (4) 215,341 362,698 Total consolidated and unconsolidated indebtedness 2,597,770 2,426,124 Less: cash and cash equivalents 272,388 213,612 Net Debt (at JBG SMITH Share) $ 2,325,382 $ 2,212,512 |

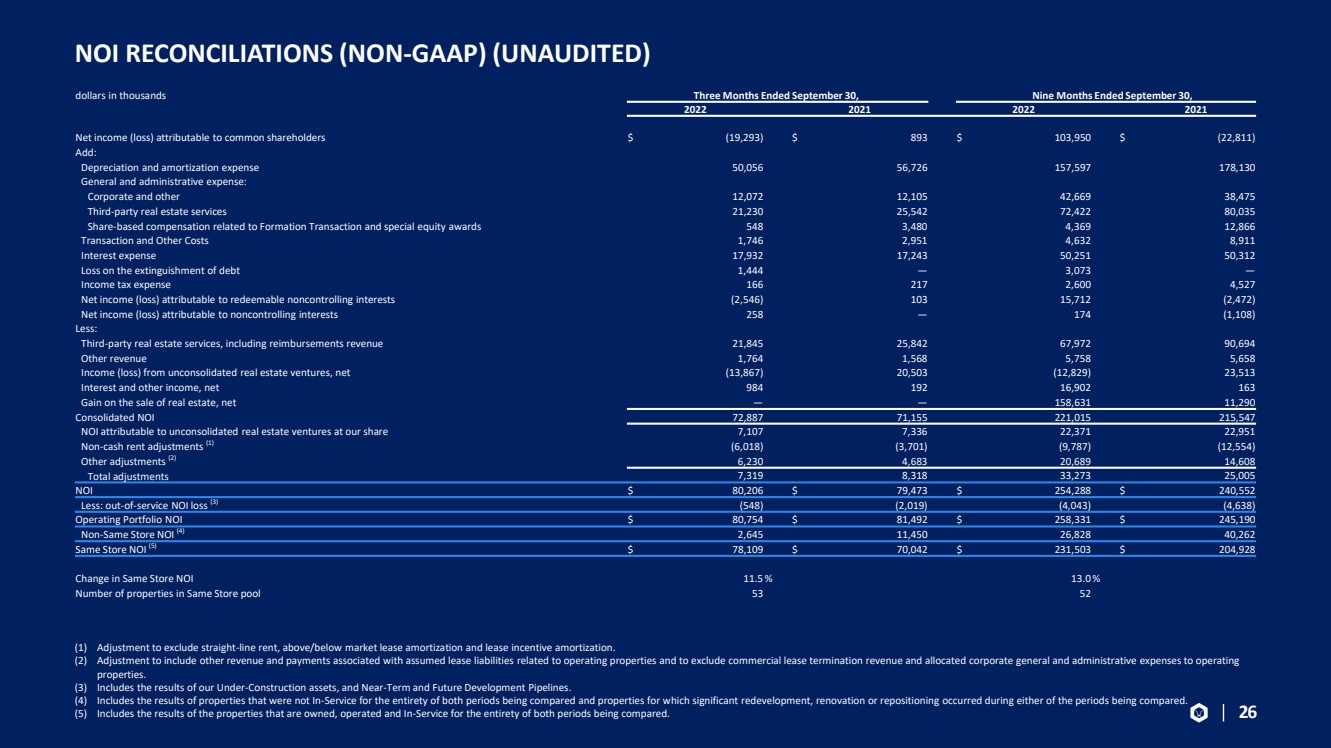
| NOI RECONCILIATIONS (NON - GAAP) (UNAUDITED) (1) Adjustment to exclude straight - line rent, above/below market lease amortization and lease incentive amortization. (2) Adjustment to include other revenue and payments associated with assumed lease liabilities related to operating properties an d t o exclude commercial lease termination revenue and allocated corporate general and administrative expenses to operating properties. (3) Includes the results of our Under - Construction assets, and Near - Term and Future Development Pipelines. (4) Includes the results of properties that were not In - Service for the entirety of both periods being compared and properties for w hich significant redevelopment, renovation or repositioning occurred during either of the periods being compared. (5) Includes the results of the properties that are owned, operated and In - Service for the entirety of both periods being compared. 26 dollars in thousands Three Months Ended September 30, Nine Months Ended September 30, 2022 2021 2022 2021 Net income (loss) attributable to common shareholders $ (19,293) $ 893 $ 103,950 $ (22,811) Add: Depreciation and amortization expense 50,056 56,726 157,597 178,130 General and administrative expense: Corporate and other 12,072 12,105 42,669 38,475 Third - party real estate services 21,230 25,542 72,422 80,035 Share - based compensation related to Formation Transaction and special equity awards 548 3,480 4,369 12,866 Transaction and Other Costs 1,746 2,951 4,632 8,911 Interest expense 17,932 17,243 50,251 50,312 Loss on the extinguishment of debt 1,444 — 3,073 — Income tax expense 166 217 2,600 4,527 Net income (loss) attributable to redeemable noncontrolling interests (2,546) 103 15,712 (2,472) Net income (loss) attributable to noncontrolling interests 258 — 174 (1,108) Less: Third - party real estate services, including reimbursements revenue 21,845 25,842 67,972 90,694 Other revenue 1,764 1,568 5,758 5,658 Income (loss) from unconsolidated real estate ventures, net (13,867) 20,503 (12,829) 23,513 Interest and other income, net 984 192 16,902 163 Gain on the sale of real estate, net — — 158,631 11,290 Consolidated NOI 72,887 71,155 221,015 215,547 NOI attributable to unconsolidated real estate ventures at our share 7,107 7,336 22,371 22,951 Non - cash rent adjustments (1) (6,018) (3,701) (9,787) (12,554) Other adjustments (2) 6,230 4,683 20,689 14,608 Total adjustments 7,319 8,318 33,273 25,005 NOI $ 80,206 $ 79,473 $ 254,288 $ 240,552 Less: out - of - service NOI loss (3) (548) (2,019) (4,043) (4,638) Operating Portfolio NOI $ 80,754 $ 81,492 $ 258,331 $ 245,190 Non - Same Store NOI (4) 2,645 11,450 26,828 40,262 Same Store NOI (5) $ 78,109 $ 70,042 $ 231,503 $ 204,928 Change in Same Store NOI 11.5 % 13.0 % Number of properties in Same Store pool 53 52 |
|