外國私人發行人根據1934年《證券交易法》第13a-16條或15d-16條提交的報告
用複選標記表示註冊人是否在表格20-F或表格40-F的封面下提交或將提交年度報告。
Form 20-F

Form 40-F

用複選標記表示註冊人是否按照S-T規則101(B)(1)所允許的紙質提交表格6-K:
注:S-T規則第101(B)(1)條僅允許在僅為向證券持有人提供所附年度報告的情況下以紙質形式提交表格6-K
。
用複選標記表示註冊人是否按照S-T規則101(B)(7)所允許的紙質提交表格6-K:
注:條例S-T規則101(B)(7)只允許以紙質形式提交表格6-K
,如果提交的是註冊人外國私人發行人必須根據註冊人註冊成立、住所或合法組織的司法管轄區的法律(註冊人所在的國家/地區)的法律,或註冊人的證券交易所在的母國交易所的規則,必須提供並公佈的報告或其他文件,只要報告或其他文件不是新聞稿,
不需要也沒有分發給註冊人的證券持有人,
如果討論重大事件,則已經是Form 6-K提交的
或委員會在EDGAR上提交的其他文件的主題。
本報告包括與22財年第一季度業績相關的媒體新聞稿和向投資者演示的幻燈片。
根據《公約》第53條臨時宣佈
瑞士信貸報告稱,22年第一季度淨收入為44億瑞士法郎,税前虧損4.28億瑞士法郎,CET1比率為13.8%
|
2022年第一季度的特點是市場狀況波動和客户避險情緒。這些情況,加上我們在2021年採取果斷行動加強整體風險和控制基礎而降低風險偏好的影響,對我們的淨收入產生了不利影響。我們的運營費用同比增加,特別是由於我們繼續採取積極主動的方式解決訴訟問題,本季度報告的訴訟費用增加了7.03億瑞士法郎。在此背景下,我們報告了該季度的税前虧損;然而,在調整*的基礎上,我們報告的税前收入為3億瑞士法郎,其中包括與俄羅斯入侵烏克蘭有關的2.06億瑞士法郎的不利影響。
2022年是一個過渡年,我們明確的重點仍然是有條不紊地執行我們於2021年11月宣佈的新集團戰略:加強我們的核心,簡化我們的組織
併為增長而投資。我們於1月啟用了我們的新結構;已將IB中的分配資本減少了25億美元,是我們超過30億美元雄心的82%;並在其他各種戰略優先事項上取得了重大進展。我相信,我們有能力建立一家更強大、以客户為中心的銀行,把風險管理放在核心位置,為投資者、客户和同事提供可持續的增長和價值。“
託馬斯·戈特斯坦,瑞士信貸集團首席執行官
|
瑞士信貸集團22年第一季度業績
|
已報告
(百萬瑞士法郎)
|
1Q22
|
4Q21
|
1Q21
|
Δ4Q21
|
Δ1Q21
|
|
淨收入
|
4,412
|
4,582
|
7,574
|
(4)%
|
(42)%
|
|
信貸損失準備金
|
(110)
|
(20)
|
4,394
|
-
|
-
|
|
總運營費用
|
4,950
|
6,266
|
3,937
|
(21)%
|
26%
|
|
税前收益/(虧損)
|
(428)
|
(1,664)
|
(757)
|
-
|
-
|
|
實際税率
|
35%
|
(25)%
|
69%
|
-
|
-
|
|
股東應佔淨收益/(虧損)
|
(273)
|
(2,085)
|
(252)
|
-
|
-
|
|
有形權益回報率
|
(2.6)%
|
(20.9)%
|
(2.6)%
|
-
|
-
|
|
成本/收入比
|
112%
|
137%
|
52%
|
-
|
-
|
|
新增淨資產(NNA)(以瑞士法郎為單位)
|
7.9
|
1.6
|
28.4
|
-
|
(72)%
|
|
管理的資產(AUM)(以瑞士法郎為單位)
|
1,555
|
1,614
|
1,596
|
(4)%
|
(3)%
|
|
調整後*
(百萬瑞士法郎)
|
1Q22
|
4Q21
|
1Q21
|
|
Δ1Q21
|
|
淨收入
|
4,582
|
4,384
|
7,430
|
4%
|
(38)%
|
|
信貸損失準備金
|
45
|
(15)
|
(36)
|
-
|
-
|
|
總運營費用
|
4,237
|
4,071
|
3,870
|
4%
|
9%
|
|
税前收益/(虧損)
|
300
|
328
|
3,596
|
(8)%
|
(92)%
|
|
與俄羅斯相關的O/W
|
(206)
|
|
|
|
|
22年第一季度的資本充足率
|
13.8%
|
4.3%
|
6.1%
|
|
CET1比率與2011年第一季度的12.2%
|
CET1槓桿率與2011年第一季度的3.8%
|
第1級槓桿率與21季度的5.4%
|
第1頁
22年第1季度業績摘要
2022年第一季度,我們的淨收入同比下降42%,原因是投資銀行(IB)淨收入下降,按美元計算下降51%;財富管理(WM)淨收入下降44%;以及資產管理(AM)淨收入下降10%。瑞士銀行(SB)本季度營收同比增長8%,僅略微抵消了這一增長。報告的淨收入包括房地產收益1.64億瑞士法郎,被我們在AllFunds Group的股權投資相關的虧損3.53億瑞士法郎和俄羅斯相關影響的1.48億瑞士法郎所抵消。我們調整後*淨收入為46億瑞士法郎,同比下降38%。
整個季度的經濟環境和市場狀況給我們的許多業務領域帶來了挑戰,利率預期的變化、通脹壓力
以及影響更廣泛市場狀況和商業活動的地緣政治緊張局勢。
我們錄得22年第一季度信貸損失準備金淨釋放1.1億瑞士法郎,其中包括與評估與Archegos有關的應收賬款未來可回收性評估有關的1.55億瑞士法郎,但與俄羅斯入侵烏克蘭有關的信貸損失準備金5800萬瑞士法郎部分抵消了這一點。
報告的50億瑞士法郎的運營費用同比增長26%,主要是由於7.03億瑞士法郎的訴訟撥備,其中主要的訴訟撥備為6.53億瑞士法郎,由於標準化遞延水平2.14億瑞士法郎,用於賠償的現金應計增加。我們有1.52億瑞士法郎的精選戰略投資,如集中我們的採購流程,投資於集團範圍的基礎設施,以及風險和合規。我們調整後的*
|
42億瑞士法郎中的第一季度的運營費用增加了9%,這主要是由於標準化的遞延水平導致用於補償的現金應計增加所致。
我們報告的税前虧損為4.28億瑞士法郎,而2011年第一季度的税前虧損為7.57億瑞士法郎。我們在2012年第一季度的調整*税前收入為3億瑞士法郎,同比下降92%,包括與俄羅斯相關的2.06億瑞士法郎的虧損,與異常強勁的21季度相比,主要反映了在動盪的市場條件下客户活動和資本市場發行的減少,以及整個2021年風險偏好的累積減少,由於正常化遞延水平增加了用於補償的現金應計項目,以及由於國債賬面上的收益率曲線趨平而對衝波動的影響。
我們報告了股東應佔淨虧損2.73億瑞士法郎,而2011年第一季度股東應佔淨虧損為2.52億瑞士法郎。
我們在22年第一季度的NNA集團為79億瑞士法郎,而2011年第一季度為284億瑞士法郎。我們22年第一季度的全球財富管理NNA,包括我們的財富管理(WM)部門和瑞士私人銀行部門,為46億瑞士法郎;儘管市場動盪,但我們在WM所有地區的NNA都為正。WM和瑞士私人銀行業務在地區層面上的貢獻分別為瑞士21億瑞士法郎、歐洲、中東和非洲地區6億瑞士法郎、亞太地區18億瑞士法郎和美洲1億瑞士法郎。瑞士銀行60億瑞士法郎的淨資產在很大程度上是由其機構客户業務推動的。
我們保持了彈性的資本基礎,我們的CET1資本充足率為13.8%,CET1槓桿率為4.3%,而我們的一級槓桿率在第一季度末為6.1%。
|
按地區劃分的22季度和21季度淨收入
 |
11.瑞士
歐洲、中東和非洲地區
亞太地區
美洲
|
|
|
|
11.瑞士
歐洲、中東和非洲地區
亞太地區
Americas |
|
| |
|
|
|
| |
|
|
|
| |
|
|
|
| |
|
|
|
| |
|
|
|
| |
|
|
|
第2頁
|
展望
|
|
俄羅斯入侵烏克蘭後的當前地緣政治形勢,以及幾家主要央行為應對通脹擔憂而啟動的大幅貨幣緊縮,共同導致了今年迄今的波動性和客户避險情緒加劇。雖然瑞士銀行在22年第一季度表現強勁,股票衍生品、併購和證券化產品表現穩健,但總體而言,這種市場環境,加上我們在2021年執行的新定義的風險偏好的累積效應,對我們財富管理部門的客户活動產生了不利影響,並導致我們投資銀行內部的資本市場發行水平下降。此外,投資銀行對受益於這些發展的業務領域的風險敞口相對有限,例如利率交易。
我們預計,這些市場狀況將在未來幾個月持續下去。在我們的財富管理業務中,雖然收入應該會在今年晚些時候受益於較高的利率環境,但客户的風險偏好可能仍然低迷。在投資銀行內部,雖然我們的併購諮詢渠道連續和同比上升,我們的槓桿融資業務仍然活躍,但我們完成這項客户業務的能力
取決於市場狀況。儘管我們業務的風險狀況正在改善,但我們的收入將受到2021年我們風險偏好的累積下降以及我們大多數Prime Service業務的退出的不利影響。關於費用,雖然考慮到市場環境,可變薪酬預計將受到抑制,但我們預計,由於正常化的遞延水平,用於薪酬的現金應計項目將增加。此外,我們預計
將繼續在風險、合規性和基礎設施方面投入大量補救費用。我們繼續執行我們的費用節約計劃,我們的採購職能外包應該會產生顯著的節省;然而,這一更廣泛的計劃的主要好處預計要到2023年才能實現。
正如我們之前在2021年11月4日的投資者日上強調的那樣,2022年將是瑞士信貸轉型的一年。對我們核心業務的戰略性資本重新分配的好處,以及我們目前正在實施的重組措施的結構性成本節約,應從2023年起基本實現。在這方面,我們專注於嚴格執行我們的戰略,明確關注
加強和簡化我們的綜合模式並投資於可持續增長,同時將風險管理置於銀行的核心。
|
我們專注於完善和重振我們的特許經營權,以推動我們對瑞士信貸的願景。這一戰略願景建立在我們相當強大的實力之上,預計將支持我們實現長期、可持續增長的道路。我們的戰略通過創建一個綜合財富管理和全球投資銀行部門來解決分散問題。我們正在做出明確的選擇,並計劃在我們認為擁有可持續競爭優勢的業務和市場上進行重大投資。
我們計劃在未來三年將大約30億瑞士法郎的資本轉移到財富管理公司,並投資於我們所有的核心業務。
在22年第1季度期間,我們實現了以下與集團戰略相關的目標:
◾實現了我們的目標的82%,即25億美元,釋放了分配給IB的30多億美元資本,用於轉移到我們的核心業務
◾於2022年4月1日與ChainIQ啟動了一項外包協議,並有望提供集中採購
|
節省成本,以及加強統一運營平臺和部門的協同效應。這使我們走上了實現到2024年每年節省10億至15億瑞士法郎的雄心的道路上
投資於增長計劃
◾加強了我們的集成模型,並通過在IB(與WM的合資企業)中推出私人和增長市場,並將我們的工作重點重新放在我們的GTS平臺上,以加強IB和WM之間的協作,從而推動部門間協作的增加
◾在全球財富管理(包括我們的財富管理部門和瑞士私人銀行業務)方面,我們實現了接近我們中期目標的33%至35%的授權滲透率水平;截至22年第一季度末,我們的授權滲透率為33%,而21年第四季度末為32%
◾在投資銀行,我們朝着退出Prime Services的雄心取得了相當大的進展1到2022年底。自2011年第一季度以來,我們已將優質餘額減少了84%
◾在我們的瑞士銀行,我們的目標是到2022年年底為我們的數字產品CSX提供200,000個客户,目前大約有125,000個客户使用;這反映了我們國內市場的持續強勁
|
供應鏈金融資金重要更新
瑞士信貸資產管理公司(CSAM)繼續代表我們的投資者尋求所有可用渠道追回資金;這仍然是優先事項。我們繼續通過
公開披露的問答和投資組合詳細信息向利益相關者通報最新情況,最新信息發佈於2022年4月13日。
截至2022年3月31日,重點領域的資金約為21.8億美元。關於GFG Australia,自2021年10月以來,通過每月付款返還的現金總額以及首次付款約為2.04億澳元(1.48億美元)。2。目前正在與GFG聯盟和Blustone就其他資產的再融資和重組進行討論。此外,截至2022年3月31日,我們已通過向Greensill Bank的
備案流程提交了14項保險索賠。這14項債權對應的CSAM基礎風險敞口總額約為20億美元。
俄羅斯入侵烏克蘭的影響
我們在所有業務中積極管理對俄羅斯入侵烏克蘭的風險敞口。我們大幅減少了在俄羅斯的淨信貸敞口3至3.73億瑞士法郎,自2021年底以來減少了56%。我們的淨信用風險敞口4自2021年底以來,對俄羅斯金融機構的風險敞口下降了67%,我們正在繼續減少我們的敞口。我們的公司和個人客户高度擔保非俄羅斯抵押品,損失有限。
在22年第一季度,由於俄羅斯入侵烏克蘭,我們損失了2.06億瑞士法郎,這對我們的業績產生了負面影響。這包括來自交易和公允價值損失的1.48億瑞士法郎和5800萬瑞士法郎的信貸損失準備金,
主要反映了由於信用風險增加而預期的信貸損失的非特定準備金4400萬瑞士法郎。
此外,我們俄羅斯子公司的資產淨值為2億瑞士法郎,與2011年第四季度末相比減少了1600萬瑞士法郎。
第4頁
分區摘要
|
財富管理公司(WM)
|
|
|
|
*調整後的税前收入季度以百萬瑞士法郎為單位
|
|
1Q22
在調整*的基礎上,WM的税前收入下降到2.12億瑞士法郎,同比下降74%,但與2011年第四季度相比有所上升。報告税前收入的減少反映了一些不利因素,包括對Allfund Group的股權投資虧損3.53億瑞士法郎,訴訟準備金2.37億瑞士法郎,與俄羅斯有關的不利影響約9900萬瑞士法郎,包括4000萬瑞士法郎的信貸準備金。調整後*税前收入同比下降的主要原因是調整後*淨收入下降22%,主要原因是交易活動減少,以及調整後*運營費用增加,增長16%,反映出由於標準化遞延
水平、技術投資、集團範圍內風險和合規成本上升以及關係經理人數增加,用於薪酬的現金應計增加。在22年第一季度,我們通過實施新的
組織結構以執行我們對該部門的長期願景,在為綜合財富管理部門奠定基礎方面取得了進展。這包括推出新的戰略能力,包括融資和產品組、投資解決方案和可持續發展以及客户細分管理。
WM公佈的淨收入為12億瑞士法郎,同比下降44%。報告淨收入的下降是由於GTS收入疲軟、經紀和產品發行費用下降以及對AllFunds Group的股權投資虧損3.53億瑞士法郎,但被2500萬瑞士法郎的房地產銷售收益部分抵消。結果還包括按市值計價的損失5亞太地區3,400萬瑞士法郎的融資,以及與2,600萬瑞士法郎的SCFF費用減免計劃有關的負收入。調整後*淨收入為15億瑞士法郎,下降22%,原因是基於交易和業績的收入下降,下降38%,原因是2011年第一季度可比收入強勁,GTS收入下降,以及經紀和
產品發行費用下降,包括結構性產品收入,原因是22年第一季度具有挑戰性的市場狀況。我們還看到淨利息收入下降了8%,經常性佣金和手續費下降了5%,這主要是由於貸款額下降
。
WM本季度淨資產淨值為48億瑞士法郎,主要流入瑞士超高淨值業務和亞太地區,以及我們的外部資產管理業務。WM在22年第一季度記錄的AuM為7070億瑞士法郎,相比之下,2011年第一季度為7570億瑞士法郎,2011年第四季度為7430億瑞士法郎,反映了不利的市場走勢和結構性影響,包括某些降低風險的措施和與俄羅斯入侵烏克蘭實施的制裁有關的104億瑞士法郎,部分被有利的外匯相關變動和淨新資產所抵消。此外,WM的客户業務量為1.0萬億瑞士法郎,同比下降9%。
|
第5頁
|
投資銀行(IB)
|
|
|
|
調整後*税前收益/虧損季度(美元)
|
|
1Q22
在調整後的*基礎上,IB公佈的税前虧損為5500萬美元,低於2011年第一季度24億美元的税前收入,反映了客户活動減少、我們降低特許經營權風險時資本使用量減少的影響,以及GTS因交易和公允價值損失而產生的9700萬美元的相關虧損。報告的税前收入包括5700萬美元的房地產收益和1.74億美元的Archegos影響6。報告的總運營費用增長了6%
,調整後的*運營支出同比增長了6%,這主要是由於延遲水平正常化導致用於薪酬的現金應計項目增加,以及整個集團的技術、風險和合規支出增加所致。該部門在22年第一季度報告的淨收入為21億美元,同比下降51%,原因是21年第一季度強勁的可比性、資本市場收入大幅減少、固定收益活動正常化、與俄羅斯相關的虧損以及資本使用量的減少。
資本市場收入同比下降66%,反映出股權資本市場發行大幅放緩,這是由於與2011年第一季度更為有利的市場相比,波動性增加,以及我們槓桿融資業務的風險偏好下降。儘管出現了下降,我們的錢包份額還是環比增加了7。由於併購費用的減少,我們的諮詢收入同比下降了14%。我們固定收益銷售和交易業務的收入同比下降50%,主要反映出與強勁的21季度相比,我們證券化產品業務的狀況更加正常化,儘管業績顯著高於歷史
水平。由於我們宣佈退出,股票銷售和交易收入同比下降47%8優質服務、股票衍生品交易業績下降以及現金交易量下降。與創紀錄的21季度相比,GTS收入同比下降
,原因是與俄羅斯相關的虧損以及我們降低新興市場風險的戰略。然而,我們繼續看到股票衍生品的彈性表現,儘管由於第一季度相對強勁,考慮到整個季度的波動性增加,同比下降。
風險加權資產同比下降21%,槓桿敞口下降18%,這主要是由於Prime Services的減少。自2020年末以來,我們已減少了25億美元的分配資本,並將繼續
實現我們在2022年前釋放超過30億美元資本的雄心。
|
|
瑞士銀行(瑞士銀行)
|
|
|
|
*調整後的税前收入季度以百萬瑞士法郎為單位
|
|
1Q22
儘管薪酬支出較高,但瑞士銀行在22季度的業績具有彈性。
SB的調整*税前收入為3.85億瑞士法郎,同比下降8%,主要是由於調整後*運營費用增加,增長5%,原因是由於正常化遞延水平、對業務的目標投資以及整個集團的技術、風險和合規成本增加,用於補償的現金應計增加。與2011年第四季度相比,信貸損失撥備有所增加,與俄羅斯相關的影響為1400萬瑞士法郎。
SB報告的淨收入為11億瑞士法郎,同比增長8%;其中包括22季度房地產銷售收益8400萬瑞士法郎。該部門調整後的淨收入是穩定的。經常性佣金和手續費同比增長7%,主要是由於我們在瑞士信用卡的投資收入增加,也反映了更高的AUM水平。然而,由於投資銀行協作收入的下降,淨利息收入下降了3%,基於交易的收入下降了4%,抵消了這一影響。
SB的淨資產為60億瑞士法郎,完全由我們的機構客户業務推動。截至2012年第一季度末,該部門的AuM為5820億瑞士法郎,高於21年第一季度末的5710億瑞士法郎,高於21年第四季度末的5980億瑞士法郎。SB在22年第一季度的客户業務量達到8710億瑞士法郎,同比增長2%。淨貸款與2011年第一季度相比下降了1%,但在企業銀行和機構客户業務的推動下,與2011年第四季度相比上升了1%。
|
第7頁
|
資產管理(AM)
|
|
|
|
*調整後的税前收入季度以百萬瑞士法郎為單位
|
|
1Q22
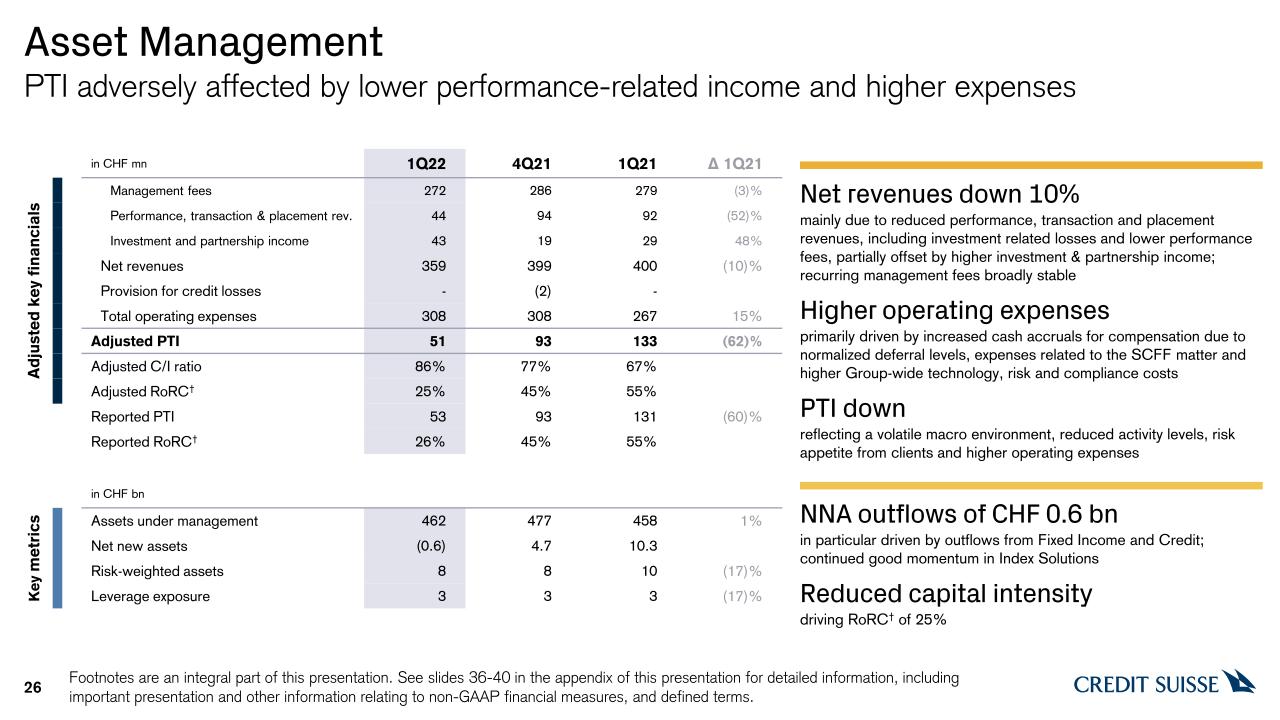
AM在22年第一季度的調整後*税前收入為5100萬瑞士法郎,同比下降62%,這是由於調整後*淨收入下降10%,以及調整後*運營費用上升15%的共同推動。經調整的*
營運開支上升,主要是由於遞延水平正常化、與SCFF事宜有關的開支,以及整個集團的技術、風險及合規成本上升,導致用於補償的現金應計項目增加。
AM報告的淨收入同比下降10%,為3.61億瑞士法郎,而調整後的*淨收入為3.59億瑞士法郎,下降10%。收入下降是由於業績、交易和配售收入下降,同比下降52%,原因是投資相關虧損加上業績和交易費用下降,以及經常性管理費下降3%,原因是投資者對被動型產品的偏好增加以及
持續的利潤率壓力。這些下降被投資和合夥企業收入增加部分抵消,增長48%,主要是由於與投資相關的收益增加。
AM本季度淨資產流出6億瑞士法郎,主要由固定收益和信貸流出推動,部分被流入Index Solutions和一家新興市場合資企業的資金抵消。AM在22年第一季度末的AUM為4620億瑞士法郎,與上一季度相比下降了3%,主要是由於不利的市場表現,但同比增長了1%。
|
第8頁
我們在可持續發展雄心和戰略方面的進展
瑞信繼續專注於其可持續發展戰略,在22年第一季度推動了跨部門和職能的活動。該行繼續強調可持續發展的重要性,將其作為其客户、股東、員工和社會價值主張的核心要素。
最近與可持續性有關的活動摘要:
◾1Q22可持續AUM為1,440億瑞士法郎9,同比增長22%,截至2022年3月31日,可持續AuM普及率達到9.3%10
◾瑞士信貸資產管理公司於3月22日加入了淨零資產管理公司的計劃,進一步支持了集團到2050年在整個供應鏈、運營和財務活動中實現淨零的承諾{br
◾榮獲2022年環境金融獎、創新債券結構獎(可持續債券)和年度可持續債券獎-主權債券獎
◾宣佈加強對氣候敏感部門融資的部門政策限制,包括油砂、深海採礦、北極石油和天然氣以及棕櫚油。有關瑞士信貸行業政策和指導方針的詳細信息,請參閲我們的外部摘要
|
◾是瑞士信貸2021年可持續發展報告的
出版物,該報告強調了本日曆年度取得的重要可持續發展進展。這包括首次針對世界經濟論壇IBC核心利益相關者改進TCFD披露和報告
資本主義指標
此外,為了支持我們的集團戰略,明確將重點放在投資促進增長上,◾於2022年4月1日成為集團的首席可持續發展官。她直接向集團首席執行官彙報,她的職責包括負責我們的全球可持續發展戰略,並與四個全球業務部門、四個地理區域和我們的公司職能合作,以實現我們現有的可持續發展和ESG雄心
|
第9頁
聯繫方式
瑞士信貸投資者關係部Kner Lakhani
Tel: +41 44 333 71 49
電子郵件:Investor.Relationship@Credit-suisse.com
Dominik von Arx,瑞士信貸企業傳播部
Tel: +41 844 33 88 44
電子郵件:Media.Relationship@Credit-suisse.com
22年第一季度財務報告和演示文稿幻燈片
從今天中歐標準時間06:45起可從以下地址下載:
Www.Credit-suisse.com/Results
公佈22季度業績
2022年4月27日星期三
|
事件
|
分析師電話會議
|
媒體就2012年第一季度業績召開電話會議
|
|
時間
|
歐洲中部時間08:15(蘇黎世)
英國夏令時07:15(倫敦)
美國東部時間02:15(紐約)
|
中歐標準時間10:30(蘇黎世)
英國夏令時09:30(倫敦)
美國東部時間04:30(紐約)
|
|
語言
|
英語
|
英語
|
|
訪問
|
Switzerland +41 44 580 48 67
UK +44 (0) 203 057 6528
USA +1 866 276 8933
參考資料:
瑞士信貸分析師和投資者致電
會議ID:
8392879
請在開場前10分鐘撥打電話
這是一次通話。撥入時請輸入
密碼/會議ID並離開
您的名字、姓氏和公司名稱
在鈴聲之後。你將會加入
自動加入會議。
網絡直播鏈接請點擊此處。
|
Switzerland +41 44 580 48 67
UK +44 (0) 203 057 6528
USA +1 866 276 8933
參考資料:
瑞士信貸媒體電話會議
會議ID:
9879055
請在開場前10分鐘撥打電話
這是一次通話。撥入時請輸入
密碼/會議ID並離開
您的名字、姓氏和公司名稱
在鈴聲之後。你將會加入
自動加入會議。
網絡直播鏈接請點擊此處。
|
|
問答環節
|
演講結束後,您將擁有
有機會請演講者
問題
|
演講結束後,您將擁有
有機會請演講者
問題
|
|
回放
|
可在網絡直播鏈接上重播。
|
可在網絡直播鏈接上重播。
|
第10頁
縮寫
AM-資產管理;亞太地區;澳元-澳元;AUM-管理資產;BCBS-巴塞爾銀行監管委員會;BIS-國際清算銀行;10億美元;CECL
-當前預期信用損失;CET1-普通股一級股權;瑞士法郎-瑞士法郎;CSAM-瑞士信貸資產管理;EMEA-歐洲、中東和非洲;ESG-環境、社會和治理;FINMA-瑞士金融市場監管機構FINMA;GAAP-公認會計原則;GTS-全球交易解決方案;HRH-殿下;IB-投資銀行;百萬;併購-合併和收購;NNA-淨新資產;
問答-問答;RWA-風險加權資產;SB-瑞士銀行;供應鏈金融基金;美國證券交易委員會-美國證券交易委員會;TCFD-氣候相關財務披露特別工作組;SCFF-供應鏈金融基金;TRN-萬億;(U)HNW-(超)高淨值;英國;美國-美國;美元-美元;世界經濟論壇IBC-世界經濟論壇國際商業理事會;WM-財富管理。
重要信息
本文檔包含瑞信認為媒體專業人士特別感興趣的22季度收益發布全文和22季度業績演示幻燈片中的精選信息。
同時分發的完整的22季度收益新聞稿和22季度業績演示幻燈片包含有關我們報告季度的業績和運營的更全面信息,以及有關我們的報告方法和這些文檔中使用的一些術語的重要信息。本文檔中未包含完整的第22季度發佈幻燈片和第1季度業績演示文稿幻燈片。
瑞士信貸尚未完成其22季度財務報告,瑞士信貸的獨立註冊會計師事務所尚未完成對該期間簡明綜合財務報表(未經審計)的審查。因此,本文件所載財務信息有待季末程序的完成,這可能會導致該信息發生變化。
我們在2021-2022年從投資銀行釋放超過30億美元資本的雄心,以及在2021-2024年向財富管理投資約30億瑞士法郎資本的雄心是基於平均13.5%的風險加權資產和4.25%的槓桿敞口。
我們的成本節約雄心是使用2021年不變的外匯匯率調整後的運營費用來衡量的,從2022-2024年逐步增加,不包括退出業務的成本削減。
我們可能無法實現我們的戰略舉措的所有預期好處。我們無法控制的因素,包括但不限於市場和經濟狀況(包括
宏觀經濟和其他挑戰和不確定性,例如,俄羅斯入侵烏克蘭造成的挑戰和不確定性)、法律、規則或法規的變化以及我們在公開申報文件中討論的其他挑戰,可能會限制我們實現這些計劃的部分或全部預期好處的能力。
特別是,“估計”、“説明性”、“雄心”、“目標”、“展望”、“目標”、“承諾”和“抱負”等術語不應被視為目標或預測,也不應被視為關鍵業績指標。所有此類估計、説明、抱負、目標、展望、目標、承諾和抱負都受到大量固有風險、假設和不確定性的影響,其中許多完全不在我們的控制範圍之內。這些風險、假設和不確定性包括但不限於一般市場狀況、市場波動、通脹加劇、利率波動和水平、全球和地區經濟狀況、俄羅斯入侵烏克蘭帶來的挑戰和不確定性、政治不確定性、税收政策的變化、科學或技術發展、不斷髮展的可持續性戰略、我們業務性質或範圍的變化、碳市場的變化、監管變化、由於上述任何因素以及其他因素導致的客户活動水平的變化。因此,這些陳述僅説明截止日期,並不是對未來業績的保證,不應出於任何目的加以依賴。我們不打算更新這些估計、插圖、抱負、目標、展望、目標、承諾、願望或任何其他前瞻性陳述。出於這些原因,我們提醒您不要過度依賴任何前瞻性陳述。
在準備本文件時,管理層作出了影響所列數字的估計和假設。實際結果可能會有所不同。年化數字
|
不考慮經營業績、季節性和其他因素的變化,可能不代表實際的全年業績。本文件中的所有數字也可能進行四捨五入調整。自撰寫之日起,所有意見和觀點均構成善意判斷,而不考慮讀者可能收到或獲取信息的日期。此信息隨時可能更改,恕不另行通知,我們不打算更新此信息。
有形股本回報率是一項非公認會計準則財務指標,計算方法為股東應佔年度淨收入除以平均有形股東權益。有形
股東權益是一種非公認會計準則的財務衡量指標,其計算方法是從我們的資產負債表中顯示的股東權益總額中減去商譽和其他無形資產。管理層認為,有形股本回報率是有意義的,因為它是行業分析師和投資者用來評估估值和資本充足率的指標。截至2011年第一季度末,有形股東權益不包括46.44億瑞士法郎的商譽和2.39億瑞士法郎的其他無形資產,不包括我們資產負債表中列示的445.9億瑞士法郎的股東權益總額。截至2011年第四季度末,有形股東權益不包括商譽29.17億瑞士法郎和其他無形資產2.76億瑞士法郎
,如資產負債表所示,股東權益總額為439.54億瑞士法郎。截至2012年第一季度末,有形股東權益不包括商譽29.31億瑞士法郎和其他無形資產3.07億瑞士法郎,不包括我們資產負債表所列股東權益總額444.42億瑞士法郎。
監管資本按RWA的13.5%和槓桿敞口和監管資本回報率的4.25%的平均值計算,這是一項非GAAP財務指標,使用
税後收入/(虧損)計算,並假設2020年前的税率為30%,2020年後為25%。對於投資銀行來説,監管資本的回報率是基於美元計價的數字。監管資本回報率
不包括在我們報告的業績中的某些項目是使用不包括此類項目的結果計算的,採用相同的方法。不包括我們報告結果中的某些項目的調整後監管資本回報率
使用不包括此類項目的結果計算,採用相同的方法。
瑞士信貸受制於在瑞士實施的巴塞爾框架,以及瑞士針對具有系統重要性的銀行的立法和法規,其中包括資本、流動性、槓桿和大額風險敞口要求以及旨在在出現破產威脅時維持具有系統相關性的職能的緊急計劃的規則。瑞士信貸採用了國際清算銀行(BIS)槓桿率框架,該框架由巴塞爾銀行監管委員會(BCBS)發佈,由瑞士金融市場監管局(FINMA)在瑞士實施。
除非另有説明,本文件中的所有CET1比率、一級槓桿率、風險加權資產和槓桿敞口數字均為截至各自期間結束時的數字,並在2019年之前的期間內以“透視”為基礎。
除非另有説明,槓桿敞口是以國際清算銀行槓桿率框架為基礎,由期末資產負債表資產和規定的監管調整組成。第1級槓桿率和CET1槓桿率分別為BIS一級資本和CET1資本除以期末槓桿敞口。
客户業務量包括管理資產、託管資產(包括託管資產和商業資產)和淨貸款。
投資者和其他人應該注意到,我們通過新聞稿、美國證券交易委員會和瑞士臨時備案文件、我們的網站和公共電話會議以及網絡廣播向投資公眾宣佈重要的公司信息(包括季度收益發布和財務報告以及我們的年度可持續發展報告)。我們還經常使用我們的推特帳户@Creditsuisse(https://twitter.com/creditsuisse),我們的LinkedIn帳户
(https://www.linkedin.com/company/credit-suisse/),我們的Instagram帳户(https://www.instagram.com/creditsuisse_careers/和https://www.instagram.com/creditsuisse_ch/),我們的Facebook帳户(https://www.facebook.com/creditsuisse/)和
其他社交媒體渠道)作為披露公共信息的額外手段,包括從我們的公開披露中摘錄關鍵信息。我們可能會通過我們的某些地區帳户分享或轉發此類消息,包括通過推特@csschweiz(https://twitter.com/csschweiz)和@cSAPAC(https://twitter.com/csapac).投資者和其他人應該謹慎地在披露這些簡短信息的背景下考慮這些信息
|
第11頁
摘錄。我們在這些社交媒體帳户上發佈的信息不是本文檔的一部分。
本文檔中引用的信息,無論是通過網站鏈接還是其他方式,都不包含在本文檔中。
本文件中的某些材料由瑞士信貸根據公開信息、內部開發的數據和其他被認為可靠的第三方來源編制而成。瑞士信貸並未尋求
|
獨立核實從公共和第三方來源獲得的信息,不對此類信息的準確性、完整性、合理性或可靠性作出任何陳述或保證。
在各種表格中,使用“-”表示沒有意義或不適用。
本文檔的英文版本為控制性版本。
|
* Refers to results excluding certain items included in our reported
results. These are non-GAAP financial measures. For a reconciliation to the most directly comparable US GAAP measures, see the Appendix of this Media Release
1 With the exception of Index Access and APAC Delta One
2 AUD / USD exchange rate of 0.724 used for purposes of calculating GFG Australian amounts
3 Net credit exposure is net of risk mitigation, specific allowances for credit losses, specific provisions for off-balance sheet credit exposures and valuation adjustments
4 Net credit exposure is net of risk mitigation, of specific allowances for credit
losses, specific provisions for off-balance sheet credit exposures and
valuation adjustments
|
5 1Q22 mark-to-market losses of CHF (34) mn (net of CHF 7 mn of hedges). 1Q21 included mark-to-market losses
of CHF (3) mn (net of CHF 4 mn of hedges)
6 Archegos impact includes revenues of USD 19 mn, release of provisions of credit losses of USD (167) mn and expenses of USD 12 mn
7 Based on Dealogic as of March 31, 2022 (Global)
8 With the exception of Index Access and APAC Delta One
9 Refers to Credit Suisse’s assets managed according to the Credit Suisse Sustainable Investment Framework (Sustainable AuM). This includes only AuM
balances from managed solutions that to date have been mapped to a sustainability rating of 2 and higher, based on the Framework scale (0-5). The increase vs. 1Q21 reflects a combination of further product classifications, onboarding of new
sustainable funds and net sales partially offset by market and FX movements
10 Percentage share of Sustainable AuM versus Total AuM
|
Appendix
| Key metrics |
|
|
in / end of |
|
% change |
|
|
|
1Q22 |
|
4Q21 |
|
1Q21 |
|
QoQ |
|
YoY |
|
| Credit Suisse Group results (CHF million) |
| Net revenues |
|
4,412 |
|
4,582 |
|
7,574 |
|
(4) |
|
(42) |
|
| Provision for credit losses |
|
(110) |
|
(20) |
|
4,394 |
|
450 |
|
– |
|
| Compensation and benefits |
|
2,458 |
|
2,145 |
|
2,207 |
|
15 |
|
11 |
|
| General and administrative expenses |
|
2,148 |
|
2,182 |
|
1,376 |
|
(2) |
|
56 |
|
| Commission expenses |
|
298 |
|
283 |
|
329 |
|
5 |
|
(9) |
|
| Restructuring expenses |
|
46 |
|
33 |
|
25 |
|
39 |
|
84 |
|
| Total other operating expenses |
|
2,492 |
|
4,121 |
|
1,730 |
|
(40) |
|
44 |
|
| Total operating expenses |
|
4,950 |
|
6,266 |
|
3,937 |
|
(21) |
|
26 |
|
| Loss before taxes |
|
(428) |
|
(1,664) |
|
(757) |
|
(74) |
|
(43) |
|
| Loss attributable to shareholders |
|
(273) |
|
(2,085) |
|
(252) |
|
(87) |
|
8 |
|
| Balance sheet statistics (CHF million) |
| Total assets |
|
739,554 |
|
755,833 |
|
865,576 |
|
(2) |
|
(15) |
|
| Risk-weighted assets |
|
273,043 |
|
267,787 |
|
302,869 |
|
2 |
|
(10) |
|
| Leverage exposure |
|
878,023 |
|
889,137 |
|
981,979 |
|
(1) |
|
(11) |
|
| Assets under management and net new assets (CHF billion) |
| Assets under management |
|
1,554.9 |
|
1,614.0 |
|
1,596.0 |
|
(3.7) |
|
(2.6) |
|
| Net new assets |
|
7.9 |
|
1.6 |
|
28.4 |
|
393.8 |
|
(72.2) |
|
| Basel III regulatory capital and leverage statistics (%) |
| CET1 ratio |
|
13.8 |
|
14.4 |
|
12.2 |
|
– |
|
– |
|
| CET1 leverage ratio |
|
4.3 |
|
4.3 |
|
3.8 |
|
– |
|
– |
|
| Tier 1 leverage ratio |
|
6.1 |
|
6.1 |
|
5.4 |
|
– |
|
– |
|
Results excluding certain items included in our reported results are non-GAAP financial
measures. Following the reorganization implemented at the beginning of 2022, we have
amended the presentation of our adjusted results. Management believes that such results
provide a useful presentation of our operating results for purposes of assessing our
Group and divisional performance consistently over time, on a basis that excludes
items that management does not consider representative of our underlying performance.
Provided below is a reconciliation to the most directly comparable US GAAP measures.
| Reconciliation of adjustment items |
|
|
Group |
|
| in |
|
1Q22 |
|
4Q21 |
|
1Q21 |
|
| Results (CHF million) |
| Net revenues |
|
4,412 |
|
4,582 |
|
7,574 |
|
| Real estate (gains)/losses |
|
(164) |
|
(224) |
|
0 |
|
| (Gains)/losses on business sales |
|
3 |
|
(13) |
|
0 |
|
| (Gain)/loss on equity investment in Allfunds Group |
|
353 |
|
(31) |
|
(144) |
|
| (Gain)/loss on equity investment in SIX Group AG |
|
(5) |
|
70 |
|
0 |
|
| Archegos |
|
(17) |
|
0 |
|
0 |
|
| Adjusted net revenues |
|
4,582 |
|
4,384 |
|
7,430 |
|
| Provision for credit losses |
|
(110) |
|
(20) |
|
4,394 |
|
| Archegos |
|
155 |
|
5 |
|
(4,430) |
|
| Adjusted provision for credit losses |
|
45 |
|
(15) |
|
(36) |
|
| Total operating expenses |
|
4,950 |
|
6,266 |
|
3,937 |
|
| Goodwill impairment |
|
– |
|
(1,623) |
|
– |
|
| Restructuring expenses |
|
(46) |
|
(33) |
|
(25) |
|
| Major litigation provisions |
|
(653) |
|
(514) |
|
(4) |
|
| Expenses related to real estate disposals |
|
(3) |
|
(11) |
|
(38) |
|
| Archegos |
|
(11) |
|
(14) |
|
0 |
|
| Adjusted total operating expenses |
|
4,237 |
|
4,071 |
|
3,870 |
|
| Income/(loss) before taxes |
|
(428) |
|
(1,664) |
|
(757) |
|
| Adjusted income before taxes |
|
300 |
|
328 |
|
3,596 |
|
| Adjusted economic profit |
|
(786) |
|
(842) |
|
1,726 |
|
| Adjusted return on tangible equity (%) |
|
4.3 |
|
(1.0) |
|
34.4 |
|
| Wealth Management |
|
|
in / end of |
|
% change |
|
|
|
1Q22 |
|
4Q21 |
|
1Q21 |
|
QoQ |
|
YoY |
|
| Results (CHF million) |
| Net revenues |
|
1,177 |
|
1,377 |
|
2,085 |
|
(15) |
|
(44) |
|
| Provision for credit losses |
|
24 |
|
(7) |
|
13 |
|
– |
|
85 |
|
| Total operating expenses |
|
1,510 |
|
1,227 |
|
1,094 |
|
23 |
|
38 |
|
| Income/(loss) before taxes |
|
(357) |
|
157 |
|
978 |
|
– |
|
– |
|
| Metrics |
| Economic profit (CHF million) |
|
(448) |
|
(68) |
|
544 |
|
– |
|
– |
|
| Cost/income ratio (%) |
|
128.3 |
|
89.1 |
|
52.5 |
|
– |
|
– |
|
| Assets under management (CHF billion) |
|
707.0 |
|
742.6 |
|
757.0 |
|
(4.8) |
|
(6.6) |
|
| Net new assets (CHF billion) |
|
4.8 |
|
(2.9) |
|
14.5 |
|
– |
|
– |
|
| Gross margin (annualized) (bp) |
|
65 |
|
73 |
|
114 |
|
– |
|
– |
|
| Net margin (annualized) (bp) |
|
(20) |
|
8 |
|
54 |
|
– |
|
– |
|
| Reconciliation of adjustment items |
|
|
Wealth Management |
|
| in |
|
1Q22 |
|
4Q21 |
|
1Q21 |
|
| Results (CHF million) |
| Net revenues |
|
1,177 |
|
1,377 |
|
2,085 |
|
| Real estate (gains)/losses |
|
(25) |
1 |
(19) |
|
0 |
|
| (Gains)/losses on business sales |
|
3 |
|
(17) |
|
0 |
|
| (Gain)/loss on equity investment in Allfunds Group |
|
353 |
|
(31) |
|
(144) |
|
| (Gain)/loss on equity investment in SIX Group AG |
|
(2) |
|
35 |
|
0 |
|
| Adjusted net revenues |
|
1,506 |
|
1,345 |
|
1,941 |
|
| Provision for credit losses |
|
24 |
|
(7) |
|
13 |
|
| Total operating expenses |
|
1,510 |
|
1,227 |
|
1,094 |
|
| Restructuring expenses |
|
(10) |
|
(7) |
|
(3) |
|
| Major litigation provisions |
|
(230) |
|
(3) |
|
11 |
|
| Expenses related to real estate disposals |
|
0 |
|
(3) |
|
(4) |
|
| Adjusted total operating expenses |
|
1,270 |
|
1,214 |
|
1,098 |
|
| Income/(loss) before taxes |
|
(357) |
|
157 |
|
978 |
|
| Adjusted income before taxes |
|
212 |
|
138 |
|
830 |
|
| Adjusted economic profit |
|
(21) |
|
(82) |
|
433 |
|
| Adjusted return on regulatory capital (%) |
|
7.1 |
|
4.5 |
|
26.3 |
|
1
Of which CHF 20 million is reflected in other revenues and CHF 5 million is reflected
in transaction- and performance-based revenues.
|
| Investment Bank |
|
|
in / end of |
|
% change |
|
|
|
1Q22 |
|
4Q21 |
|
1Q21 |
|
QoQ |
|
YoY |
|
| Results (CHF million) |
| Net revenues |
|
1,938 |
|
1,666 |
|
3,884 |
|
16 |
|
(50) |
|
| Provision for credit losses |
|
(156) |
|
(7) |
|
4,365 |
|
– |
|
– |
|
| Total operating expenses |
|
1,970 |
|
3,661 |
|
1,829 |
|
(46) |
|
8 |
|
| Income/(loss) before taxes |
|
124 |
|
(1,988) |
|
(2,310) |
|
– |
|
– |
|
| Metrics |
| Economic profit (CHF million) |
|
(297) |
|
(1,897) |
|
(2,194) |
|
(84) |
|
(86) |
|
| Cost/income ratio (%) |
|
101.7 |
|
219.7 |
|
47.1 |
|
– |
|
– |
|
| Results (USD million) |
| Net revenues |
|
2,096 |
|
1,820 |
|
4,263 |
|
15 |
|
(51) |
|
| Provision for credit losses |
|
(169) |
|
(8) |
|
4,635 |
|
– |
|
– |
|
| Total operating expenses |
|
2,131 |
|
4,002 |
|
2,015 |
|
(47) |
|
6 |
|
| Income/(loss) before taxes |
|
134 |
|
(2,174) |
|
(2,387) |
|
– |
|
– |
|
| Net revenue detail |
| in |
|
1Q22 |
|
4Q21 |
|
1Q21 |
|
| Net revenue detail (USD million) |
| Fixed income sales and trading |
|
802 |
|
504 |
|
1,616 |
|
| Equity sales and trading |
|
545 |
|
403 |
|
1,030 |
|
| Capital markets |
|
466 |
|
585 |
|
1,361 |
|
| Advisory and other fees |
|
221 |
|
331 |
|
257 |
|
| Other revenues |
|
62 |
|
(3) |
|
(1) |
|
| Net revenues |
|
2,096 |
|
1,820 |
|
4,263 |
|
| Reconciliation of adjustment items |
|
|
Investment Bank |
|
| in |
|
1Q22 |
|
4Q21 |
|
1Q21 |
|
| Results (CHF million) |
| Net revenues |
|
1,938 |
|
1,666 |
|
3,884 |
|
| Real estate (gains)/losses |
|
(53) |
|
0 |
|
0 |
|
| Archegos |
|
(17) |
|
0 |
|
0 |
|
| Adjusted net revenues |
|
1,868 |
|
1,666 |
|
3,884 |
|
| Provision for credit losses |
|
(156) |
|
(7) |
|
4,365 |
|
| Archegos |
|
155 |
|
5 |
|
(4,430) |
|
| Adjusted provision for credit losses |
|
(1) |
|
(2) |
|
(65) |
|
| Total operating expenses |
|
1,970 |
|
3,661 |
|
1,829 |
|
| Goodwill impairment |
|
0 |
|
(1,623) |
|
0 |
|
| Restructuring expenses |
|
(36) |
|
(25) |
|
(17) |
|
| Major litigation provisions |
|
0 |
|
(149) |
|
0 |
|
| Expenses related to real estate disposals |
|
(3) |
|
(8) |
|
(33) |
|
| Archegos |
|
(11) |
|
(19) |
|
0 |
|
| Adjusted total operating expenses |
|
1,920 |
|
1,837 |
|
1,779 |
|
| Income/(loss) before taxes |
|
124 |
|
(1,988) |
|
(2,310) |
|
| Adjusted income/(loss) before taxes |
|
(51) |
|
(169) |
|
2,170 |
|
| Adjusted economic profit |
|
(428) |
|
(533) |
|
1,165 |
|
| Adjusted return on regulatory capital (%) |
|
(1.2) |
|
(3.8) |
|
42.2 |
|
| Reconciliation of adjustment items |
|
|
Investment Bank |
|
| in |
|
1Q22 |
|
4Q21 |
|
1Q21 |
|
| Results (USD million) |
| Net revenues |
|
2,096 |
|
1,820 |
|
4,263 |
|
| Real estate (gains)/losses |
|
(57) |
|
0 |
|
0 |
|
| Archegos |
|
(19) |
|
0 |
|
0 |
|
| Adjusted net revenues |
|
2,020 |
|
1,820 |
|
4,263 |
|
| Provision for credit losses |
|
(169) |
|
(8) |
|
4,635 |
|
| Archegos |
|
167 |
|
5 |
|
(4,707) |
|
| Adjusted provision for credit losses |
|
(2) |
|
(3) |
|
(72) |
|
| Total operating expenses |
|
2,131 |
|
4,002 |
|
2,015 |
|
| Goodwill impairment |
|
– |
|
(1,775) |
|
– |
|
| Restructuring expenses |
|
(39) |
|
(27) |
|
(19) |
|
| Major litigation provisions |
|
0 |
|
(163) |
|
– |
|
| Expenses related to real estate disposals |
|
(3) |
|
(9) |
|
(35) |
|
| Archegos |
|
(12) |
|
(21) |
|
0 |
|
| Adjusted total operating expenses |
|
2,077 |
|
2,007 |
|
1,961 |
|
| Income/(loss) before taxes |
|
134 |
|
(2,174) |
|
(2,387) |
|
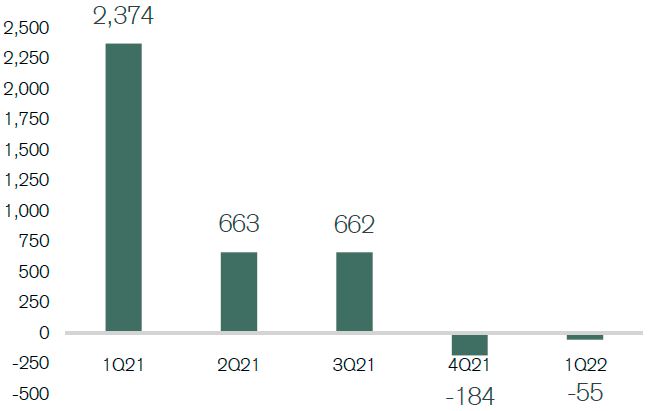
| Adjusted income/(loss) before taxes |
|
(55) |
|
(184) |
|
2,374 |
|
| Adjusted economic profit |
|
(466) |
|
(579) |
|
1,274 |
|
| Adjusted return on regulatory capital (%) |
|
(1.2) |
|
(3.8) |
|
42.2 |
|
| Swiss Bank |
|
|
in / end of |
|
% change |
|
|
|
1Q22 |
|
4Q21 |
|
1Q21 |
|
QoQ |
|
YoY |
|
| Results (CHF million) |
| Net revenues |
|
1,109 |
|
1,209 |
|
1,031 |
|
(8) |
|
8 |
|
| Provision for credit losses |
|
23 |
|
(4) |
|
26 |
|
– |
|
(12) |
|
| Total operating expenses |
|
615 |
|
606 |
|
593 |
|
1 |
|
4 |
|
| Income before taxes |
|
471 |
|
607 |
|
412 |
|
(22) |
|
14 |
|
| Metrics |
| Economic profit (CHF million) |
|
154 |
|
256 |
|
105 |
|
(40) |
|
47 |
|
| Cost/income ratio (%) |
|
55.5 |
|
50.1 |
|
57.5 |
|
– |
|
– |
|
| Assets under management (CHF billion) |
|
582.5 |
|
597.9 |
|
571.2 |
|
(2.6) |
|
2.0 |
|
| Net new assets (CHF billion) |
|
6.0 |
|
1.0 |
|
3.8 |
|
– |
|
– |
|
| Gross margin (annualized) (bp) |
|
75 |
|
82 |
|
74 |
|
– |
|
– |
|
| Net margin (annualized) (bp) |
|
32 |
|
41 |
|
29 |
|
– |
|
– |
|
| Reconciliation of adjustment items |
|
|
Swiss Bank |
|
| in |
|
1Q22 |
|
4Q21 |
|
1Q21 |
|
| Results (CHF million) |
| Net revenues |
|
1,109 |
|
1,209 |
|
1,031 |
|
| Real estate (gains)/losses |
|
(84) |
|
(205) |
|
0 |
|
| (Gain)/loss on equity investment in SIX Group AG |
|
(3) |
|
35 |
|
0 |
|
| Adjusted net revenues |
|
1,022 |
|
1,039 |
|
1,031 |
|
| Provision for credit losses |
|
23 |
|
(4) |
|
26 |
|
| Total operating expenses |
|
615 |
|
606 |
|
593 |
|
| Restructuring expenses |
|
(1) |
|
(1) |
|
(7) |
|
| Adjusted total operating expenses |
|
614 |
|
605 |
|
586 |
|
| Income before taxes |
|
471 |
|
607 |
|
412 |
|
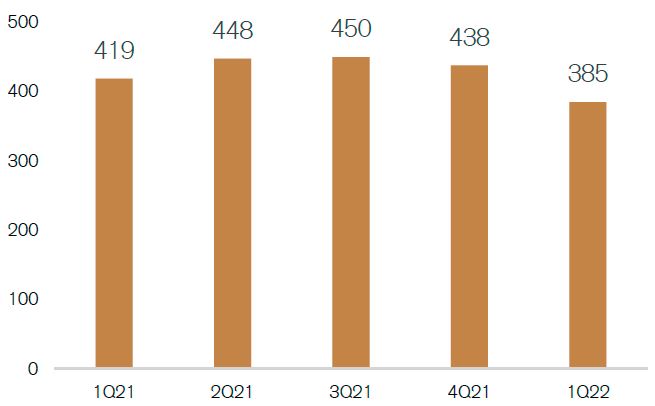
| Adjusted income before taxes |
|
385 |
|
438 |
|
419 |
|
| Adjusted economic profit |
|
90 |
|
129 |
|
111 |
|
| Adjusted return on regulatory capital (%) |
|
11.6 |
|
13.2 |
|
12.4 |
|
| Asset Management |
|
|
in / end of |
|
% change |
|
|
|
1Q22 |
|
4Q21 |
|
1Q21 |
|
QoQ |
|
YoY |
|
| Results (CHF million) |
| Net revenues |
|
361 |
|
399 |
|
400 |
|
(10) |
|
(10) |
|
| Provision for credit losses |
|
0 |
|
(2) |
|
0 |
|
100 |
|
– |
|
| Total operating expenses |
|
308 |
|
308 |
|
269 |
|
0 |
|
14 |
|
| Income before taxes |
|
53 |
|
93 |
|
131 |
|
(43) |
|
(60) |
|
| Metrics |
| Economic profit (CHF million) |
|
28 |
|
57 |
|
84 |
|
(51) |
|
(67) |
|
| Cost/income ratio (%) |
|
85.3 |
|
77.2 |
|
67.3 |
|
– |
|
– |
|
| Reconciliation of adjustment items |
|
|
Asset Management |
|
| in |
|
1Q22 |
|
4Q21 |
|
1Q21 |
|
| Results (CHF million) |
| Net revenues |
|
361 |
|
399 |
|
400 |
|
| Real estate (gains)/losses |
|
(2) |
|
0 |
|
0 |
|
| Adjusted net revenues |
|
359 |
|
399 |
|
400 |
|
| Provision for credit losses |
|
0 |
|
(2) |
|
0 |
|
| Total operating expenses |
|
308 |
|
308 |
|
269 |
|
| Restructuring expenses |
|
0 |
|
0 |
|
(1) |
|
| Expenses related to real estate disposals |
|
0 |
|
0 |
|
(1) |
|
| Adjusted total operating expenses |
|
308 |
|
308 |
|
267 |
|
| Income before taxes |
|
53 |
|
93 |
|
131 |
|
| Adjusted income before taxes |
|
51 |
|
93 |
|
133 |
|
| Adjusted economic profit |
|
27 |
|
57 |
|
86 |
|
| Adjusted return on regulatory capital (%) |
|
25.3 |
|
44.7 |
|
55.2 |
|
Cautionary statement regarding forward-looking information
This document contains statements that constitute forward-looking statements. In addition,
in the future we, and others on our behalf, may make statements that constitute forward-looking
statements. Such forward-looking statements may include, without limitation, statements
relating to the following:
■ our plans, targets or goals;
■ our future economic performance or prospects;
■ the potential effect on our future performance of certain contingencies; and
■ assumptions underlying any such statements.
Words such as “believes,” “anticipates,” “expects,” “intends” and “plans” and similar
expressions are intended to identify forward-looking statements but are not the exclusive
means of identifying such statements. We do not intend to update these forward-looking
statements.
By their very nature, forward-looking statements involve inherent risks and uncertainties,
both general and specific, and risks exist that predictions, forecasts, projections
and other outcomes described or implied in forward-looking statements will not be
achieved. We caution you that a number of important factors could cause results to
differ materially from the plans, targets, goals, expectations, estimates and intentions
expressed in such forward-looking statements and that the ongoing COVID-19 pandemic
creates significantly greater uncertainty about forward-looking statements in addition
to the factors that generally affect our business. These factors include:
■ the ability to maintain sufficient liquidity and access capital markets;
■ market volatility, increases in inflation and interest rate fluctuations or developments
affecting interest rate levels;
■ the ongoing significant negative consequences of the Archegos and supply chain finance
funds matters and our ability to successfully resolve these matters;
■ our ability to improve our risk management procedures and policies and hedging strategies;
■ the strength of the global economy in general and the strength of the economies of
the countries in which we conduct our operations, in particular the risk of negative
impacts of COVID-19 on the global economy and financial markets and the risk of continued
slow economic recovery or downturn in the EU, the US or other developed countries
or in emerging markets in 2022 and beyond;
■ the emergence of widespread health emergencies, infectious diseases or pandemics,
such as COVID-19, and the actions that may be taken by governmental authorities to
contain the outbreak or to counter its impact;
■ potential risks and uncertainties relating to the severity of impacts from COVID-19
and the duration of the pandemic, including potential material adverse effects on
our business, financial condition and results of operations;
■ the direct and indirect impacts of deterioration or slow recovery in residential and
commercial real estate markets;
■ adverse rating actions by credit rating agencies in respect of us, sovereign issuers,
structured credit products or other credit-related exposures;
■ the ability to achieve our strategic goals, including those related to our targets,
ambitions and financial goals;
■ the ability of counterparties to meet their obligations to us and the adequacy of
our allowance for credit losses;
■ the effects of, and changes in, fiscal, monetary, exchange rate, trade and tax policies;
■ the effects of currency fluctuations, including the related impact on our business,
financial condition and results of operations due to moves in foreign exchange rates;
■ geopolitical and diplomatic tensions, instabilities and conflicts, including war,
civil unrest, terrorist activity, sanctions or other geopolitical events or escalations
of hostilities;
■ political, social and environmental developments, including climate change;
■ the ability to appropriately address social, environmental and sustainability concerns
that may arise from our business activities;
■ the effects of, and the uncertainty arising from, the UK’s withdrawal from the EU;
■ the possibility of foreign exchange controls, expropriation, nationalization or confiscation
of assets in countries in which we conduct our operations;
■ operational factors such as systems failure, human error, or the failure to implement
procedures properly;
■ the risk of cyber attacks, information or security breaches or technology failures
on our reputation, business or operations, the risk of which is increased while large
portions of our employees work remotely;
■ the adverse resolution of litigation, regulatory proceedings and other contingencies;
■ actions taken by regulators with respect to our business and practices and possible
resulting changes to our business organization, practices and policies in countries
in which we conduct our operations;
■ the effects of changes in laws, regulations or accounting or tax standards, policies
or practices in countries in which we conduct our operations;
■ the discontinuation of LIBOR and other interbank offered rates and the transition
to alternative reference rates;
■ the potential effects of changes in our legal entity structure;
■ competition or changes in our competitive position in geographic and business areas
in which we conduct our operations;
■ the ability to retain and recruit qualified personnel;
■ the ability to protect our reputation and promote our brand;
■ the ability to increase market share and control expenses;
■ technological changes instituted by us, our counterparties or competitors;
■ the timely development and acceptance of our new products and services and the perceived
overall value of these products and services by users;
■ acquisitions, including the ability to integrate acquired businesses successfully,
and divestitures, including the ability to sell non-core assets; and
■ other unforeseen or unexpected events and our success at managing these and the risks
involved in the foregoing.
We caution you that the foregoing list of important factors is not exclusive. When
evaluating forward-looking statements, you should carefully consider the foregoing
factors and other uncertainties and events, including the information set forth in
“Risk factors” in I – Information on the company in our Annual Report 2021.
1Q22 Results Analyst and Investor Call Thomas Gottstein Chief Executive OfficerDavid Mathers Chief
Financial OfficerApril 27, 2022
Disclaimer (1/2) 2 Credit Suisse has not finalized its 1Q22 Financial Report and Credit Suisse’s
independent registered public accounting firm has not completed its review of the condensed consolidated financial statements (unaudited) for the period. Accordingly, the financial information contained in this presentation is subject to
completion of quarter-end procedures, which may result in changes to that information.This material does not purport to contain all of the information that you may wish to consider. This material is not to be relied upon as such or used in
substitution for the exercise of independent judgment. Cautionary statement regarding forward-looking statements This presentation contains forward-looking statements that involve inherent risks and uncertainties, and we might not be able to
achieve the predictions, forecasts, projections and other outcomes we describe or imply in forward-looking statements. A number of important factors could cause results to differ materially from the plans, targets, goals, expectations,
estimates and intentions we express in these forward-looking statements, including those we identify in "Risk factors” in our Annual Report on Form 20-F for the fiscal year ended December 31, 2021 and in the “Cautionary statement regarding
forward-looking information" in our 1Q22 Earnings Release published on April 27, 2022 and filed with the US Securities and Exchange Commission, and in other public filings and press releases. We do not intend to update these forward-looking
statements. In particular, the terms “Estimate”, “Illustrative”, “Ambition”, “Objective”, “Outlook”, “Goal”, “Commitment” and “Aspiration” are not intended to be viewed as targets or projections, nor are they considered to be Key Performance
Indicators. All such estimates, illustrations, ambitions, objectives, outlooks, goals, commitments and aspirations are subject to a large number of inherent risks, assumptions and uncertainties, many of which are completely outside of our
control. These risks, assumptions and uncertainties include, but are not limited to, general market conditions, market volatility, increased inflation, interest rate volatility and levels, global and regional economic conditions, challenges and
uncertainties resulting from Russia’s invasion of Ukraine, political uncertainty, changes in tax policies, scientific or technological developments, evolving sustainability strategies, changes in the nature or scope of our operations, changes
in carbon markets, regulatory changes, changes in levels of client activity as a result of any of the foregoing and other factors. Accordingly, these statements, which speak only as of the date made, are not guarantees of future performance and
should not be relied on for any purpose. We do not intend to update these estimates, illustrations, ambitions, objectives, outlooks, goals, commitments, aspirations or any other forward-looking statements. For these reasons, we caution you not
to place undue reliance upon any forward-looking statements. We may not achieve the benefits of our strategic initiativesWe may not achieve all of the expected benefits of our strategic initiatives. Factors beyond our control, including but not
limited to the market and economic conditions (including macroeconomic and other challenges and uncertainties, for example, resulting from Russia’s invasion of Ukraine), changes in laws, rules or regulations and other challenges discussed in
our public filings, could limit our ability to achieve some or all of the expected benefits of these initiatives. Estimates and assumptionsIn preparing this presentation, management has made estimates and assumptions that affect the numbers
presented. Actual results may differ. Annualized numbers do not take into account variations in operating results, seasonality and other factors and may not be indicative of actual, full-year results. Figures throughout this presentation may
also be subject to rounding adjustments. All opinions and views constitute good faith judgments as of the date of writing without regard to the date on which the reader may receive or access the information. This information is subject to
change at any time without notice and we do not intend to update this information.Cautionary statements relating to interim financial informationThis presentation contains certain unaudited interim financial information for the second quarter
of 2022. This information has been derived from management accounts, is preliminary in nature, does not reflect the complete results of the second quarter of 2022 and is subject to change, including as a result of any normal quarterly
adjustments in relation to the financial statements for the second quarter of 2022. This information has not been subject to any review by our independent registered public accounting firm. There can be no assurance that the final results for
these periods will not differ from these preliminary results, and any such differences could be material. Quarterly financial results for the second quarter of 2022 will be included in our 2Q22 Financial Report. These interim results of
operations are not necessarily indicative of the results to be achieved for the remainder of or the full second quarter of 2022.
Disclaimer (2/2) 3 Statement regarding non-GAAP financial measuresThis presentation contains non-GAAP
financial measures, including results excluding certain items included in our reported results as well as return on regulatory capital and return on tangible equity. Further details and information needed to reconcile such non-GAAP financial
measures to the most directly comparable measures under US GAAP can be found in the Appendix as well as in the 1Q22 Earnings Release, which are both available on our website at www.credit-suisse.com. Our estimates, ambitions, objectives and
targets often include metrics that are non-GAAP financial measures and are unaudited. A reconciliation of the estimates, ambitions, objectives and targets to the nearest GAAP measures is unavailable without unreasonable efforts. Results
excluding certain items included in our reported results do not include items such as goodwill impairment, major litigation provisions, real estate gains, impacts from foreign exchange and other revenue and expense items included in our
reported results, all of which are unavailable on a prospective basis. Return on tangible equity is based on tangible shareholders' equity, a non-GAAP financial measure also known as tangible book value, which is calculated by deducting
goodwill and other intangible assets from total shareholders' equity as presented in our balance sheet, both of which are unavailable on a prospective basis. Return on regulatory capital (a non-GAAP financial measure) is calculated using
income/(loss) after tax and assumes a tax rate of 25% and capital allocated based on the average of 13.5% of risk-weighted assets and 4.25% of leverage exposure; the essential components of this calculation are unavailable on a prospective
basis. Such estimates, ambitions, objectives and targets are calculated in a manner that is consistent with the accounting policies applied by us in preparing our financial statements. Statement regarding capital, liquidity and leverageCredit
Suisse is subject to the Basel framework, as implemented in Switzerland, as well as Swiss legislation and regulations for systemically important banks, which include capital, liquidity, leverage and large exposure requirements and rules for
emergency plans designed to maintain systemically relevant functions in the event of threatened insolvency. Credit Suisse has adopted the Bank for International Settlements (BIS) leverage ratio framework, as issued by the Basel Committee on
Banking Supervision (BCBS) and implemented in Switzerland by the Swiss Financial Market Supervisory Authority FINMA.Unless otherwise noted, leverage exposure is based on the BIS leverage ratio framework and consists of period-end balance sheet
assets and prescribed regulatory adjustments. The tier 1 leverage ratio and CET1 leverage ratio are calculated as BIS tier 1 capital and CET1 capital, respectively, divided by period-end leverage exposure. SourcesCertain material in this
presentation has been prepared by Credit Suisse on the basis of publicly available information, internally developed data and other third-party sources believed to be reliable. Credit Suisse has not sought to independently verify information
obtained from public and third-party sources and makes no representations or warranties as to accuracy, completeness, reasonableness or reliability of such information.
2022 is a transition year for Credit Suisse 1Q22 key messages Footnotes are an integral part of this
presentation. See slides 36-40 in the appendix of this presentation for detailed information, including important presentation and other information relating to non-GAAP financial measures, and defined terms. 4 CHF (0.4) bnreported pre-tax
income;CHF (0.2) bn Russia-related impact CHF 0.3 bnadjusted pre-tax income;CHF (0.2) bn Russia-related impact 13.8% CET1 ratio4.3% CET1 leverage ratio Integrated strategylaunched to deliver growth in WM;positive NNA across all regions in
volatile environment Cost savingsfrom centralized Procurement and Prime Services exit1; unified platforms and divisions to drive synergies from 2023 Dynamic managingof risk in response to Russia’s invasion of Ukraine with 56% reduction in
credit exposure2 from 4Q21 Strengtheningof both first and second line of defense on track Proactive approachto settlement of litigation cases; CHF 0.7 bn of litigation provisions Strategy Risk and Litigation Financials 82%of USD
>3 bn IB allocated capital reduction ambition achieved
Reported PTI of CHF (428) mnincluded real estate gains of CHF 164 mn offset by major litigation
provisions of CHF 653 mn, losses of CHF 353 mn related to Allfunds and CHF 206 mn from Russia-related losses Adjusted PTI of CHF 300 mnpost Russia-related losses of CHF 206 mn and vs. exceptionally strong 1Q21, from reduced client activity
and capital markets issuances in volatile market conditions, cumulative reduction in risk appetite in 2021, impact of flattening yield curve in Corporate Center Treasury results and increased cash accruals for compensation due to normalized
deferral levels 1Q22 reflected reduced client activity in volatile markets… Footnotes are an integral part of this presentation. See slides 36-40 in the appendix of this presentation for detailed information, including important presentation
and other information relating to non-GAAP financial measures, and defined terms. 5 Group quarterly net revenues and pre-tax incomein CHF bn Net revenues Pre-tax income Reported Adjusted 1Q21 2Q21 3Q21 4Q21 1Q22
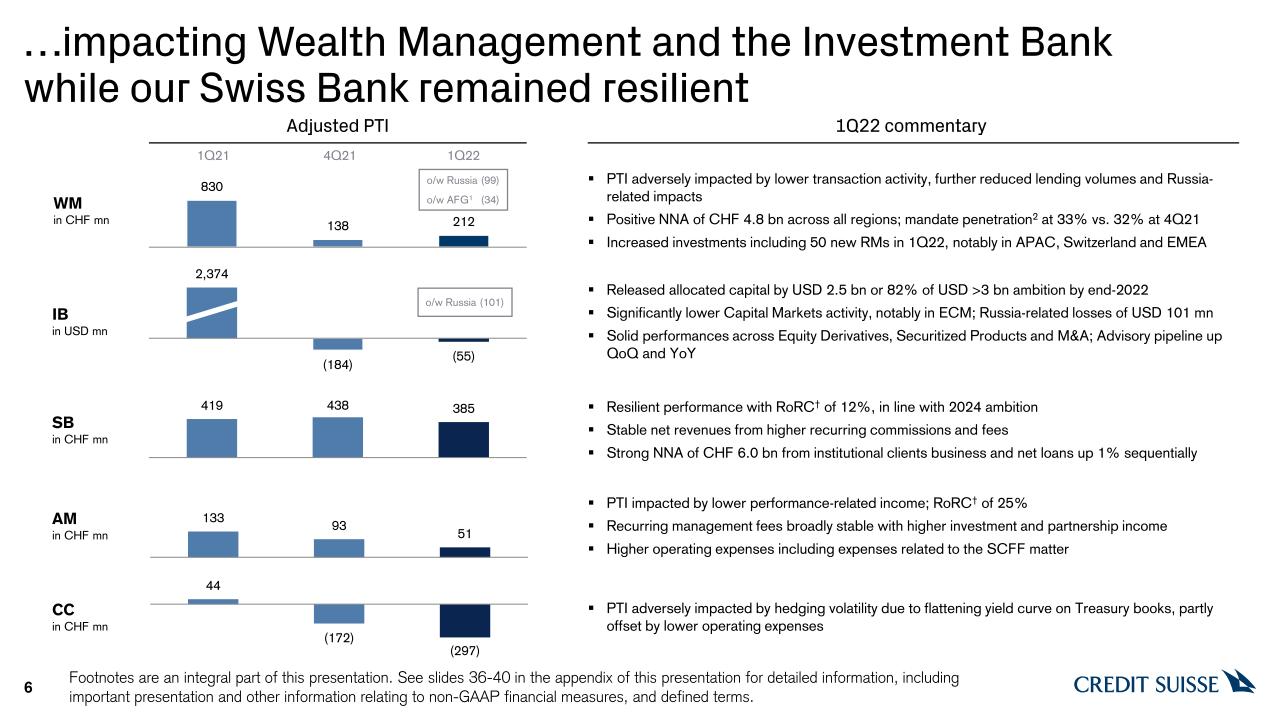
…impacting Wealth Management and the Investment Bank while our Swiss Bank remained resilient Footnotes
are an integral part of this presentation. See slides 36-40 in the appendix of this presentation for detailed information, including important presentation and other information relating to non-GAAP financial measures, and defined terms.
6 Adjusted PTI 1Q22 commentary WMin CHF mn IBin USD mn SBin CHF mn AMin CHF mn CCin CHF mn PTI adversely impacted by lower transaction activity, further reduced lending volumes and Russia-related impactsPositive NNA of CHF 4.8 bn
across all regions; mandate penetration2 at 33% vs. 32% at 4Q21Increased investments including 50 new RMs in 1Q22, notably in APAC, Switzerland and EMEA o/w Russia (99)o/w AFG1 (34) o/w Russia (101) Released allocated capital by USD 2.5 bn
or 82% of USD >3 bn ambition by end-2022Significantly lower Capital Markets activity, notably in ECM; Russia-related losses of USD 101 mnSolid performances across Equity Derivatives, Securitized Products and M&A; Advisory pipeline up QoQ
and YoY Resilient performance with RoRC† of 12%, in line with 2024 ambitionStable net revenues from higher recurring commissions and feesStrong NNA of CHF 6.0 bn from institutional clients business and net loans up 1% sequentially PTI
impacted by lower performance-related income; RoRC† of 25%Recurring management fees broadly stable with higher investment and partnership incomeHigher operating expenses including expenses related to the SCFF matter PTI adversely impacted by
hedging volatility due to flattening yield curve on Treasury books, partly offset by lower operating expenses 1Q21 4Q21 1Q22
Comprehensive de-risking measures executed, improving our risk profile but impacting top-line in the
short-term Footnotes are an integral part of this presentation. See slides 36-40 in the appendix of this presentation for detailed information, including important presentation and other information relating to non-GAAP financial measures, and
defined terms. 7 Wealth Management Ship financingExit of Sub-Saharan Africa markets (excluding South Africa)Russia-related de-riskingConcentration risks, notably in AsiaClient risk review Improved risk profile of Bank CHF ~(25) mn1of
net revenues in 1Q22 Group credit portfolio down 9% YoYincluding 17% reduction in non-investment grade portfolio and 17% reduction in Emerging Markets portfolioGroup market risk reductionof 21% in market risk RWA YoY De-risking measures(in
the last 12 months) Impact from de-risking measures Investment Bank Ongoing exit of Prime Services2Optimization of Corporate Bank exposureReduction of long-duration structured derivatives bookOngoing exit of ~10 non-core GTS markets without
Wealth Management nexus USD ~(250) mnof net revenues in 1Q22
Select updates on strengthening of Risk Management and addressing legacy issues Footnotes are an
integral part of this presentation. See slides 36-40 in the appendix of this presentation for detailed information, including important presentation and other information relating to non-GAAP financial measures, and defined terms. 8 Risk and
Compliance 56% reductionin Russia-related credit exposure2 vs. end-2021 Executing strategyconsistent with approved risk appetite Strengthening of first and second line of defenseon track to enhance efficiency and effectiveness of Client
Lifecycle Processes Legal Established Strategic Regulatory Remediation Committeeat the Executive Board level to oversee delivery on our regulatory programs Proactive approachto settlement of litigation cases; litigation provisions of CHF
0.7 bn in 1Q22, most of which related to matters that originated more than a decade ago, in addition to CHF 0.5 bn in 4Q21 Settlement of 12 major litigation cases in civil matters since 2020, at an accelerated pace vs. previous years Further
strengthening of our risk culture with compensation aligned to improved risk and control practices; development of metrics to track progress Dismissal of >80 cases1since 2020
Select Group Strategy metrics and milestones progress Footnotes are an integral part of this
presentation. See slides 36-40 in the appendix of this presentation for detailed information, including important presentation and other information relating to non-GAAP financial measures, and defined terms. 9 Release capital allocated to
IB to shift into core businesses Select strategic initiatives Deliver Group productivity cost savings for investment Continue to deliver sustainability strategy Wealth Management:Leverage House View to grow recurring revenues Investment
Bank:Exit Prime Services, optimize Corporate Bank Swiss Bank:Drive digital model for retail and SME clients Asset Management:Grow core operating business Reinforce our integrated model USD 2.5 bn reduction vs. 4Q20, representing 82% of
ambition 1Q22 progress Outsourcing of Procurement expected to lead to cash savings of CHF 150 mn in 2022, rising to CHF 250 mn in 2023; other cost measures, e.g. CTOO integration, to yield savings later in the year, increasing into
2023 Sustainable AuM3 of CHF 144 bn, up 22% vs. 1Q21; additional restrictions on Arctic oil & gas, oil sands and deep sea mining Mandate penetration of 33% vs. 30% at 4Q20(for WM and PB Switzerland) 84% reduction in Prime balances since
1Q21Hired ~50 MDs4 in IBCM reflecting our commitment to rebuild 125k5 CSX clients at 1Q22 Management fee margin of 26 bpsJoined Net Zero Asset Managers initiative Launched Private & Growth Markets and refocused GTS platform to reinforce
collaboration between IB and WM USD >3 bn reduction by 4Q22 vs. 4Q20 Ambitions CHF ~1.0-1.5 bn structural cost savings p.a. by 20241 Deliver sustainable solutions Mandate penetration of 33-35% by 2024(for WM and PB Switzerland) Exit
Prime Services2 by end-2022 200k clients by end-2022 Stable management fee margin ~26 bps Increase revenues from collaboration
We will progressively deploy resources in Wealth Management to accelerate growth Footnotes are an
integral part of this presentation. See slides 36-40 in the appendix of this presentation for detailed information, including important presentation and other information relating to non-GAAP financial measures, and defined terms. 10 Defined
and launched the new integrated Wealth Management organization under the new divisional leadership, with clear lines of accountability, to execute our long-term vision for wealth managementDeployed new coverage set-upLaunched new, dedicated
strategic capabilities including Financing & Products, Investment Solutions & Sustainability and Client Segment Management Evolved our strategy following the Wealth Management CEO’s first 50 days assessment, also against the backdrop
of the rapidly changing geopolitical contextLaunched practical development initiatives with clear senior-level accountability to operationalize these Ten strategic priorities focused on: client segments, priority markets, products and
solutions, simplification and people Exit of Private Banking activities in Sub-Saharan Africa markets (excluding South Africa)Accelerated digital outreach in Core HNW segment (e.g. PBI ‘CS in Brief’ extended to clients in 55 markets;
behavioral client tracking analytics in place)Invested in 50 Relationship Manager hires in 1Q22 with focus on APAC, Switzerland and EMEA Launch of integratedWealth Management division Started execution of initiatives Defined strategic
execution program CBV CHF ~1.6 trn by 2024(for WM and PB Switzerland) AuMCHF ~1.1 trn by 2024(for WM and PB Switzerland) Adj. RoRC†>18% by 2024 Key aspirations
Continued progress on reshaping the Investment Bank and investing for growth 11 Release capital from
Prime and de-risk franchise Invest in capital-light Investment Banking & Capital Markets business Build a global franchise and increase Wealth Management connectivity Hired ~50 new MDs4 in IBCM as part of our growth plan, with 21 new
hires starting by 1H22 Grew market share in IBCM EMEA (Top 5) and IBCM APAC (Top 5) in 1Q225, commensurate with rebalancing the regional footprint Increased SoW in Leveraged Finance Capital Markets QoQ5Continue to rebuild IBCM Managing Director
footprint, with a particular focus on high growth sectors and areas linked to sustainability Delivered USD 2.5 bn reduction in allocated capital vs. 2020, achieving 82% of USD >3 bn capital release ambition1Reduced Prime chargeable balances
by 84% since 1Q21 and 54% since 4Q21Increased oil and gas lending clients in the Aware or above category of the Client Energy Transition Framework2 by 8 pp. vs. 1Q21Enhanced risk management framework led to swift reduction in Russia
exposureFull exit3 of Prime business to be achieved by end-2022 at the latest Reintegrated Securities Research, APAC IBCM and Swiss IBCM to better serve clients globallyRefocused GTS platform with a simplified asset-aligned structure and
unified sales team to drive collaboration Integrated HOLT in Equities franchise to deliver industry leading content & analytics Launched new Private & Growth Markets organization to capture nexus of WM and IB activity in EMEA2nd best
quarterly Equity Derivatives result after 1Q21Focus on better harmonizing GTS and financing functionality globally Drive market-leading Credit and Securitized Products businesses Continued momentum in Securitized Products and expanded ESG
offering in our Credit franchise#2 rank6 in Agency CMBS and #3 rank7 Pass Through trading Capital1 releaseUSD >3 bn over 2021-2022 Key aspirations Adj. RoRC†>12% in 2024 Footnotes are an integral part of this presentation. See slides
36-40 in the appendix of this presentation for detailed information, including important presentation and other information relating to non-GAAP financial measures, and defined terms.
Swiss Bank building on its leading positions 12 Further build strong consumer banking business Further
grow our leading corporate banking franchise Grow Private and Digital Banking businesses Gain further market share in institutional business Go-live of ‘Life Plan’ Advisory in Private Banking to better access growing retirement asset
poolInvested into PB growth: new RMs, wealth planning, underlying ITStrong growth in CSX, 125k clients in 1Q22; targeting 200k clients in 2022Roll out CSX bundles; new mortgage partnership with MoneyPark/PriceHubble Leading positions in
premium cardsSuccessful credit partnerships, e.g. with leading car manufacturersCapitalized on post-COVID normalization in cards, FX and leasingFurther enhance digitalization and partner integration Top 2 Corporate Banking franchise leveraging
#1 IBCM position1; robust deal flow in 1Q22Strong collaboration with Private Banking centered around EntrepreneursDrive lending growth including expansion of structured / capital velocity solutionsFurther develop sustainable finance
offering #1 Institutional Banking franchise2; continued strong NNA momentum in 1Q22Continued strong growth in fund lending solutions; expanding offeringEnhance Asset Servicing offering including ESG analytic capabilities Simplify and
digitalize front-to-back processes Rolled out mortgage tools and select workflow automationSimplified onboarding in Private and Corporate BankingTargeted IT investments into simplification / automation – faster to client, lower cost to
serve CBVLow- to mid-single digitCAGR over 2022-2024 Adj. cost/income ratioMid 50s in 2024 Adj. RoRC†>12% in 2024 Key aspirations Footnotes are an integral part of this presentation. See slides 36-40 in the appendix of this presentation
for detailed information, including important presentation and other information relating to non-GAAP financial measures, and defined terms.
Progress on executing our ambitious strategy in Asset Management with a focus on talent and
technology 13 Strengthen and simplify organization and governance model Improve risk management and strengthen our control environment Drive execution towards our long term strategic ambition Strengthened product development process,
including systematic viability and risk appetite assessments Extended and enhanced existing risk management framework and prepared for the build out of strategic priority areas, e.g. Private MarketsLaunch new ‘Everyone is a Risk Manager’
training program Completed hiring and onboarding of senior management team in AM, e.g. Head of Distribution and Head of ProductDefined new global, functionally aligned organizational structureOptimized governance framework to further increase
accountability and efficiencies Embed new global functional organization structure and support talent to thrive in the new AM organization structure Defined new Sustainability Strategy for AM and joined Net Zero Asset Managers
initiativeContinued to exit non-core investments and partnerships portfolio in a value accretive wayInitiated design of future AM / WM collaboration modelInitiated hiring in selected priority markets and investment capabilitiesDevelop detailed
plans for few remaining strategic priority areas, e.g. Private Markets, definition of investment hub and product localization strategy NNA growth>4% in 2024 Management fee marginStable at ~26 bps Adj. cost/income ratio~75% in 2024 Adj.
RoRC†>45% by 2024 Key aspirations Footnotes are an integral part of this presentation. See slides 36-40 in the appendix of this presentation for detailed information, including important presentation and other information relating to
non-GAAP financial measures, and defined terms.
Our recently established CTOO Organization is focused on agile, digital transformation and identifying
rationalization opportunities Rolled out new Engineering & Operations OrganizationLaunched program to adopt agile practices firm-wideLaunched program to leverage enterprise-wide digital core capabilities Aligned with the Strategic
Regulatory Remediation Committee to ensure IT delivery of our commitmentsEnhancing culture of personal accountability and responsibility by “tone from the top”Attracting key talent and becoming a destination of choice for engineers Kicked off
planning and design process to establish single wealth management platformIdentified opportunities to decrease vendor dependencies and expensesIdentified opportunities to materially reduce IT delivery overheadLaunching location strategy to
further identify and build out capabilities in high value locations Strengthen Simplify Establishing Digitization & Investment Governance to prioritize and fully align resources to CS strategy Further driving CSX roll out with ambition
of 200k clients by end-2022Assigning dedicated engineering resources to CS wide ESG focusAutomating across client journey to enhance client experience with initial focus on client onboarding Invest for Growth Best-known Swiss brand for
digital banking in Switzerland Best Structured Product Technological Solution, Americas Best Digital Networking Bank for Entrepreneurs in Asia #1 E-Trading platform in APAC for AES 2021
WatersTechnology Asia Awards – Best AI Initiative HK Technology – Innovative or Emerging Technology Adoption Best Private Bank for Use of RegTech Best Private Bank – Client Experience
Footnotes are an integral part of this presentation. See slides 36-40 in the appendix of this presentation for detailed information, including important presentation and other information relating to
non-GAAP financial measures, and defined terms. 14
Leading the bank and our clients into a sustainable future 15 1Q22 milestones Net Zero Asset
Managers Initiativejoined on March 22, 2022 Sole Conservation Bond Structurer of the World Bank-issuedWildlife Conservation (“Rhino”) Bond Additional policy restrictionson Arctic oil & gas, oil sands and deep sea mining Financial
progress and way forward 2021 Sustainability Reportpublished on March 10, 2022 with additional disclosures including reporting against core WEF IBC Stakeholder Capitalism Metrics and increased TCFD disclosure Sustainability Bond of the year
– sovereign1winner at Environmental Finance Bond Awards for acting as sole structurer & arranger of the Blue Bond for The Nature Conservancy 164 Wealth Management ESG funds3in 1Q22, up from 122 in 1Q21 Sustainable AuM2 of CHF 144 bnin
1Q22 resulting in penetration of 9.3% of total AuM;up from CHF 118 bn and penetration of 7.4% in 1Q21 New Sustainability LeadershipNewly appointed Chief Sustainability Officer, directly reporting to Group CEO Footnotes are an integral part of
this presentation. See slides 36-40 in the appendix of this presentation for detailed information, including important presentation and other information relating to non-GAAP financial measures, and defined terms. Continue to support clients’
transition and expand sustainable investment and finance offering, also via strategic partnerships Further progresstowards our commitment to provide at least CHF 300 bn in sustainable finance by 2030 Reconfirm our commitmentto reach 2050 net
zero emissions in line with the guidelines of the Science Based Targets Initiative
Group Overview Footnotes are an integral part of this presentation. See slides 36-40 in the appendix of
this presentation for detailed information, including important presentation and other information relating to non-GAAP financial measures, and defined terms. 17 Reported net revenuesinclude real estate gains of CHF 164 mn, a loss of CHF 353
mn related to Allfunds and CHF 148 mn of Russia-related impact Provision for credit lossesincludes a CHF 155 mn release related to Archegos, partly offset by CHF 58 mn of provisions related to Russia’s invasion of Ukraine Higher operating
expensesup 26%, driven by major litigation provision of CHF 653 mn, increased cash accruals for compensation due to normalized deferral levels and incremental investments Adjusted PTI of CHF 300 mnpost Russia-related losses of CHF 206 mn and
vs. exceptionally strong 1Q21, from reduced client activity and capital markets issuances in volatile market conditions, cumulative reduction in risk appetite in 2021, impact of hedging volatility due to flattening yield curve in Corporate
Center Treasury results and increased cash accruals for compensation due to normalized deferral levels Credit Suisse Group in CHF mn 1Q22 4Q21 1Q21 Δ 4Q21 Δ 1Q21 Reported Net
revenues 4,412 4,582 7,574 (4)% (42)% Provision for credit losses (110) (20) 4,394 Total operating expenses 4,950 6,266 3,937 (21)% 26% Pre-tax income (428) (1,664) (757) n/m n/m Effective tax
rate 35% (25)% 70% Net income/(loss) attributable to shareholders (273) (2,085) (252) n/m n/m Return on tangible equity‡ (2.6)% (20.9)% (2.6)% Cost/income
ratio 112% 137% 52% Adjusted Net revenues 4,582 4,384 7,430 5% (38)% Provision for credit losses 45 (15) (36) Total operating expenses 4,237 4,071 3,870 4% 9% Pre-tax
income 300 328 3,596 (9)% (92)% o/w Russia-related (206) - -
We have significantly reduced our Russia credit exposure Footnotes are an integral part of this
presentation. See slides 36-40 in the appendix of this presentation for detailed information, including important presentation and other information relating to non-GAAP financial measures, and defined terms. 18 Financial
institutionsnet credit exposure down 67% with further reduction of exposures ongoingCorporates & Individualshighly collateralized with non-Russia collateral and limited losses Substantial reductionin our Russia net credit exposure by 56%
to CHF 373 mn at March 31, 2022 CHF 0.2 bn net asset value of our Russian subsidiaries, down CHF 16 mn vs. December 31, 2021 in CHF mn Gross Net2 Gross Net2 Risk exposure1 1,569 848 1,041 373 o/w
Sovereigns - - 35 35 o/w Financial institutions 634 536 229 177 o/w Corporates 468 148 429 82 o/w Individuals 467 164 348 79 As at December 31, 2021 As at March 31, 2022 PTI losses of CHF 206
mninclude trading and fair value losses of CHF 148 mn as well as PCL of CHF 58 mn, of which CHF 44 mn of non-specific provisions
Higher operating expenses driven by increased cash accruals for compensation due to normalized deferral
levels and incremental investments Footnotes are an integral part of this presentation. See slides 36-40 in the appendix of this presentation for detailed information, including important presentation and other information relating to non-GAAP
financial measures, and defined terms. 19 Group adjusted operating expensesin CHF mn Higher compensation and benefitsprimarily driven by CHF 214 mn of increased cash accruals for compensation due to normalized deferral levels
Incremental investmentsof CHF 152 mn in relation to our Group strategy and increased remediation spend in Risk, Compliance and Infrastructure Restructuring expensesof CHF 79 mn over 4Q21-1Q22, with CHF 46 mn in 1Q22, out of our guidance
of CHF ~400 mn, with the balance to be utilized over the rest of the year Outsourcing of Procurementexpected to lead to cash savings of CHF 150 mn in 2022, rising to CHF 250 mn in 2023; other cost measures, e.g. CTOO integration to yield
savings later in the year, increasing into 2023
Wealth Management & Private Banking Switzerland CBV impacted by adverse market movements; positive
NNA across all regions Footnotes are an integral part of this presentation. See slides 36-40 in the appendix of this presentation for detailed information, including important presentation and other information relating to non-GAAP financial
measures, and defined terms. 20 Regions AuM NNA Switzerland 238 2.1 EMEA 284 0.6 Asia Pacific 212 1.8 Americas 82 0.1 Total 816 4.6 Wealth Management & Private Banking Switzerland1Q22 regional volumesin CHF
bn Market moves (35)FX impact 7Other1 (16)NNA 5 Assets under Management Net loans Custody assets (5)%QoQ Wealth Management & Private Banking Switzerland1Q22 volumes overviewin CHF bn AuM CBV Wealth Management Private
BankingSwitzerland
Resilient CET1 capital and leverage ratios Footnotes are an integral part of this presentation. See
slides 36-40 in the appendix of this presentation for detailed information, including important presentation and other information relating to non-GAAP financial measures, and defined terms. 21 CET1 ratio down 60 bpswith RWA increases of CHF
2 bn from operational risk (excluding FX) and CHF 2 bn from FX, partly offset by a reduction of USD 2 bn from Prime Services exit2 Leverage exposure down CHF 11 bndriven by a reduction of USD 20 bn from Prime Services exit2 Parent CET1 ratio
of 11.8%vs. 11.4% at January 1, 2022, including dividend payment from CS Schweiz and capital repatriation from CSH USA totaling CHF ~2 bn; further planned dividend payments and capital repatriations from subsidiaries expected to increase the
CET1 ratio in the second half of the year, subject to regulatory approval 13.8% CET1 ratio 14.4% Risk-weighted assets in CHF bn 1 Leverage exposure in CHF bn o/w IB (13) o/w WM, SB, AM 0 1 4.3% CET1 leverage
ratio 4.3% 6.1% Tier 1 leverage ratio 6.1% o/w IB 0 o/w WM, SB, AM 1
Positive gearing to rising USD interest rates Footnotes are an integral part of this presentation. See
slides 36-40 in the appendix of this presentation for detailed information, including important presentation and other information relating to non-GAAP financial measures, and defined terms. 22 Net interest income sensitivity(Wealth
Management and Swiss Bank)NII increase from realization of USD forward rates1,in CHF mn Significant NII sensitivity to USD forward rateswith an expected CHF ~150 mn incremental net interest income in 2022 and a further CHF ~400 mn in
2023 Uncertainty from timing of CHF and EUR rate moveswith expected negative impact from CHF moves towards zero rates partially offset by positive impact from EUR rate moves
Wealth Management Footnotes are an integral part of this presentation. See slides 36-40 in the appendix
of this presentation for detailed information, including important presentation and other information relating to non-GAAP financial measures, and defined terms. 23 PTI significantly down YoY from lower transaction activity and
Russia-related impacts Transaction revenues downvs. strong 1Q21 reflecting Russia-related losses of CHF 59 mn, MtM losses2 in APAC Financing of CHF 32 mn, weaker GTS revenues and lower brokerage and product issuance feesFees and net interest
income declinebroadly mirrors YoY reductions in volumes; NII up QoQInvesting in our businessHigher operating expenses driven by increased cash accruals for compensation due to normalized deferral levels, technology investments, higher
Group-wide risk and compliance costs and higher RM headcountReported PTI reflects headwindsincluding CHF 353 mn loss on investment in Allfunds; major litigation provisions of CHF 230 mn; Russia-related impacts of CHF (99) mn, including credit
provisions of CHF 40 mn De-risking impacted volumes & flowswith lower loan volumes from Russia’s invasion of Ukraine and de-risking measures; CBV down 5% QoQ due to market movements and structural effects; positive NNA in difficult
environment in CHF mn 1Q22 4Q21 1Q21 Δ 1Q21 Adjusted key financials Net interest income 514 502 561 (8)% Recurring commissions and fees 420 432 444 (5)% Transaction-based 578 413 938 (38)% Net
revenues1 1,506 1,345 1,941 (22)% Provision for credit losses 24 (7) 13 Total operating expenses 1,270 1,214 1,098 16% Adjusted PTI 212 138 830 (74)% o/w Russia-related
impact (99) - - Adjusted C/I ratio 84% 90% 57% Adjusted RoRC† 7% 5% 26% Reported PTI (357) 157 978 n/m Reported RoRC† (12)% 5% 31% in CHF bn Key
metrics Adjusted net margin in bps 12 7 46 (34) Client business volume 1,040 1,099 1,143 (9)% Net loans 97 103 114 (14)% Net new assets 4.8 (2.9) 14.5 Risk-weighted
assets 60 60 68 (12)% Leverage exposure 233 233 245 (5)% Number of relationship managers 1,940 1,890 1,900 2%
Investment Bank Footnotes are an integral part of this presentation. See slides 36-40 in the appendix of
this presentation for detailed information, including important presentation and other information relating to non-GAAP financial measures, and defined terms. 24 Pre-tax loss reflects substantially reduced Capital Markets revenues,
Russia-related losses and reduced capital usage primarily due to Prime Services exit in USD mn 1Q22 4Q21 1Q21 Δ 1Q21 Adjusted key financials Fixed income sales & trading 802 504 1,616 (50)% Equity sales &
trading 526 403 1,030 (49)% Capital markets 466 585 1,361 (66)% Advisory and other fees 221 331 257 (14)% Other1 5 (3) (1) n/m Net revenues 2,020 1,820 4,263 (53)% Provision for credit
losses (2) (3) (72) Total operating expenses 2,077 2,007 1,961 6% Adjusted PTI (55) (184) 2,374 n/m o/w Russia-related impact (101) - - Adjusted C/I ratio 103% 110% 46% Adjusted
RoRC† (1)% (4)% 42% Reported PTI 134 (2,174) (2,387) n/m Reported RoRC† 3% (45)% (42)% in USD bn Key metrics Risk-weighted assets 93 92 117 (21)% Leverage
exposure 364 380 444 (18)% Net revenues down 53% vs. record 1Q21Significantly lower ECM activity and reduced M&A fees; lower YoY leveraged finance revenues due to reduced risk appetite, however regained share2 QoQLower GTS results
reflecting underperformance in macro and emerging markets and resilient equity derivatives trading revenues vs. strong 1Q21Fixed Income results mainly reflect normalized securitized products revenues, albeit significantly above historic
levelsEquities revenues include the impact from the exit3 of prime services and lower cash trading volumes; we maintained a #6 rank4 in cash equitiesOperating expenses increased 6%primarily driven by increased cash accruals for compensation due
to normalized deferral levels and higher Group-wide technology, risk & compliance costsPre-tax loss of USD 55 mnreflecting our strategy to de-risk our franchise, lower client activity across all businesses and Russia-related losses of USD
101 mn, of which USD 97 mn in GTS from trading and fair value losses; reported PTI of USD 134 mn includes real estate gains of USD 57 mn and Archegos impact5 of USD 174 mn RWA and LE declined YoYprimarily due to reductions in Prime Services;
reduced allocated capital by USD 2.5 bn vs. 2020, on track to achieve our ambition of USD >3 bn capital release by 2022
Swiss Bank Footnotes are an integral part of this presentation. See slides 36-40 in the appendix of this
presentation for detailed information, including important presentation and other information relating to non-GAAP financial measures, and defined terms. 25 Resilient results despite higher compensation expenses in CHF
mn 1Q22 4Q21 1Q21 Δ 1Q21 Adjusted key financials Net interest income 576 587 591 (3)% Recurring commissions and fees 336 332 314 7% Transaction-based 136 138 142 (4)% Net
revenues1 1,022 1,039 1,031 (1)% Provision for credit losses 23 (4) 26 o/w Russia-related impact 14 - - Total operating expenses 614 605 586 5% Adjusted PTI 385 438 419 (8)% Adjusted C/I
ratio 60% 58% 57% Adjusted RoRC† 12% 13% 12% Reported PTI 471 607 412 14% Reported RoRC† 14% 18% 12% in CHF bn Key metrics Adjusted net margin in
bps 26 30 30 (4) Client business volume 871 890 856 2% Net loans 163 161 165 (1)% Net new assets 6.0 1.0 3.8 Risk-weighted assets 70 69 73 (4)% Leverage
exposure 248 248 254 (2)% Number of relationship managers 1,680 1,630 1,660 1% Net revenues stablewith an increase of 7% in recurring commissions and fees supported by higher revenues from improved performance in our investment
in Swisscard and higher AuM levels, offset by lower net interest income and decreased transaction-based revenues driven by lower IB collaboration revenuesOperating expenses up 5%from increased cash accruals for compensation due to normalized
deferral levels, targeted investments in Swiss business and higher Group-wide technology, risk and compliance costsPTI down 8%due to higher operating expenses; RoRC† at 12%Russia-related impact of CHF 14 mnin provision for credit
losses Client business volume up 2%mainly driven by NNA; net loans up 1% compared to 4Q21 driven by our corporate banking and institutional clients businesses; NNA of CHF 6.0 bn entirely driven by our institutional clients business
Asset Management Footnotes are an integral part of this presentation. See slides 36-40 in the appendix
of this presentation for detailed information, including important presentation and other information relating to non-GAAP financial measures, and defined terms. 26 PTI adversely affected by lower performance-related income and higher
expenses in CHF mn 1Q22 4Q21 1Q21 Δ 1Q21 Adjusted key financials Management fees 272 286 279 (3)% Performance, transaction & placement rev. 44 94 92 (52)% Investment and partnership
income 43 19 29 48% Net revenues 359 399 400 (10)% Provision for credit losses - (2) - Total operating expenses 308 308 267 15% Adjusted PTI 51 93 133 (62)% Adjusted C/I
ratio 86% 77% 67% Adjusted RoRC† 25% 45% 55% Reported PTI 53 93 131 (60)% Reported RoRC† 26% 45% 55% in CHF bn Key metrics Assets under
management 462 477 458 1% Net new assets (0.6) 4.7 10.3 Risk-weighted assets 8 8 10 (17)% Leverage exposure 3 3 3 (17)% Net revenues down 10%mainly due to reduced performance, transaction and placement
revenues, including investment related losses and lower performance fees, partially offset by higher investment & partnership income; recurring management fees broadly stableHigher operating expensesprimarily driven by increased cash
accruals for compensation due to normalized deferral levels, expenses related to the SCFF matter and higher Group-wide technology, risk and compliance costsPTI downreflecting a volatile macro environment, reduced activity levels, risk appetite
from clients and higher operating expenses NNA outflows of CHF 0.6 bnin particular driven by outflows from Fixed Income and Credit; continued good momentum in Index SolutionsReduced capital intensitydriving RoRC† of 25%
Investor Deep Dive Footnotes are an integral part of this presentation. See slides 36-40 in the appendix
of this presentation for detailed information, including important presentation and other information relating to non-GAAP financial measures, and defined terms. 27 Risk, Compliance, Technology and Wealth Management Deep Dive Event to be
held before 2Q22 results, date to be announced in due course
CEO concluding remarks Footnotes are an integral part of this presentation. See slides 36-40 in the
appendix of this presentation for detailed information, including important presentation and other information relating to non-GAAP financial measures, and defined terms. 28 Further strengthen risk culture Accelerate client and revenue
momentum Execute strategic plan
Net and gross margins Footnotes are an integral part of this presentation. See slides 36-40 in the
appendix of this presentation for detailed information, including important presentation and other information relating to non-GAAP financial measures, and defined terms. 30 Adjusted gross margin in
bps 1Q22 4Q21 2Q21 1Q21 3Q21 1Q22 4Q21 2Q21 1Q21 3Q21 729 830 Average AuM in CHF bn Adjusted pre-tax income in CHF mn Adjusted net revenues in CHF
mn 1,941 1,547 1,567 384 432 754 759 1,506 212 724 1,345 138 755 Wealth
Management 1Q22 4Q21 2Q21 1Q21 3Q21 1Q22 4Q21 2Q21 1Q21 3Q21 560 419 1,031 1,019 1,049 450 448 579 592 1,022 385 588 1,039 438 593 Swiss Bank Adjusted net margin in bps
Corporate Center Footnotes are an integral part of this presentation. See slides 36-40 in the appendix
of this presentation for detailed information, including important presentation and other information relating to non-GAAP financial measures, and defined terms. 31 Corporate Center in CHF mn 1Q22 4Q21 1Q21 Δ
1Q21 Adjusted key financials Treasury results (254) (130) 129 n/m Asset Resolution unit 39 17 (33) n/m Other1 42 48 78 (46)% Net revenues (173) (65) 174 n/m Provision for credit
losses (1) - (10) Total operating expenses 125 107 140 (11)% Adjusted PTI (297) (172) 44 n/m Reported PTI (719) (533) 32 n/m in CHF bn Key metrics Total
assets 56 55 57 (3)% Risk-weighted assets 49 46 42 16% Leverage exposure 58 58 62 (5)% ARU within Corporate Center in CHF mn 1Q22 4Q21 1Q21 Δ 1Q21 Key financials Net
revenues 39 17 (33) n/m Provision for credit losses (1) 0 (1) Total operating expenses 30 27 36 (17)% PTI 10 (10) (68) n/m in USD bn Key metrics Risk-weighted
assets 7 8 9 (23)% Leverage exposure 16 18 20 (23)%
Oil & Gas / Leveraged Finance exposures Footnotes are an integral part of this presentation. See
slides 36-40 in the appendix of this presentation for detailed information, including important presentation and other information relating to non-GAAP financial measures, and defined terms. 32 Oil & Gas exposure1in USD bn Leveraged
Finance exposure2in USD bn
Currency mix & Group capital metrics Footnotes are an integral part of this presentation. See slides
36-40 in the appendix of this presentation for detailed information, including important presentation and other information relating to non-GAAP financial measures, and defined terms. 33 Adjusted Credit Suisse Group results Applying a +/-
10% movement on the average FX rates for 1Q22 LTM, the sensitivities are:USD/CHF impact on 1Q22 LTM pre-tax income by CHF +332 / (332) mnEUR/CHF impact on 1Q22 LTM pre-tax income by CHF +150 / (150) mn Sensitivity analysis on Group
results2 1Q22 LTMin CHF mn Contribution Wealth Management Investment Bank Swiss Bank Asset Management Group CHF USD EUR GBP Other Currency mix capital metric3 A 10% strengthening / weakening of the USD (vs.
CHF) would have a (2.6) bps / +3.0 bps impact on the BIS CET1 ratio Basel III Risk-weighted assets Swiss leverage exposure CHF EUR Other USD USD CET1 capital 4 CHF Net revenues 19,696 29% 44% 12% 3%
12%Total expenses1 16,393 32% 33% 5% 10% 20% Net revenues 5,965 13% 48% 17% 4% 18%Total expenses1 4,799 34% 23% 7% 6% 30% Net revenues 8,360 5% 64% 13% 5% 13%Total expenses1 7,363 7% 50% 5% 15% 23% Net revenues 4,129 90% 2% 5% 1% 2%Total
expenses1 2,408 89% 2% 2% 2% 5% Net revenues 1,580 51% 36% 10% 1% 2%Total expenses1 1,183 42% 38% 6% 8% 6%
34 Results excluding certain items included in our reported results are non-GAAP financial measures.
Following the reorganization implemented at the beginning of 2022, we have amended the presentation of our adjusted results. Management believes that such results provide a useful presentation of our operating results for purposes of assessing
our Group and divisional performance consistently over time, on a basis that excludes items that management does not consider representative of our underlying performance. Provided below is a reconciliation of our adjusted results to the most
directly comparable US GAAP measures. Reconciliation of adjustment items (1/2)
35 Results excluding certain items included in our reported results are non-GAAP financial measures.
Following the reorganization implemented at the beginning of 2022, we have amended the presentation of our adjusted results. Management believes that such results provide a useful presentation of our operating results for purposes of assessing
our Group and divisional performance consistently over time, on a basis that excludes items that management does not consider representative of our underlying performance. Provided below is a reconciliation of our adjusted results to the most
directly comparable US GAAP measures. Reconciliation of adjustment items (2/2)
Notes 36 General notesThroughout this presentation and the 1Q22 Results presentation rounding
differences may occurUnless otherwise stated, all financial numbers presented and discussed are adjusted. Results excluding certain items included in our reported results are non-GAAP financial measures. All percentage changes and comparative
descriptions refer to YoY measurements unless otherwise specifiedUnless otherwise noted, all CET1 capital, CET1 ratio, Tier 1 leverage ratio, risk-weighted assets and leverage exposure figures shown in these presentations are as of the end of
the respective periodGross and net margins are shown in basis pointsGross margin = net revenues annualized / average AuM; net margin = pre-tax income annualized / average AuM. Net margin excluding certain significant items, as disclosed herein,
is calculated excluding those items applying the same methodologyMandates reflect advisory and discretionary mandate volumesMandate penetration reflects advisory and discretionary mandate volumes as a percentage of AuM, excluding those from the
external asset manager businessParent means Credit Suisse AG on a standalone basis. All CET1 capital and CET1 ratio figures shown in these presentations for Parent are Swiss capital metricsClient Business Volume includes assets under
management, custody assets and net loansCustody assets includes assets under custody and commercial assetsSpecific notes† Regulatory capital is calculated as the average of 13.5% of RWA and 4.25% of leverage exposure and return on regulatory
capital, a non-GAAP financial measure, is calculated using income/(loss) after tax and assumes a tax rate of 25% from 2020 onward. For the Investment Bank, return on regulatory capital is based on US dollar denominated numbers. Return on
regulatory capital excluding certain items included in our reported results is calculated using results excluding such items, applying the same methodology. Adjusted return on regulatory capital excluding certain items included in our reported
results is calculated using results excluding such items, applying the same methodology.‡ Return on tangible equity, a non-GAAP financial measure, is calculated as annualized net income attributable to shareholders divided by average tangible
shareholders’ equity. Tangible shareholders’ equity, a non-GAAP financial measure, is calculated by deducting goodwill and other intangible assets from total shareholders’ equity as presented in our balance sheet.For end-1Q21, tangible
shareholders’ equity excluded goodwill of CHF 4,644 mn and other intangible assets of CHF 239 mn from total shareholders’ equity of CHF 44,590 mn as presented in our balance sheet.For end-4Q21, tangible shareholders’ equity excluded goodwill of
CHF 2,917 mn and other intangible assets of CHF 276 mn from total shareholders’ equity of CHF 43,954 mn as presented in our balance sheet.For end-1Q22, tangible shareholders’ equity excluded goodwill of CHF 2,931 mn and other intangible assets
of CHF 307 mn from total shareholders’ equity of CHF 44,442 mn as presented in our balance sheet.Our ambition to release USD >3 bn of capital from the Investment Bank over 2021-2022 and our ambition to invest CHF ~3 bn of capital in Wealth
Management over 2021-2024 is based on an average of 13.5% risk-weighted assets and 4.25% leverage exposure.AbbreviationsAdj. = Adjusted; AM = Asset Management; APAC = Asia Pacific; ARU = Asset Resolution Unit; AuM = Assets under Management; BIS
= Bank of International Settlements; bps = basis points; CAGR = Compound annual growth rate; CBV = Client Business Volume; CC = Corporate Center; CET1 = Common Equity Tier 1; CHF = Swiss Franc; CM = Capital Markets; CMBS = commercial
mortgage-backed securities; COVID = Coronavirus disease; CTOO = Chief Technology and Operations Officer; C/I = cost income ratio; ECM = Equity Capital Markets; EMEA = Europe, Middle East and Africa; ESG = Environment, Social, Governance; EUR =
Euro; FINMA = Swiss Financial Market Supervisory Authority; FX = Foreign Exchange; GAAP = Generally Accepted Accounting Principles; GTS = Global Trading Solutions; HNW = High Net Worth; IB = Investment Bank; IG = Investment Grade; IT =
Information Technology; LE = Leverage exposure; LTM = Last twelve months; M&A = Mergers & Acquisitions; MD = Managing Director; MtM = mark to market; NII = net interest income; NNA = Net New Assets; p.a. = per annum; PB = Private
Banking; PBI = Private Banking International; PCL = provision for credit losses; pp. = percentage points; PTI = Pre-tax income; QoQ = Quarter on Quarter; rev. = revenues; RM = Relationship Manager; RoRC = Return on Regulatory Capital; RWA =
Risk-weighted assets; SB = Swiss Bank; SCFF = Supply Chain Finance Funds; SME = Small and Medium Enterprises; SoW = Share of Wallet; TCFD = Task Force on Climate-Related Financial Disclosures; USD = United States Dollar; vs. = versus; WEF IBC =
World Economic Forum’s International Business Council; WM = Wealth Management; YoY = Year on year
Footnotes 37 Slide 4 2022 is a transition year for Credit Suisse – 1Q22 key messages1. With the
exception of Index Access and APAC Delta One2. Exposure is net of risk mitigation, specific allowances, specific provisions for credit losses and valuation adjustmentsSlide 6 …impacting Wealth Management and the Investment Bank while our Swiss
Bank remained resilient1. Includes MtM losses in APAC Financing 2. Includes Wealth Management & Private Banking SwitzerlandSlide 7 Comprehensive de-risking measures executed, improving our risk profile but impacting top-line in the
short-term1. Primarily driven by Ship Financing, concentration risks and client risk reviews2. With the exception of Index Access and APAC Delta OneSlide 8 Select updates on strengthening of Risk Management and addressing legacy issues1.
Includes any type of case against Credit Suisse2. Exposure is net of risk mitigation, specific allowances, specific provisions for credit losses and valuation adjustmentsSlide 9 Select Group Strategy metrics and milestones progress1. Measured
using adjusted operating expenses, excluding significant items, at constant 2021 FX rates, progressively increasing from 2022-2024; does not include cost reductions from exited businesses2. With the exception of Index Access and APAC Delta
One3. Refers to Credit Suisse’s assets managed according to the Credit Suisse Sustainable Investment Framework (Sustainable AuM). This includes only AuM balances from managed solutions that to date have been mapped to a sustainability rating of
2 and higher, based on the Framework scale (0-5). The majority of this growth vs. 1Q21 has been achieved through progress on our framework implementation and product classification. The other relevant drivers include the launch of new
sustainable funds and net sales of existing sustainable funds partially offset by market performance4. Since the beginning of 20215. Includes transfer of existing Bonviva clients to the CSX solutions
Footnotes 38 Slide 11 Continued progress on reshaping the Investment Bank and investing for growth1.
Allocated capital based on the average of 13.5% RWA and 4.25% Leverage Exposure2. Client Energy Transition Framework (CETF) reflects CS methodology to assess the climate transition readiness of our clients3. With the exception of Index Access
and APAC Delta One4. MD hires from January 1, 2021 to March 31, 20225. Source: Dealogic as of March 31, 2022 6. Source: Source CMBS Alert as of March 31, 20227. Source: Tradeweb as of March 31, 2022Slide 12 Swiss Bank building on its leading
positions1. Dealogic as of 31 December 20212. BCGSlide 15 Leading the bank and our clients into a sustainable future1. Environmental Finance2. Refers to Credit Suisse’s assets managed according to the Credit Suisse Sustainable Investment
Framework (Sustainable AuM). This includes only AuM balances from managed solutions that to date have been mapped to a sustainability rating of 2 and higher, based on the Framework scale (0-5). The majority of this growth vs. 1Q21 has been
achieved through progress on our framework implementation and product classification. The other relevant drivers include the launch of new sustainable funds and net sales of existing sustainable funds partially offset by market performance3.
Refers to Credit Suisse Wealth Management Global Lead Offering funds (including both CS and Third Party Funds) that, as of March 31, 2022, have been mapped to a sustainability classification of 2 and higher, based on the CS Sustainable
Investments Framework scale (0-5)
Footnotes 39 Slide 18 We have significantly reduced our Russia credit exposure1. Exposure is net of
specific allowances, specific provisions for credit losses and valuation adjustments2. Post risk mitigation including hedges (derivatives), guarantees, insurance and collateralSlide 20 Wealth Management and Private Banking Switzerland CBV
impacted by adverse market movement; positive NNA across all regions1. Structural effects, including certain de-risking measures and CHF 10.4 bn related to the sanctions imposed in connection with Russia’s invasion of UkraineSlide 21 Resilient
CET1 capital and leverage ratios1. FX impact from January to March FX rates2. With the exception of Index Access and APAC Delta OneSlide 22 Positive gearing to rising USD interest rates1. As of March 31, 2022Slide 23 Wealth Management1.
Includes other revenues of CHF (6) mn in 1Q22, CHF (2) mn in 4Q21 and CHF (2) mn in 1Q212. 1Q22 mark-to-market losses of CHF (34) mn (net of CHF 7 mn of hedges). 1Q21 included mark-to-market losses of CHF (3) mn (net of CHF 4 mn of hedges)Slide
24 Investment Bank1. Other revenues include treasury funding costs and changes in the carrying value of certain investments2. Source: Dealogic as of March 31, 2022 3. With the exception of Index Access and APAC Delta One 4. Third Party
competitive analysis as of FY 20215. Archegos impact includes revenues of USD 19 mn, credit provisions release of USD (167) mn and expenses of USD 12 mn
Footnotes 40 Slide 25 Swiss Bank1. Includes other revenues of CHF (26) mn in 1Q22, CHF (18) mn in 4Q21
and CHF (16) mn in 1Q21Slide 31 Corporate Center1. Other revenues primarily include required elimination adjustments associated with trading in own shares, treasury commissions charged to divisions, the cost of certain hedging transactions
executed in connection with the Group's RWAs and valuation hedging impacts from long-dated legacy deferred compensation and retirement programs mainly relating to former employees Slide 32 Oil & Gas / Leveraged Finance exposures1. Oil &
Gas net lending exposure in Corporate Bank2. Represents non-Investment Grade underwriting exposureSlide 33 Currency mix & capital metrics1. Total expenses include provisions for credit losses2. Sensitivity analysis based on Adjusted numbers
and on weighted average exchange rates of USD/CHF of 0.92 and EUR/CHF of 1.01 for 1Q22 LTM results3. Data based on March 2022 month-end currency mix4. Reflects actual capital positions in consolidated Group legal entities (net assets) including
net asset hedges less applicable Basel III regulatory adjustments (e.g. goodwill)
Signatures
Pursuant to the requirements of the Securities Exchange Act of 1934, the registrants
have duly caused this report to be signed on their behalf by the undersigned, thereunto
duly authorized.
CREDIT SUISSE GROUP AG and CREDIT SUISSE AG
(Registrants)
Date: April 27, 2022
By:
/s/ Thomas Gottstein /s/ David R. Mathers
Thomas Gottstein David R. Mathers
Chief Executive Officer Chief Financial Officer