
NON-GAAP 对账19未经审计的持续和已终止业务的毛利(亏损)与调整后的毛利率、燃料毛利率、每桶吞吐量的燃料毛利率和每桶吞吐量的运营费用对账。以千美元计常规可再生移动炼油厂总毛利润158,198美元(21,521)136,677美元套期保值活动的未实现(收益)亏损(4,341)(709)(5,050)库存估值调整7,447(106)7,341 调整后的毛利率 161,304美元(22,336)138,968美元归属于收入成本的可变生产成本 76,785 1368美元 035 89,820 归因于收入成本的折旧和摊销 9,477 5,338 14,815 RIN 48,583-48,583 对冲活动的已实现亏损 1,265 3,689 4,954 融资成本 3,980 263 4,243 其他收入 (12,347) (714) (13,061) 燃料毛利率289,047美元 (725) 288,322美元吞吐量(桶)75,976 3,952 79,928 燃料毛利润率每桶吞吐量 13.94 美元 (1.00) 美元 13.21 美元总运营支出 65,700美元 18,521美元 84,221美元每桶吞吐量的运营费用 3.17美元 25.61美元 3.86美元截至9月30日的九个月,2023
NON-GAAP 对账 20 未经审计的持续和已终止业务的毛利(亏损)与调整后的毛利率、燃料毛利率、每桶吞吐量的燃料毛利率和每桶吞吐量的运营费用对账。以千美元计,常规可再生移动炼油厂总毛利润6,544美元(13,006)美元(6,462)美元套期保值活动未实现(收益)亏损 849 2,913 3,762 库存估值调整(4,246)3,745(501)调整后的毛利率 3,147美元(6,348)美元(3,201)美元归属于收入成本的可变生产成本 28,686 77 28,763 折旧以及归因于收入成本的摊销额 3,351 2,018 5,369 RIN 25,410-25,410 套期保值活动的已实现亏损 (1,150) 1,288 138 融资成本 (87) 58 (29) 其他收入 (3,610) (190) (3,800) 燃料总额利润 55,747 美元 (3,097) 美元 52,650 美元吞吐量(桶)76,330 2,490 78,820 每桶吞吐量的燃料毛利率 8.03 美元 (13.66) 美元 7.34 美元总运营支出 23,299 美元 7,076 美元 30,375美元每桶吞吐量的运营费用 3.35美元 31.23美元 4.23美元截至 2023 年 6 月 30 日的三个月
NON-GAAP 对账21 未经审计的持续和已终止业务的毛利(亏损)与调整后的毛利率、燃料毛利率、每桶吞吐量的燃料毛利率和每桶吞吐量的运营费用对账。以千美元计常规可再生移动炼油厂总毛利润65,470美元-65,470美元套期保值活动未实现(收益)亏损(570)-(570)库存估值调整(1,532)-(1,532)调整后的毛利率63,368美元 -63,368美元归因于收入成本的可变生产成本 21,252-21,252 折旧和摊销归因于收入成本的可变生产成本收入 3,144-3,144 RIN 16,115-16,115 套期保值活动的已实现亏损 (439)-(439) 融资成本 2,295-2,295 其他收入 (1,933)-(1,933) 燃油毛利率 103,802美元 -103,802美元吞吐量 (bpd) 71,328-71,328 每桶吞吐量的燃料毛利率 16.17美元-16.17美元总运营支出 24,681美元 -24,681美元每桶吞吐量的运营费用 3.84美元 -3.84美元截至2023年3月31日的三个月

NON-GAAP 对账 22 未经审计的息税折旧摊销前利润和调整后息税折旧摊销前利润与持续和已终止业务净亏损的对账以千计 2023 年 9 月 30 日 2023 年 9 月 30 日 2022 年 9 月 30 日净收益(亏损)19,534 美元 22,172 美元(42,421)美元 36,310 美元(47,771)折旧和摊销 8,71 美元 929 5,623 22,085 13,157 27,847 15,088 所得税支出(福利)12,231-3,754-1,265-利息支出 13,523 13,129 103,536 65,069 118,493 67,921 息税折旧摊销前利润 54,217 美元 40,924 美元 121,268 美元 35,805 美元 183,915 美元 35,239 套期保值活动未实现(收益)亏损(8,348)(47,756)(5,233)(1,123)(4,256)(1,375)库存估值调整 9,374 17,972 7,341 41,152 衍生权证负债价值变动收益 (4,621) (12,312) (5,036)) (7,788) (5,069) (3,483) 股票薪酬 769 378 1,502 951 2,125 1,201 (收益) 出售资产亏损--(70,881)-(70,558) (1,041) 收购成本-2,889 4,308 16,526 4,309 20,092 环境清理储备--1,428-1,428 其他 132 (417) (1,022) (1,042) (8) 2,106 已调整息税折旧摊销前利润为51,523美元 1,678美元 52,247美元 85,909 美元 127,413 美元 95,318 美元截至十二个月的截至九个月的三个月止十二个月

NON-GAAP 对账 23 未经审计的息税折旧摊销前利润和调整后息税折旧摊销前利润与持续和已终止业务净亏损的对账以千美元计传统可再生能源净收益(亏损)65,161 美元(21,807)美元(1,489)美元 41,865 美元 912 美元(42,443)335 折旧和摊销 3,718 3,341 297 7,356 1,407 166 8,929 所得税支出(收益)-----31,430 31,430 利息支出 2,568 1,826-4,394 41 9,089 13,523 息税折旧摊销前利润 71,447 美元 (16,640) 美元 (1,192) 美元 53,615 美元 2,360 美元 (1,758) 美元套期保值活动未实现(收益)亏损 (4,620) (3,622) (40) (8),282) (66)-(8,348) 库存估值调整 13,225 (3,851)-9,374--9,374 衍生权证负债价值变动收益----(4,621) (4,621) 股票基薪酬----769 769(收益)资产出售损失----------其他----167 (35) 132 调整后息税折旧摊销前利润 80,052 美元 (24,113) 美元 (1,232) 美元 54,707 美元 2,461 美元 (5,645) 美元 51,523 美元截至 2023 年 9 月 30 日的三个月移动炼油厂传统炼油与营销黑油和回收公司合并

NON-GAAP 对账 24 未经审计息税折旧摊销前利润和调整后息税折旧摊销前利润与持续运营和已终止业务净亏损的对账成千上万移动炼油厂传统炼油和营销总额炼油与营销黑油公司合并净收益(亏损)18,369 美元(2,251)美元 16,118 美元 7,638 美元(1,585)美元折旧和摊销 3,693 268 3,961 1,431 5,661 23 利息支出 3,536-3,536 (2) 9,595 13,129 息税折旧摊销前利润 25,599 美元 (1,983) 美元 23,616 美元 9,067 美元 8,241 美元 40,924 美元套期保值活动未实现(收益)亏损 (46,977) (775) (47,752) (4)-(47,756) 库存估值调整 17,972-17,972--17,972 衍生权证负债价值变动收益---(12,312) (12,312) 股票薪酬---378 378 收购成本 2,889-2,889 其他--(417)-(417) 调整后的息税折旧摊销前利润 $ (517)) 美元 (2,758) 美元 (3,275) 美元 8,646 美元 (3,693) 美元 1,678 美元截至 2022 年 9 月 30 日的三个月

非公认会计准则对账25未经审计的息税折旧摊销前利润和调整后的息税折旧摊销前利润与持续和已终止业务净亏损的对账以千美元计传统可再生能源净收益(亏损)79,686 美元(42,272)美元(3,924)美元(3,924)美元 50,929 美元(111,726)美元(27,306)折旧和摊销 11,685 5,373 790 17,848 3,790 33 504 22,085 所得税支出(福利)---19,199 3,754 22,953 利息支出 10,604 2,195-12,799 126 90,612 103,536 息税折旧摊销前利润 101,975 美元 (34,704) 美元 64,137 美元 73,987 美元 (16,856) 美元未实现(收益)亏损 121,268 美元在套期保值上活动 (4,341) (709) (82) (5,132) (101)-(5,233) 库存估值调整 7,447 (106)-7,341-7,341 衍生权证负债价值变动收益----(5,036) 股票薪酬-----1,502 1,502 (收益) 出售资产亏损----(70,884) 3 (70,881) 收购成本----4,308 4,308 其他---(984) (38) (1,022) 调整后的息税折旧摊销前利润 105,081 美元 (35,519) 美元 (3,216) 美元 66,346 美元 2,018 美元 (16,117) 美元 52,247 美元截至 2023 年 9 月 30 日的九个月 Mobile Refinery Legacy 炼油与营销全面炼油与营销黑油和回收公司合并
NON-GAAP 对账26未经审计的息税折旧摊销前利润和调整后的息税折旧摊销前利润与持续和已终止业务净亏损的对账成千上万移动炼油厂传统炼油和营销总额炼油与营销黑油公司合并净收益(亏损)美元(5,593)美元(2,147)美元(7,740)美元(75,080)美元(42,421)折旧和摊销 123 4,305 729 13,157 利息支出 6,768-6,768 4 58,297 65,069 息税折旧摊销前利润 8,591 美元 (1,440) 美元 7,151 美元 44,708 美元 (16,054) 35,805 美元套期保值活动未实现(收益)亏损 (76) (68) (144) (144) (979)-(1,123) 库存估值调整 41,152-41,152--41,152 衍生权证负债价值变动收益---(7,788) 股票薪酬---951 951 收购成本 11,967-11,967-4,559 16,526 环境清理储备金 1,428-1,428-1,428-1,428 其他---(1,042)-(1,042) 调整后的息税折旧摊销前利润63,062美元 (1,508) 美元 61,554 美元 42,687 美元 (18,332) 美元 85,909 美元截至2022年9月30日的九个月

非公认会计准则对账 27 未经审计的长期债务与净长期债务和净杠杆率的对账以千计 2023 年 9 月 30 日 2022 年 9 月 30 日 2022 年 12 月 31 日长期债务:优先可转换票据 15,230 美元 95,178 美元 95,178 美元定期贷款 2025 148,013 165,5,000 长期融资租赁负债长期 66,751 44,339 45,164 短期融资租赁负债 2,297 1,155 1,363 保险费融资 10,071 10,449 5,602 长期债务和租赁债务 242,362 美元 316,121 美元 312,307 美元未摊销的折扣和递延融资成本(29,983 美元)) (86,384) (81,918) 每份资产负债表上的长期债务和租赁债务 212,379 美元 229,737 美元 230,389 美元现金及现金等价物 (75,705) (117,464) (141,258) 限制性现金 (3,605) (4,929) 现金及现金等价物总额 (79,310 美元) (122,393) 美元 (146,187) 净长期负债 163,052美元 193,728美元 166,120 美元调整后息税折旧摊销前利润 127,413 美元 95,318 美元 161,000 美元净杠杆 1.3 倍 2.0 倍 1.0 倍截至目前

5 6 7 8 9 10 11 Jan Feb Mar Apr May Jun Jul Aug Sep Oct Nov Dec '17-'22 '17-'22 Average 2022 2023 DOMESTIC FUELS DEMAND Conventional Refined Fuels Demand Remains Strong 8 US Gasoline Demand ( MMbpd ) US Distillate Demand ( MMbpd ) 3 4 5 6 Jan Feb Mar Apr May Jun Jul Aug Sep Oct Nov Dec '17-'22 '17-'22 Average 2022 2023 Source: Bloomberg; data as of 10/26/2023

DOMESTIC FUELS INVENTORIES REMAIN TIGHT Distillate Inventory Levels Remain Below 5 - Year Average, Gasoline Inventory Levels Building US Gasoline Inventories 9 ( MMbbl ) US Distillate Inventories ( MMbbl ) Source: Bloomberg; data as of 10/26/2023 80 100 120 140 160 180 200 Jan Feb Mar Apr May Jun Jul Aug Sep Oct Nov Dec '17-'22 '17-'22 Average 2022 2023 200 210 220 230 240 250 260 270 280 Jan Feb Mar Apr May Jun Jul Aug Sep Oct Nov Dec '17-'22 '17-'22 Average 2022 2023

DOMESTIC FUELS PRODUCTION LEVELS Production Levels In - Line With Historical Averages US Conventional Gasoline Production 10 ( MMbpd ) US Distillate Production ( MMbpd ) Source: Bloomberg; data as of 10/26/2023 2.5 3.0 3.5 4.0 4.5 5.0 5.5 6.0 6.5 Jan Feb Mar Apr May Jun Jul Aug Sep Oct Nov Dec '17-'22 '17-'22 Average 2022 2023 5.0 6.0 7.0 8.0 9.0 10.0 11.0 12.0 Jan Feb Mar Apr May Jun Jul Aug Sep Oct Nov Dec '17-'22 '17-'22 Average 2022 2023

$1.50 $1.75 $2.00 $2.25 $2.50 $2.75 $3.00 $/Gal COMMODITIES FUTURES MARKETS Gasoline & Diesel Futures Pricing Reflects More Normalized Margin Environment In 2024 11 Gasoline Monthly Futures Price ($/Gal) ULSD Monthly Futures Price ($/Gal) $2.00 $2.20 $2.40 $2.60 $2.80 $3.00 $/Gal FY 2024 4Q24 3Q24 2Q24 1Q24 FY 2023 4Q23 3Q23 2Q23 1Q23 $2.34 $2.17 $2.41 $2.48 $2.28 $2.52 $2.41 $2.69 $2.61 $2.37 Gasoline ($/gal) $2.66 $2.60 $2.62 $2.66 $2.76 $2.86 $2.62 $3.00 $2.65 $3.17 ULSD ($/gal) $80.11 $77.68 $79.13 $80.91 $82.77 $78.86 $79.12 $82.03 $76.22 $78.00 WTI Crude ($/Bbl) Source: Bloomberg; data as of 10/26/2023
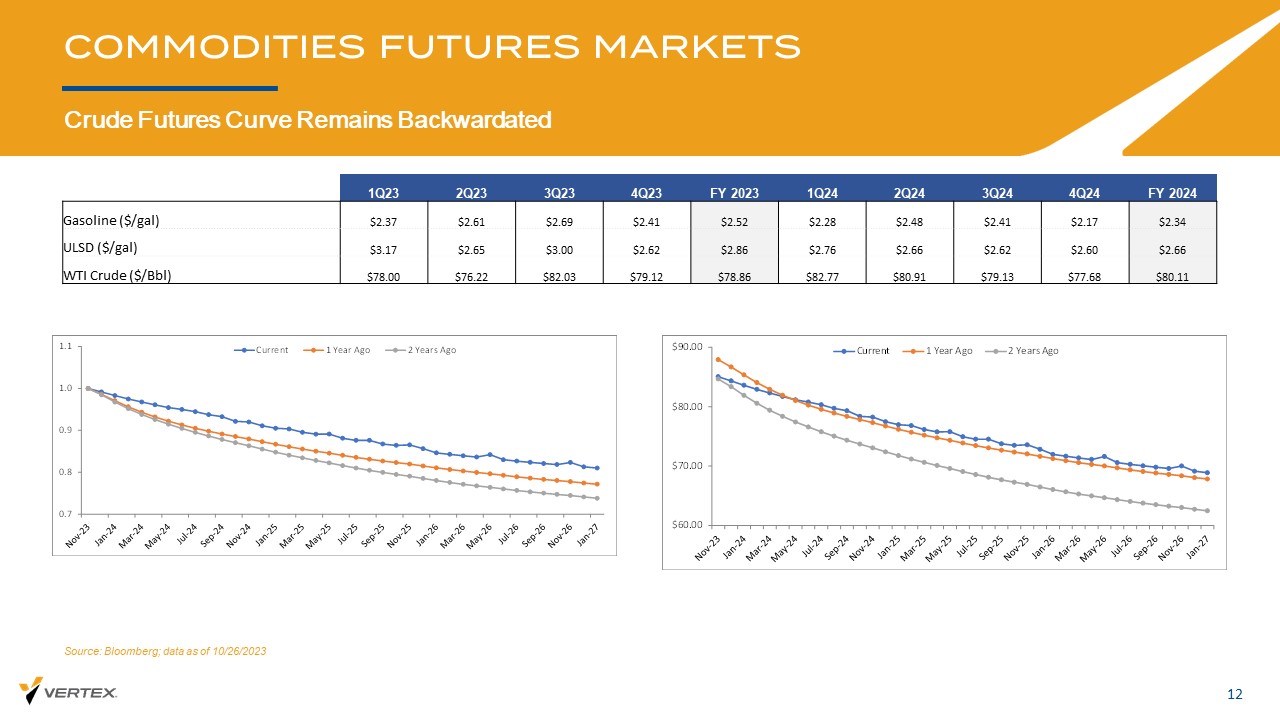
Crude Futures Curve Remains Backwardated 12 COMMODITIES FUTURES MARKETS FY 2024 4Q24 3Q24 2Q24 1Q24 FY 2023 4Q23 3Q23 2Q23 1Q23 $2.34 $2.17 $2.41 $2.48 $2.28 $2.52 $2.41 $2.69 $2.61 $2.37 Gasoline ($/gal) $2.66 $2.60 $2.62 $2.66 $2.76 $2.86 $2.62 $3.00 $2.65 $3.17 ULSD ($/gal) $80.11 $77.68 $79.13 $80.91 $82.77 $78.86 $79.12 $82.03 $76.22 $78.00 WTI Crude ($/Bbl) 0.7 0.8 0.9 1.0 1.1 Current 1 Year Ago 2 Years Ago $60.00 $70.00 $80.00 $90.00 Current 1 Year Ago 2 Years Ago Source: Bloomberg; data as of 10/26/2023
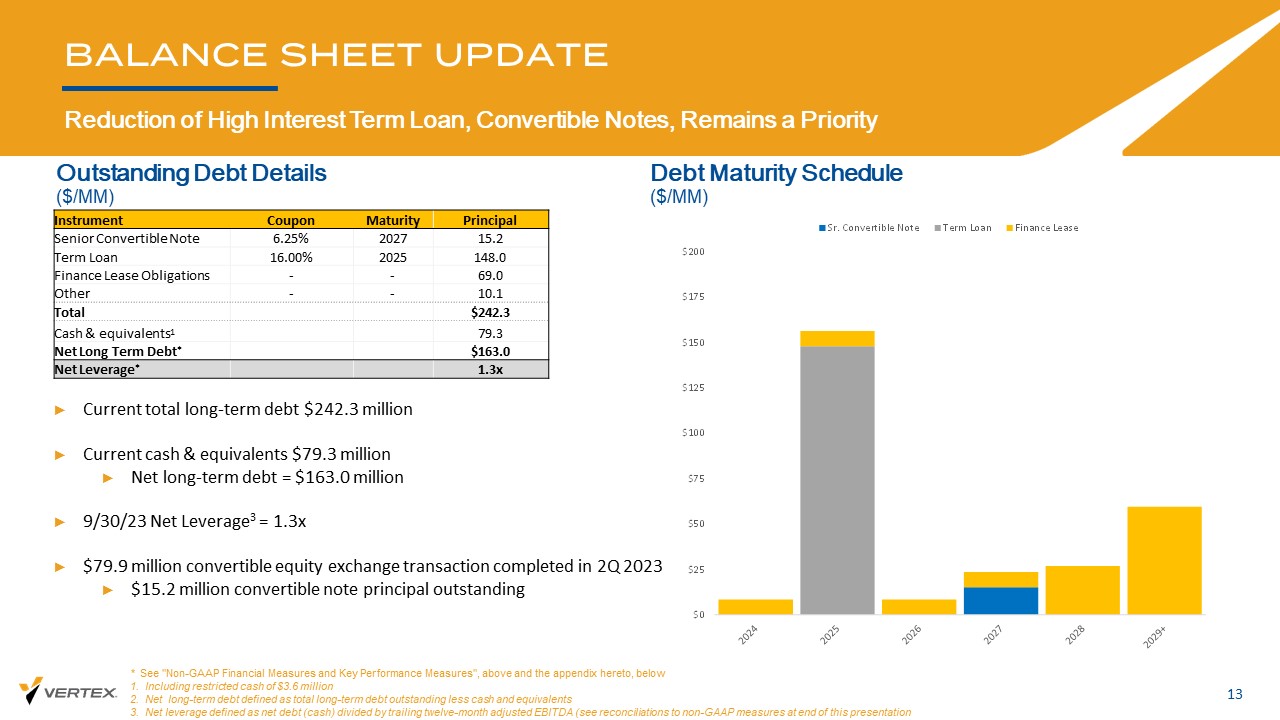
BALANCE SHEET UPDATE Reduction of High Interest Term Loan, Convertible Notes, Remains a Priority 13 Outstanding Debt Details ($/MM) Debt Maturity Schedule ($/MM) ► Current total long - term debt $242.3 million ► Current cash & equivalents $79.3 million ► Net long - term debt = $163.0 million ► 9/30/23 Net Leverage 3 = 1.3x ► $79.9 million convertible equity exchange transaction completed in 2Q 2023 ► $15.2 million convertible note principal outstanding * See "Non - GAAP Financial Measures and Key Performance Measures", above and the appendix hereto, below 1. Including restricted cash of $3.6 million 2. Net long - term debt defined as total long - term debt outstanding less cash and equivalents 3. Net leverage defined as net debt (cash) divided by trailing twelve - month adjusted EBITDA (see reconciliations to non - GAAP me asures at end of this presentation Principal Maturity Coupon Instrument 15.2 2027 6.25% Senior Convertible Note 148.0 2025 16.00% Term Loan 69.0 - - Finance Lease Obligations 10.1 - - Other $242.3 Total 79.3 Cash & equivalents 1 $163.0 Net Long Term Debt * 1.3x Net Leverage * $0 $25 $50 $75 $100 $125 $150 $175 $200 Sr. Convertible Note Term Loan Finance Lease
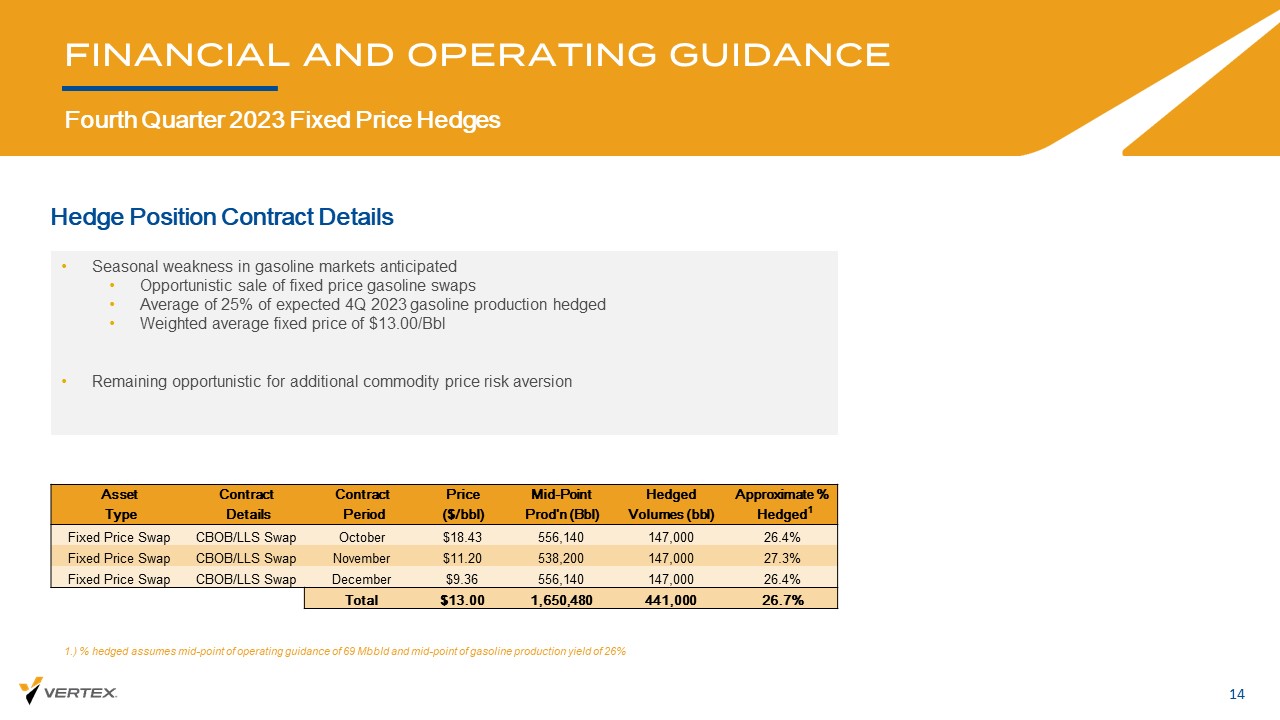
Hedge Position Contract Details FINANCIAL AND OPERATING GUIDANCE Fourth Quarter 2023 Fixed Price Hedges 14 • Seasonal weakness in gasoline markets anticipated • Opportunistic sale of fixed price gasoline swaps • Average of 25% of expected 4Q 2023 gasoline production hedged • Weighted average fixed price of $13.00/ Bbl • Remaining opportunistic for additional commodity price risk aversion 1.) % hedged assumes mid - point of operating guidance of 69 Mbbld and mid - point of gasoline production yield of 26% Approximate % Hedged Mid - Point Price Contract Contract Asset Hedged 1 Volumes (bbl) Prod'n (Bbl) ($/bbl) Period Details Type 26.4% 147,000 556,140 $18.43 October CBOB/LLS Swap Fixed Price Swap 27.3% 147,000 538,200 $11.20 November CBOB/LLS Swap Fixed Price Swap 26.4% 147,000 556,140 $9.36 December CBOB/LLS Swap Fixed Price Swap 26.7% 441,000 1,650,480 $13.00 Total

Projected Financial Guidance COMMODITY PRICE RISK MANAGEMENT Fourth Quarter 2023 Outlook 15 Management Commentary • For the fourth quarter 2023, the Company expects the Mobile Refinery to generate total throughput of between 68,000 to 71,000 bpd, reflecting between 91% and 95% total conventional facility capacity utilization. Reduced outlook for conventional throughput volumes reflects: • Planned downtime to proactively perform certain maintenance / repair operations • Downtime for Pitstop on crude unit #1 • Management expects 64% to 68% of its refined product output to be higher - value finished products such as gasoline, diesel and Jet fuel, with the remainder reflecting intermediate and other products • Vertex expects direct operating expense per barrel for consolidated operations of between $3.95 to $4.20 per barrel in the fourth quarter 2023 • Vertex anticipates total consolidated capital expenditures of between $15 million and $20 million in the fourth quarter 2023 Fourth Quarter 2023 Fourth Quarter 2023 1.) Finished products include gasoline, ULSD, and Jet A 2.) Intermediate & Other products include Vacuum Gas Oil (VGO), Liquified Petroleum Gases (LPGs), and Vacuum Tower Bottoms (V TBs ) 4Q 2023 Conventional Fuels High Low Operational: 71.0 68.0 Mobile Refinery Conventional Throughput Volume (Mbpd) 95% 91% Capacity Utilization Production Yield Profile: 68% 64% Percentage Finished Products 1 32% 36% Intermediate & Other Products 2 4Q 2023 Renewable Fuels High Low Operational: 6.0 4.0 Mobile Refinery Renewable Throughput Volume (Mbpd) 75% 50% Capacity Utilization 98% 97% Production Yield 2% 3% Yield Loss 4Q 2023 Consolidated High Low Operational: 77.0 72.0 Mobile Refinery Total Throughput Volume (Mbpd) 93% 87% Capacity Utilization Financial Guidance: $4.20 $3.95 Direct Operating Expense ($/bbl) $20.00 $15.00 Capital Expenditures ($/MM)
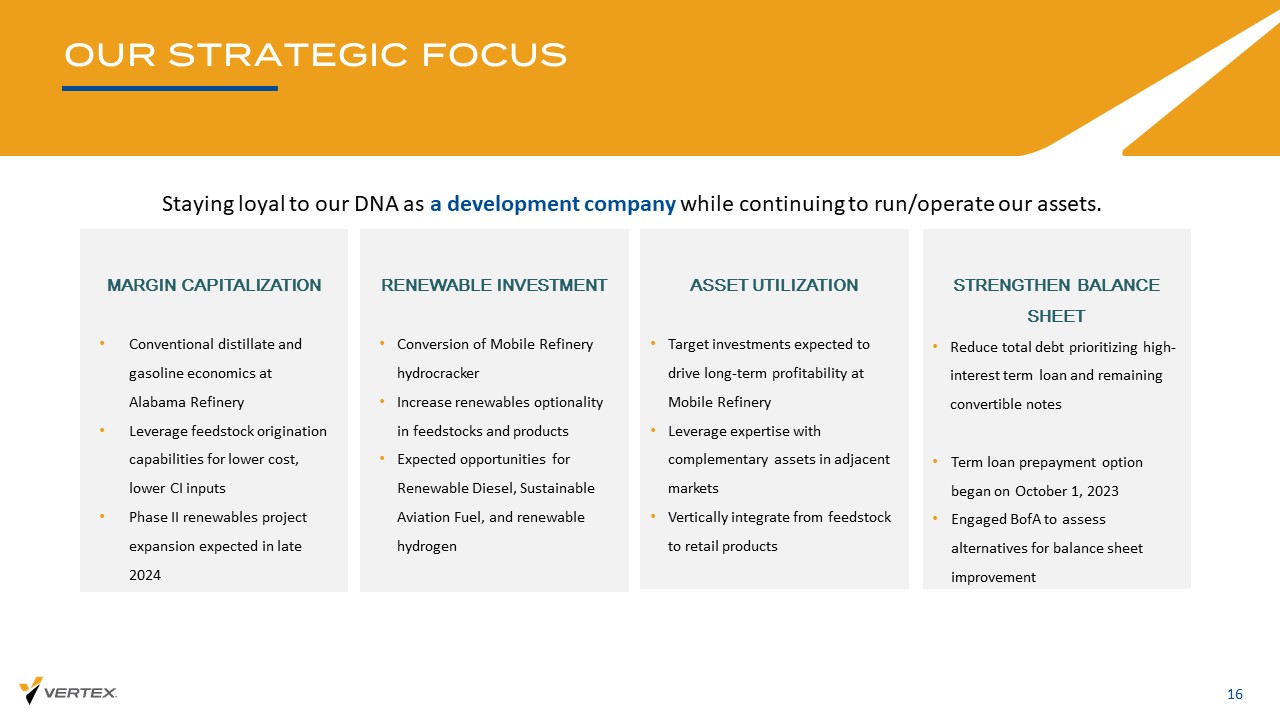
OUR STRATEGIC FOCUS 16 ASSET UTILIZATION • Target investments expected to drive long - term profitability at Mobile Refinery • Leverage expertise with complementary assets in adjacent markets • Vertically integrate from feedstock to retail products MARGIN CAPITALIZATION • Conventional distillate and gasoline economics at Alabama Refinery • Leverage feedstock origination capabilities for lower cost, lower CI inputs • Phase II renewables project expansion expected in late 2024 RENEWABLE INVESTMENT • Conversion of Mobile Refinery hydrocracker • Increase renewables optionality in feedstocks and products • Expected opportunities for Renewable Diesel, Sustainable Aviation Fuel, and renewable hydrogen STRENGTHEN BALANCE SHEET • Reduce total debt prioritizing high - interest term loan and remaining convertible notes • Term loan prepayment option began on October 1, 2023 • Engaged BofA to assess alternatives for balance sheet improvement Staying loyal to our DNA as a development company while continuing to run/operate our assets.

APPENDIX

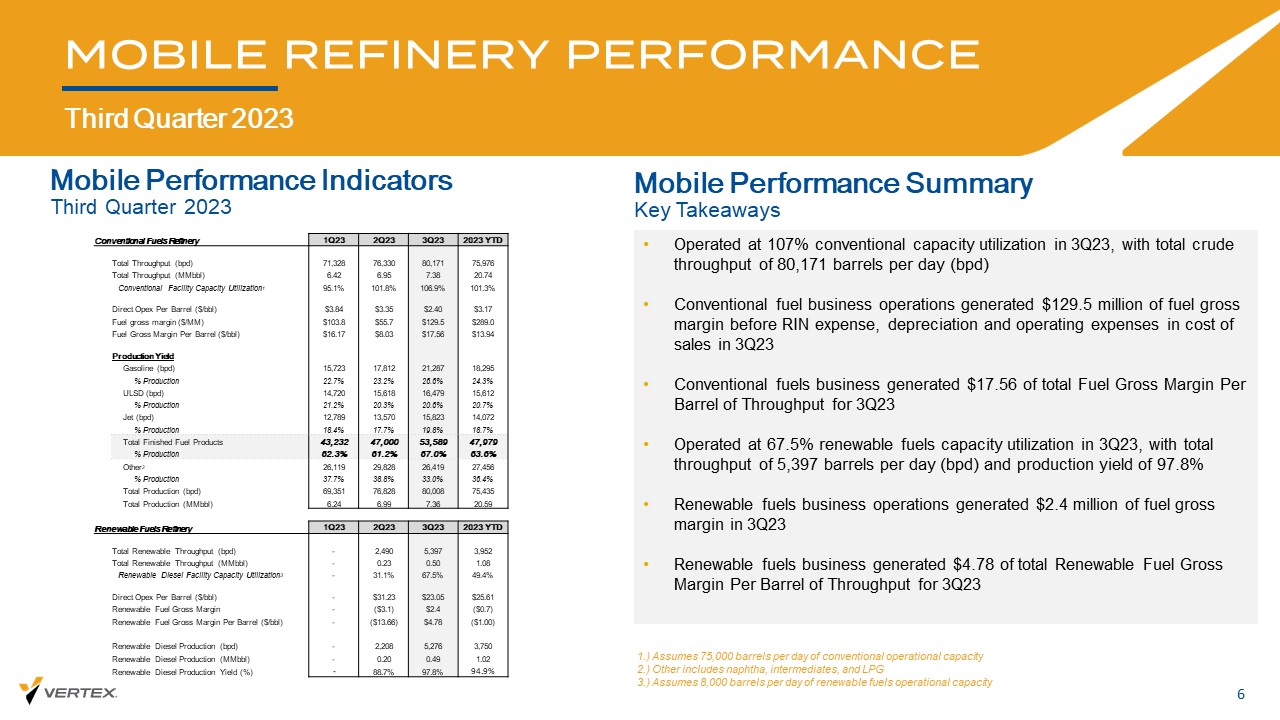
NON - GAAP RECONCILIATION 18 Unaudited Reconciliation of Gross Profit (Loss) From Continued and Discontinued Operations to Adjusted Gross Margin, Fuel Gross Margin, Fuel Gross Margin Per Barrel of Throughput and Operating Expenses Per Barrel of Throughput. In thousands Conventional Renewable Mobile Refinery Total Gross profit 86,185$ (8,515)$ 77,670$ Unrealized (gain) loss on hedging activities (4,620) (3,622) (8,242) Inventory valuation adjustments 13,225 (3,851) 9,374 Adjusted gross margin 94,790$ (15,988)$ 78,802$ Variable production costs attributable to cost of revenues 26,847 12,958 39,805 Depreciation and amortization attributable to cost of revenues 2,982 3,320 6,302 RINs 7,058 - 7,058 Realized loss on hedging activities 2,854 2,401 5,255 Financing costs 1,772 205 1,977 Other revenues (6,804) (524) (7,328) Fuel gross margin 129,499$ 2,372$ 131,871$ Throughput (bpd) 80,171 5,397 85,568 Fuel gross margin per barrel of throughput 17.56$ 4.78$ 16.75$ Total OPEX 17,720$ 11,445$ 29,165$ Operating expenses per barrel of throughput 2.40$ 23.05$ 3.70$ Three Months Ended September 30, 2023
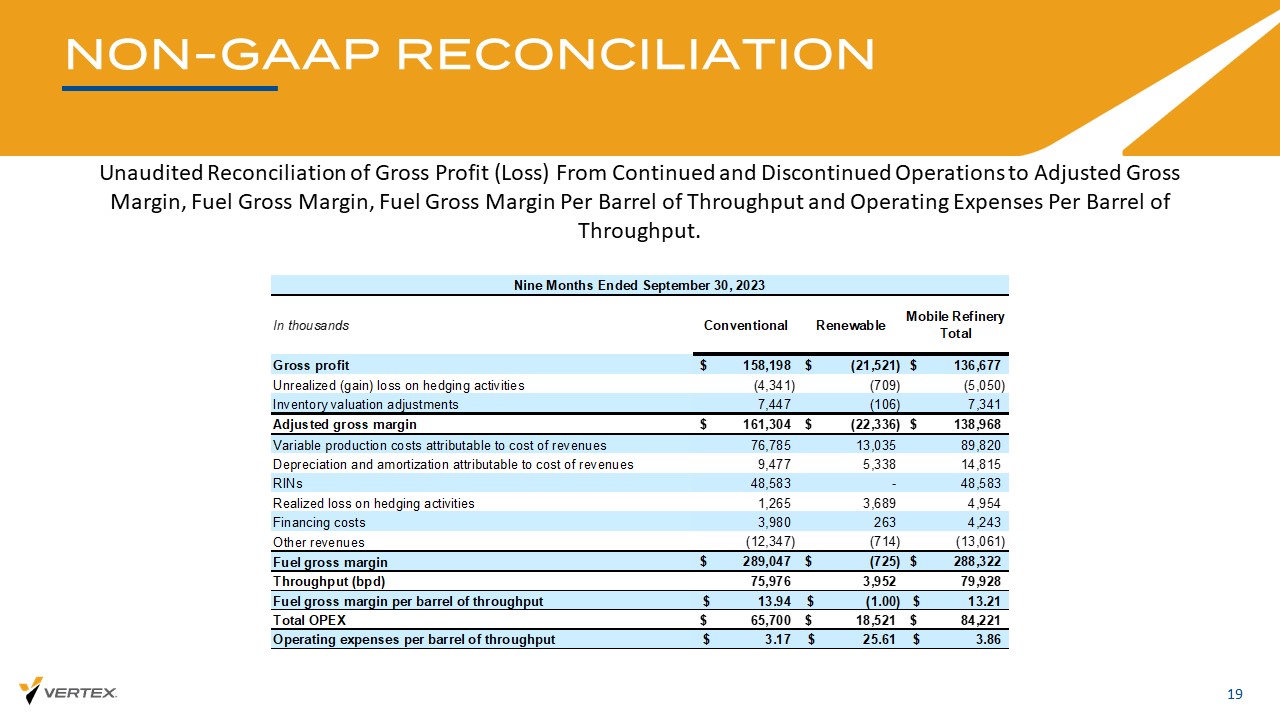
NON - GAAP RECONCILIATION 19 Unaudited Reconciliation of Gross Profit (Loss) From Continued and Discontinued Operations to Adjusted Gross Margin, Fuel Gross Margin, Fuel Gross Margin Per Barrel of Throughput and Operating Expenses Per Barrel of Throughput. In thousands Conventional Renewable Mobile Refinery Total Gross profit 158,198$ (21,521)$ 136,677$ Unrealized (gain) loss on hedging activities (4,341) (709) (5,050) Inventory valuation adjustments 7,447 (106) 7,341 Adjusted gross margin 161,304$ (22,336)$ 138,968$ Variable production costs attributable to cost of revenues 76,785 13,035 89,820 Depreciation and amortization attributable to cost of revenues 9,477 5,338 14,815 RINs 48,583 - 48,583 Realized loss on hedging activities 1,265 3,689 4,954 Financing costs 3,980 263 4,243 Other revenues (12,347) (714) (13,061) Fuel gross margin 289,047$ (725)$ 288,322$ Throughput (bpd) 75,976 3,952 79,928 Fuel gross margin per barrel of throughput 13.94$ (1.00)$ 13.21$ Total OPEX 65,700$ 18,521$ 84,221$ Operating expenses per barrel of throughput 3.17$ 25.61$ 3.86$ Nine Months Ended September 30, 2023

NON - GAAP RECONCILIATION 20 Unaudited Reconciliation of Gross Profit (Loss) From Continued and Discontinued Operations to Adjusted Gross Margin, Fuel Gross Margin, Fuel Gross Margin Per Barrel of Throughput and Operating Expenses Per Barrel of Throughput. In thousands Conventional Renewable Mobile Refinery Total Gross profit 6,544$ (13,006)$ (6,462)$ Unrealized (gain) loss on hedging activities 849 2,913 3,762 Inventory valuation adjustments (4,246) 3,745 (501) Adjusted gross margin 3,147$ (6,348)$ (3,201)$ Variable production costs attributable to cost of revenues 28,686 77 28,763 Depreciation and amortization attributable to cost of revenues 3,351 2,018 5,369 RINs 25,410 - 25,410 Realized loss on hedging activities (1,150) 1,288 138 Financing costs (87) 58 (29) Other revenues (3,610) (190) (3,800) Fuel gross margin 55,747$ (3,097)$ 52,650$ Throughput (bpd) 76,330 2,490 78,820 Fuel gross margin per barrel of throughput 8.03$ (13.66)$ 7.34$ Total OPEX 23,299$ 7,076$ 30,375$ Operating expenses per barrel of throughput 3.35$ 31.23$ 4.23$ Three Months Ended June 30, 2023
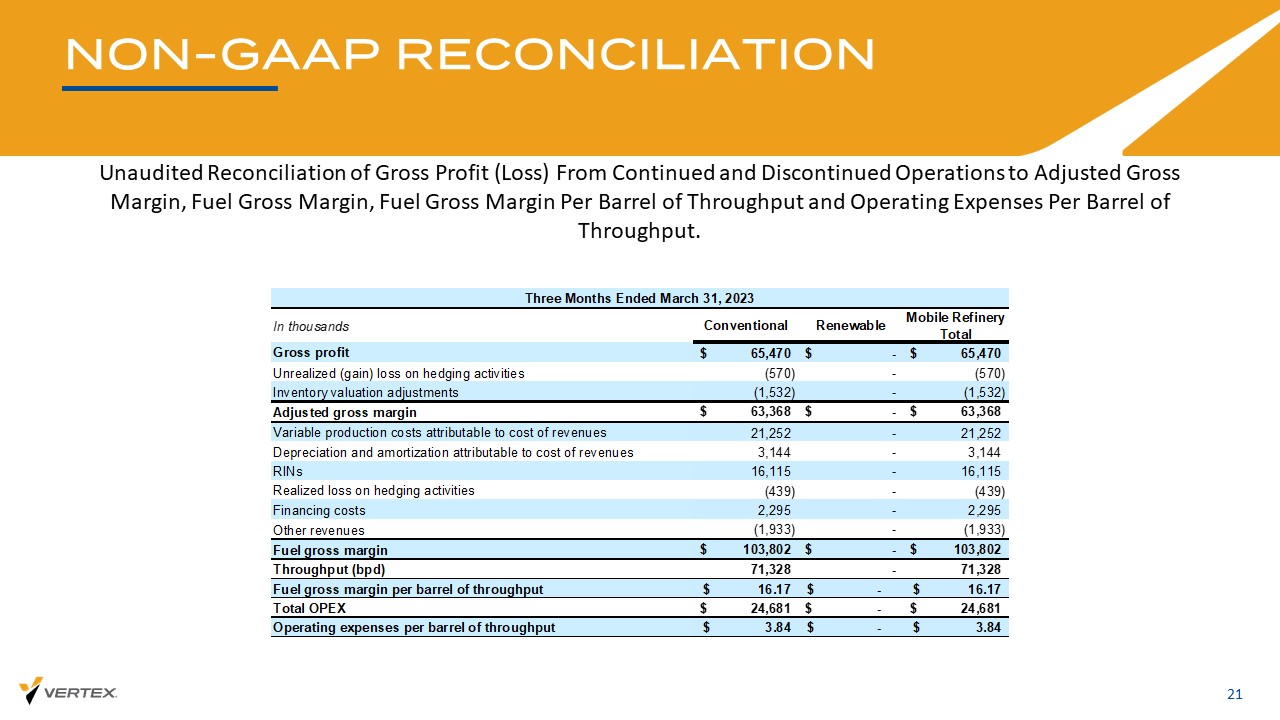
NON - GAAP RECONCILIATION 21 Unaudited Reconciliation of Gross Profit (Loss) From Continued and Discontinued Operations to Adjusted Gross Margin, Fuel Gross Margin, Fuel Gross Margin Per Barrel of Throughput and Operating Expenses Per Barrel of Throughput. In thousands Conventional Renewable Mobile Refinery Total Gross profit 65,470$ -$ 65,470$ Unrealized (gain) loss on hedging activities (570) - (570) Inventory valuation adjustments (1,532) - (1,532) Adjusted gross margin 63,368$ -$ 63,368$ Variable production costs attributable to cost of revenues 21,252 - 21,252 Depreciation and amortization attributable to cost of revenues 3,144 - 3,144 RINs 16,115 - 16,115 Realized loss on hedging activities (439) - (439) Financing costs 2,295 - 2,295 Other revenues (1,933) - (1,933) Fuel gross margin 103,802$ -$ 103,802$ Throughput (bpd) 71,328 - 71,328 Fuel gross margin per barrel of throughput 16.17$ -$ 16.17$ Total OPEX 24,681$ -$ 24,681$ Operating expenses per barrel of throughput 3.84$ -$ 3.84$ Three Months Ended March 31, 2023

NON - GAAP RECONCILIATION 22 Unaudited Reconciliation of EBITDA and Adjusted EBITDA to Net loss from Continued and Discontinued Operations In thousands September 30, 2023 September 30, 2022 September 30, 2023 September 30, 2022 September 30, 2023 September 30, 2022 Net income (loss) $ 19,534 $ 22,172 $ (8,107) $ (42,421) $ 36,310 $ (47,771) Depreciation and amortization 8,929 5,623 22,085 13,157 27,847 15,088 Income tax expense (benefit) 12,231 - 3,754 - 1,265 - Interest expense 13,523 13,129 103,536 65,069 118,493 67,921 EBITDA $ 54,217 $ 40,924 $ 121,268 $ 35,805 $ 183,915 $ 35,239 Unrealized (gain) loss on hedging activities (8,348) (47,756) (5,233) (1,123) (4,256) (1,375) Inventory valuation adjustments 9,374 17,972 7,341 41,152 16,955 41,152 Gain on change in value of derivative warrant liability (4,621) (12,312) (5,036) (7,788) (5,069) (3,483) Stock-based compensation 769 378 1,502 951 2,125 1,201 (Gain) loss on sale of assets - - (70,881) - (70,558) (1,041) Acquisition costs - 2,889 4,308 16,526 4,309 20,092 Environmental clean-up reserve - - - 1,428 - 1,428 Other 132 (417) (1,022) (1,042) (8) 2,106 Adjusted EBITDA $ 51,523 $ 1,678 $ 52,247 $ 85,909 $ 127,413 $ 95,318 Three Months Ended Nine Months Ended Twelve Months Ended

NON - GAAP RECONCILIATION 23 Unaudited Reconciliation of EBITDA and Adjusted EBITDA to Net loss from Continued and Discontinued Operations In thousands Conventional Renewable Net income (loss) $ 65,161 $ (21,807) $ (1,489) $ 41,865 $ 912 $ (42,443) $ 335 Depreciation and amortization 3,718 3,341 297 7,356 1,407 166 8,929 Income tax expense (benefit) - - - - - 31,430 31,430 Interest expense 2,568 1,826 - 4,394 41 9,089 13,523 EBITDA $ 71,447 $ (16,640) $ (1,192) $ 53,615 $ 2,360 $ (1,758) $ 54,217 Unrealized (gain) loss on hedging activities (4,620) (3,622) (40) (8,282) (66) - (8,348) Inventory valuation adjustments 13,225 (3,851) - 9,374 - - 9,374 Gain on change in value of derivative warrant liability - - - - - (4,621) (4,621) Stock-based compensation - - - - - 769 769 (Gain) loss on sale of assets - - - - - - - Acquisition costs - - - - - - - Other - - - - 167 (35) 132 Adjusted EBITDA $ 80,052 $ (24,113) $ (1,232) $ 54,707 $ 2,461 $ (5,645) $ 51,523 Three Months Ended September 30, 2023 Mobile Refinery Legacy Refining & Marketing Total Refining & Marketing Black Oil and Recovery Corporate Consolidated

NON - GAAP RECONCILIATION 24 Unaudited Reconciliation of EBITDA and Adjusted EBITDA to Net loss from Continued and Discontinued Operations In thousands Mobile Refinery Legacy Refining & Marketing Total Refining & Marketing Black Oil Corporate Consolidated Net income (loss) $ 18,369 $ (2,251) $ 16,118 $ 7,638 $ (1,585) $ 22,171 Depreciation and amortization 3,693 268 3,961 1,431 231 5,623 Interest expense 3,536 - 3,536 (2) 9,595 13,129 EBITDA $ 25,599 $ (1,983) $ 23,616 $ 9,067 $ 8,241 $ 40,924 Unrealized (gain) loss on hedging activities (46,977) (775) (47,752) (4) - (47,756) Inventory valuation adjustments 17,972 - 17,972 - - 17,972 Gain on change in value of derivative warrant liability - - - - (12,312) (12,312) Stock-based compensation - - - - 378 378 Acquisition costs 2,889 - 2,889 - - 2,889 Other - - - (417) - (417) Adjusted EBITDA $ (517) $ (2,758) $ (3,275) $ 8,646 $ (3,693) $ 1,678 Three Months Ended September 30, 2022

NON - GAAP RECONCILIATION 25 Unaudited Reconciliation of EBITDA and Adjusted EBITDA to Net loss from Continued and Discontinued Operations In thousands Conventional Renewable Net income (loss) $ 79,686 $ (42,272) $ (3,924) $ 33,490 $ 50,929 $ (111,726) $ (27,306) Depreciation and amortization 11,685 5,373 790 17,848 3,733 504 22,085 Income tax expense (benefit) - - - - 19,199 3,754 22,953 Interest expense 10,604 2,195 - 12,799 126 90,612 103,536 EBITDA $ 101,975 $ (34,704) $ (3,134) $ 64,137 $ 73,987 $ (16,856) $ 121,268 Unrealized (gain) loss on hedging activities (4,341) (709) (82) (5,132) (101) - (5,233) Inventory valuation adjustments 7,447 (106) - 7,341 - - 7,341 Gain on change in value of derivative warrant liability - - - - - (5,036) (5,036) Stock-based compensation - - - - - 1,502 1,502 (Gain) loss on sale of assets - - - - (70,884) 3 (70,881) Acquisition costs - - - - - 4,308 4,308 Other - - - - (984) (38) (1,022) Adjusted EBITDA $ 105,081 $ (35,519) $ (3,216) $ 66,346 $ 2,018 $ (16,117) $ 52,247 Nine Months Ended September 30, 2023 Mobile Refinery Legacy Refining & Marketing Total Refining & Marketing Black Oil and Recovery Corporate Consolidated

NON - GAAP RECONCILIATION 26 Unaudited Reconciliation of EBITDA and Adjusted EBITDA to Net loss from Continued and Discontinued Operations In thousands Mobile Refinery Legacy Refining & Marketing Total Refining & Marketing Black Oil Corporate Consolidated Net income (loss) $ (5,593) $ (2,147) $ (7,740) $ 40,399 $ (75,080) $ (42,421) Depreciation and amortization 7,416 707 8,123 4,305 729 13,157 Interest expense 6,768 - 6,768 4 58,297 65,069 EBITDA $ 8,591 $ (1,440) $ 7,151 $ 44,708 $ (16,054) $ 35,805 Unrealized (gain) loss on hedging activities (76) (68) (144) (979) - (1,123) Inventory valuation adjustments 41,152 - 41,152 - - 41,152 Gain on change in value of derivative warrant liability - - - - (7,788) (7,788) Stock-based compensation - - - - 951 951 Acquisition costs 11,967 - 11,967 - 4,559 16,526 Environmental clean-up reserve 1,428 - 1,428 - - 1,428 Other - - - (1,042) - (1,042) Adjusted EBITDA $ 63,062 $ (1,508) $ 61,554 $ 42,687 $ (18,332) $ 85,909 Nine Months Ended September 30, 2022

NON - GAAP RECONCILIATION 27 Unaudited Reconciliation of Long - Term Debt to Net Long - Term Debt and Net Leverage In thousands September 30, 2023 September 30, 2022 December 31, 2022 Long-Term Debt: Senior Convertible Note $ 15,230 $ 95,178 $ 95,178 Term Loan 2025 148,013 165,000 165,000 Finance lease liability long-term 66,751 44,339 45,164 Finance lease liability short-term 2,297 1,155 1,363 Insurance premiums financed 10,071 10,449 5,602 Long-Term Debt and Lease Obligations $ 242,362 $ 316,121 $ 312,307 Unamortized discount and deferred financing costs (29,983) (86,384) (81,918) Long-Term Debt and Lease Obligations per Balance Sheet 212,379$ 229,737$ 230,389$ Cash and Cash Equivalents (75,705) (117,464) (141,258) Restricted Cash (3,605) (4,929) (4,929) Total Cash and Cash Equivalents $ (79,310) $ (122,393) $ (146,187) Net Long-Term Debt 163,052$ 193,728$ 166,120$ Adjusted EBITDA $ 127,413 $ 95,318 $ 161,000 Net Leverage 1.3x 2.0x 1.0x As of