| 补充财务数据2022年第3季度 |
| 2DisclaimerThispresentationcontainsstatementsthatconstitute“forward-lookingstatements,”assuchtermisdefinedinSection27AoftheSecuritiesActof1933,已修订,andSection21EoftheSecuritiesExchangeActof1934,已修订,andsuchstatementsareintendedtobecoveredbythesafeharborprovidedbythesame.Thesestatementsarebasedonmanagement’scurrentexpectationsandbeliefsandaresubjecttoanumberoftrendsanduncertaintiesthatcouldcauseactualresultstodiffermateriallyfromthosedescribedintheforward-lookingstatements;ReadyCapitalCorporation(the“Company”)cangivenoassurancethatitsexpectationswillbeattained.FactorsthatcouldcauseactualresultstodiffermateriallyfromtheCompany’sexpectationsincludethosesetforthintheRiskFactorssectionofthemostrecentAnnualReportonForm10-KfiledwiththeSECandotherreportsfiledbytheCompanywiththeSEC,副本可在证券交易委员会的网站上获得,www.sec.gov.TheCompanyundertakesnoobligationtoupdatethesestatementsforrevisionsorchangesafterthedateofthisrelease,exceptasrequiredbylaw.Thispresentationincludescertainnon-GAAPfinancialmeasures,includingDistributableearnings.Thesenon-GAAPfinancialmeasuresshouldbeconsideredonlyassupplementalto,,而不是financialmeasuresinaccordancewithGAAP.PleaserefertotheAppendixforthemostrecentGAAPinformation.Thispresentationalsocontainsmarketstatisticsandindustrydatawhicharesubjecttouncertaintyandarenotnecessarilyreflectiveofmarketconditions.ThesehavebeenderivedfromthirdpartysourcesandhavenotbeenindependentlyverifiedbytheCompanyoritsaffiliates.Allmaterialpresentediscompiledfromsourcesbelievedtobereliableandcurrent,butaccuracycannotbeguaranteed.AlldataisasofSeptember30,2022,,另有其他指示。 |
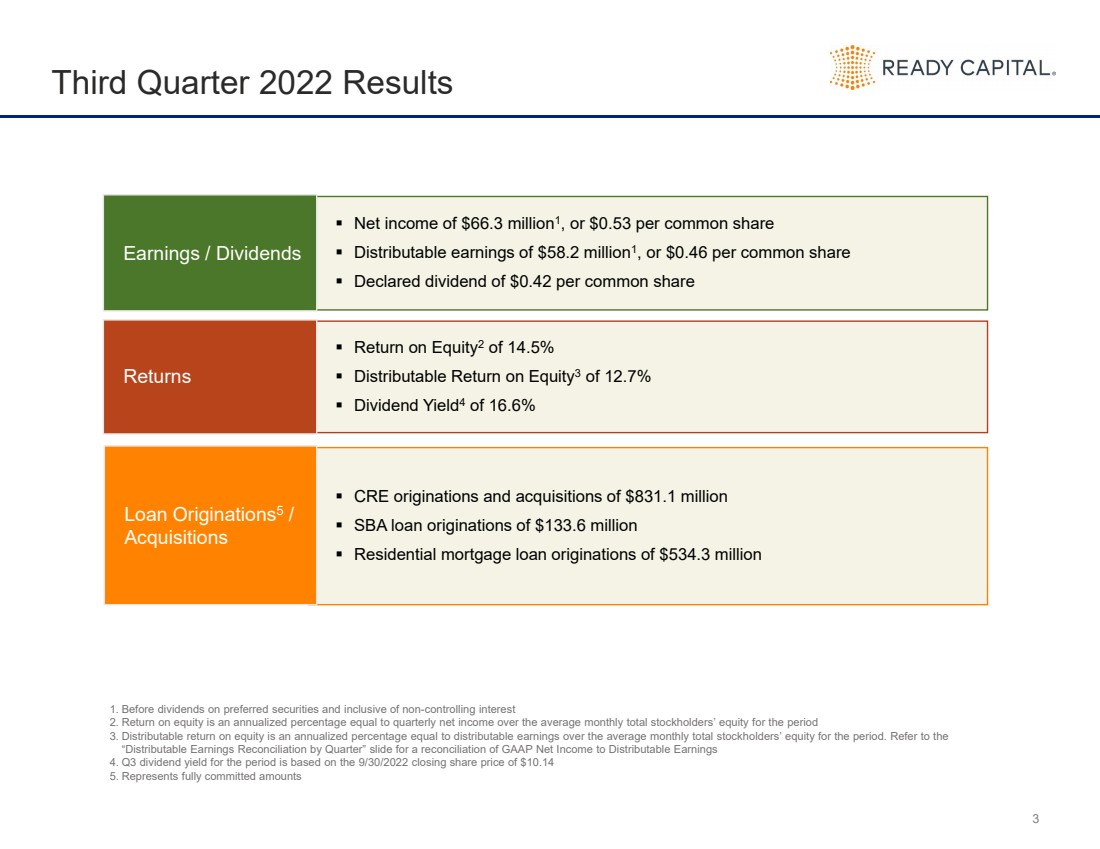
| 3 2022年第三季度业绩 净收入6630万美元1,或每股普通股0.53美元可分配收益5820万美元1,或每股普通股0.46美元宣布的股息为每股普通股0.42美元 收益/股息 股本回报率2 14.5%可分配股本回报率3 12.7%股息5/征集1.优先证券派息前包括非控股权益2股本回报率是相当于季度净收入占当期平均每月股东权益总额的年化百分比3可分配股本回报率为折合成年率相当于可分配收益占当期平均每月股东权益总额的百分比。有关GAAP净收入与可分配损益的对账,请参阅“按季度进行的可分配收益调节”幻灯片4.该期间的第三季度股息收益率基于2022年9月30日的收盘价10.145美元。代表全额承诺额 |
| 4 2022年第三季度业绩(continued) Issued$100.0millioninaggregateprincipalamountof7.375%SeniorUnsecuredNotesdue2027Fullmarkettomarketliabilitiesandcreditmarktomarketliabilitiesrepresent16%and13%oftotaldebt,respectivelyIncreasedthesizeoftheCompany‘sexistingstockrepurchaseprogrambyanadditional$25million,bringingthetotalamountauthorizedundertheprogramto$50million.TheCompanyacquiredapproximately370thousandsharesoftheCompany’scommonstockatanaveragepriceof$10.29. Capital Markets Netbookvaluepershareof$15.40percommonshareTotalleverageof4.9xandrecourseleverageratioof1.6x1 Balance Sheet TheCompanyacquiredapproximately3.6millionsharesoftheCompany’scommonstockatanaveragepriceof$10.34.Completedthesecuritizationof$860.1millionoffloatingrateSBCloansandsold$656.9millionofseniorbondswithaweightedaveragecostofdebtofSOFR+3.0% Subsequent事件1.追索权杠杆率不包括本公司无追索权的15亿美元担保借款。 |

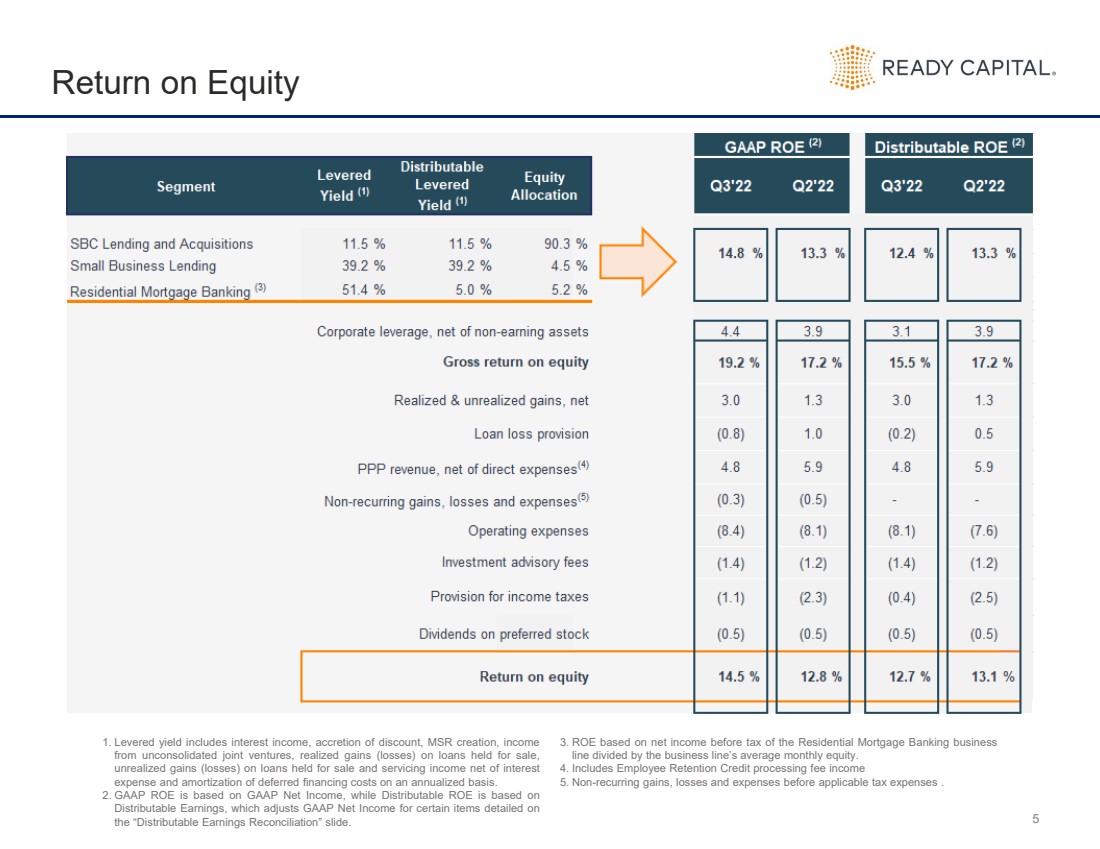
| 5股本回报率1.杠杆收益包括利息收入、贴现增量、MSR创造、合并合资企业收入、出售贷款实现收益(亏损),unrealizedgains(losses)onloansheldforsaleandservicingincomenetofinterestexpenseandamortizationofdeferredfinancingcostsonanannualizedbasis.2.GAAPROEisbasedonGAAPNetIncome,whileDistributableROEisbasedonDistributableEarnings,whichadjustsGAAPNetIncomeforcertainitemsdetailedonthe“DistributableEarningsReconciliation”slide.3.ROEbasedonnetincomebeforetaxoftheResidentialMortgageBankingbusinesslinedividedbythebusinessline’saveragemonthlyequity.4.IncludesEmployeeRetentionCreditprocessingfeeincome5.Non-recurringgains,lossesandexpensesbeforeapplicabletaxexpenses. |
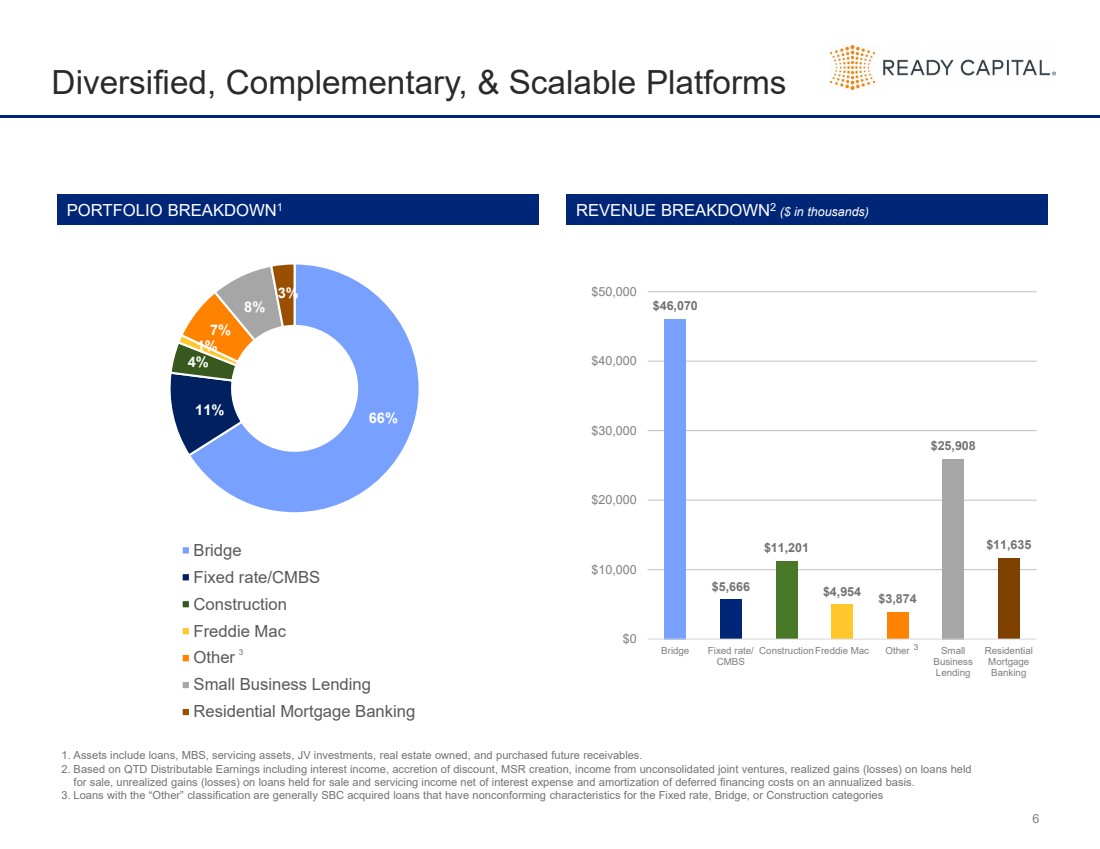
| 6多样化、互补性和可扩展的Platforms 66%11%4%1%7%8%3% Bridge Fixed利率/thousands) $46,070$5,666$11,201$4,954$3,874$25,908$11,635$0$10,000$20,000 $30,000$40,000 $50,000BridgeFixed 建筑 房地美 其他 小型企业贷款 住宅抵押贷款业务 投资组合BREAKDOWN1 收入BREAKDOWN1(以MacOtherSmallBusinessLendingResidentialMortgageBanking31.Assetsincludeloans,利率/CMBS为单位的美元)建设联邦住房抵押贷款抵押贷款证券、服务资产、合资企业投资、房地产所有、andpurchasedfuturereceivables.2.BasedonQTDDistributableEarningsincludinginterestincome,增值折扣、MSR创建、来自合并后合资企业的收入、实现贷款和销售收益(亏损)、Unrealizedgains(losses)onloansheldforsaleandservicingincomenetofinterestexpenseandamortizationofdeferredfinancingcostsonanannualizedbasis.3.Loanswiththe“Other”classificationaregenerallySBCacquiredloansthathavenonconformingcharacteristicsfortheFixedrate,桥梁或建筑类别3 |
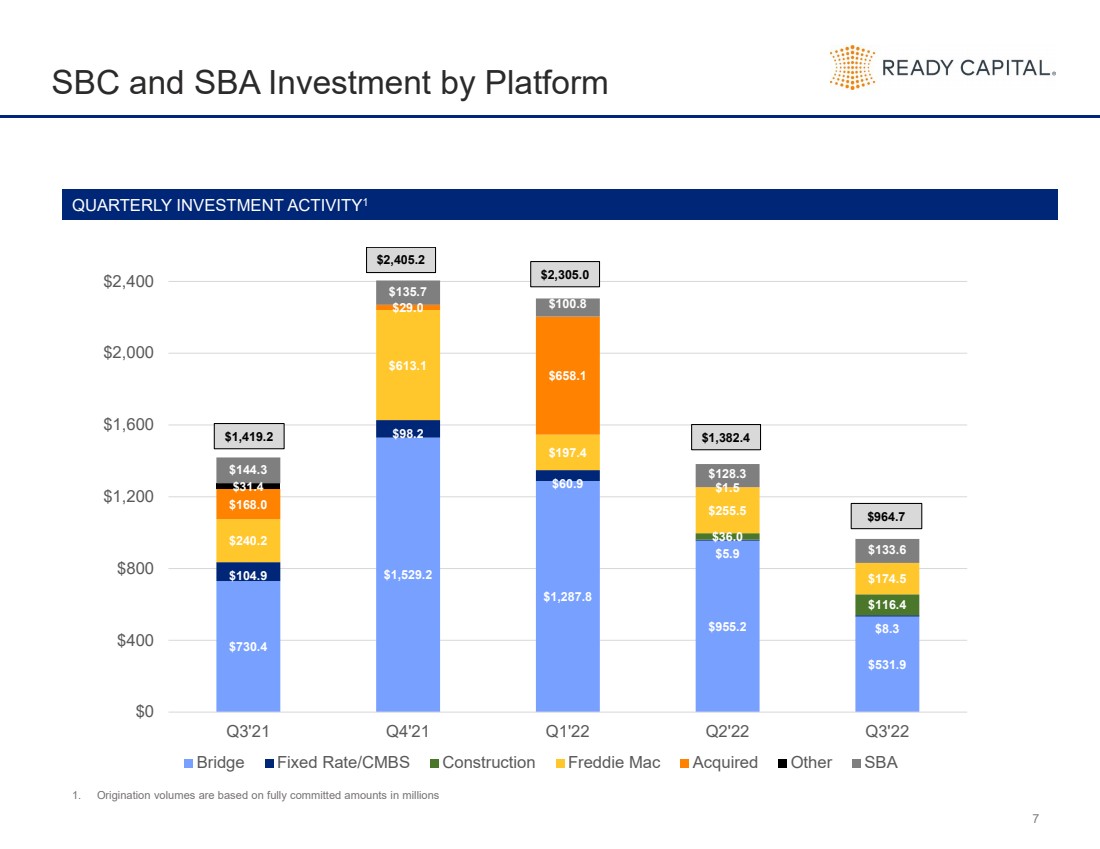
| 7SBC和SBA投资按Platform $730.4$1,529.2$1,287.8$955.2$531.9$104.9$98.2$60.9$5.9$8.3$36.0$116.4$240.2$613.1$197.4$255.5$174.5$168.0$29.0$658.1$1.5$31.4$144.3$135.7$100.8$128.3$133.6$0$400$800$1,200 $1,600 $2,000 $2,400Q3‘21Q4’21Q1‘22Q2’22Q3‘22 Bridge Fixed比率/CMBS 建筑业 房地美 收购了 其他 小企业 $2,305.0 $2,405.2 $1,419.2 $964.71.Origination数量基于完全承诺的金额(以百万为单位) 季度投资活动1 $1,382.4 |
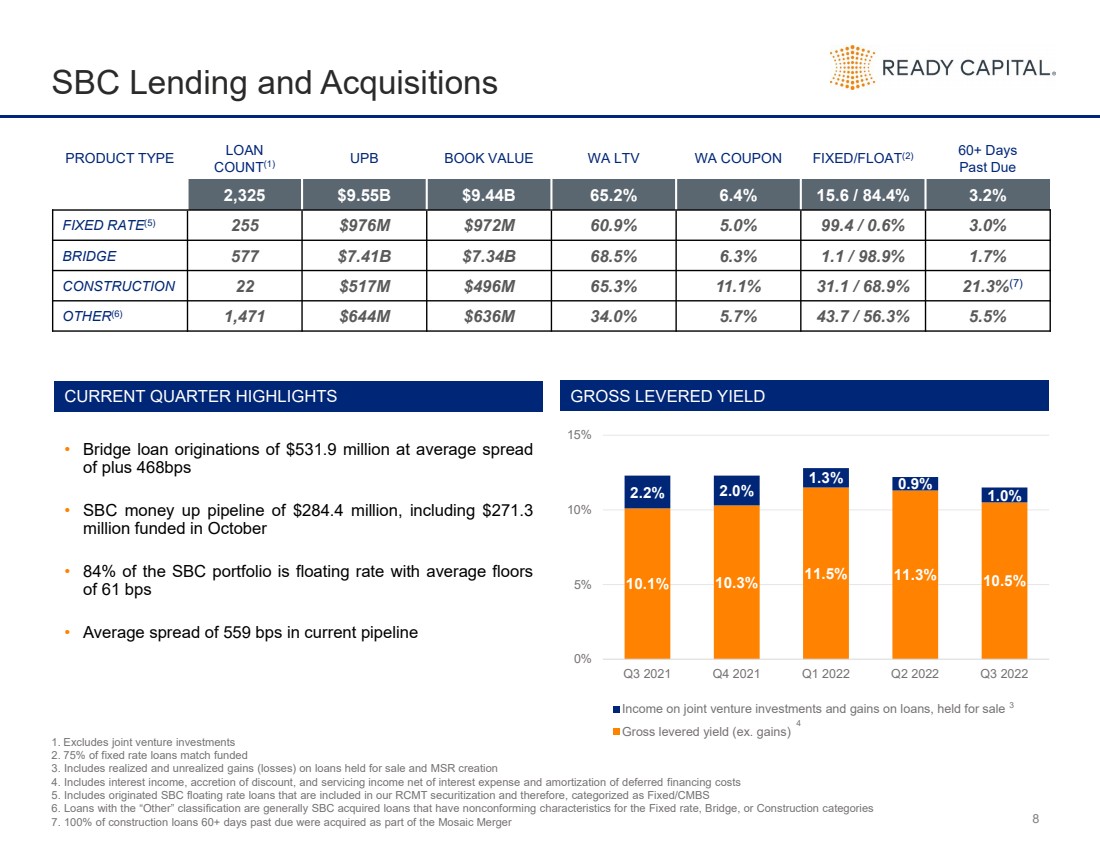
| 8SBC贷款和收购1.不包括合资企业投资2.75%的固定利率贷款匹配基金3.包括出售贷款和MSR创造的已实现和未实现收益(亏损)4。包括利息收入、增加贴现和扣除利息支出和递延融资成本摊销后的服务收入5。包括源自SBC的浮动利率贷款,这些贷款包括在我们的RCMT证券化中,因此被归类为固定/CMBS6。“其他”类别的贷款通常是SBC收购的贷款,这些贷款具有固定利率、桥梁、或建筑categories7.100%ofconstructionloans60+dayspastdue作为马赛克合并的一部分被收购 总杠杆收益率 产品类型计数(1)UPBBOOK VALUEWA LTVWA COUPONFIXED/FLOAT(2)过去60天以上Due2,325$9.55B$9.44B65.2%6.4%15.6/84.4%3.2%固定利率(5)255$9.76M$972M60.9%5.0%99.4/0.6%3.0%BRIDGE577$7.41B$7.34B66.3%1.1/98.9%1.7%CONSTRUCTION22$517M$496M65.3%11.1%31.1/68.9%21.3%(7)OTHER(6)1,471$644M$636M34.0%5.7%43.7/56.3%5.5% 本季度HIGHLIGHTS 10.1%10.3%11.5%11.3%10.5%2.2%2.0%1.3%0.9%1.0%0%5%10% 15%Q3 2021Q4 2021Q1 2022Q2 2022Q3 2022 合资企业投资收入和贷款收益,持有待售 总杠杆收益率(例如Gains)34•Bridgeloanoriginationsof$531.9millionataveragespreadofplus468bps•SBCmoneyuppipelineof$284.4million,including$271.3millionfundedinOctober•84%oftheSBCportfolioisfloatingratewithaveragefloorsof61bps•Averagespreadof559bpsincurrentpipeline |
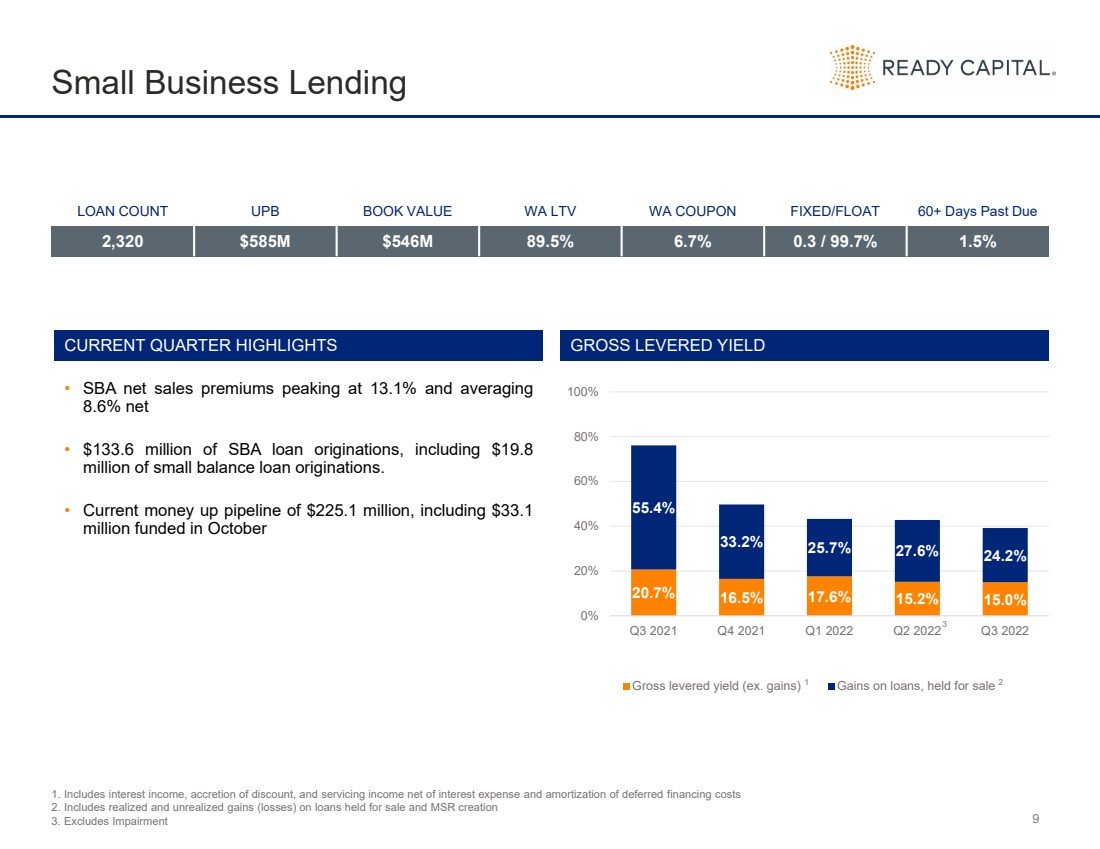
| 9小企业贷款 总杠杆收益率 贷款COUNTUPBBOOK VALUEWA LTVWA COUPONFIXED/FLOAT60天以上Due2,320$585M$546M89.5%6.7%0.3/99.7%1.5% 当前季度HIGHLIGHTS 20.7%16.5%17.6%15.2%15.0%55.4%33.2%25.7%27.6%24.2%0%20%40%60%80%100%Q3 2021Q4 2021Q1 2022Q2 2022Q3 2022 总杠杆收益率(例如收益) 贷款收益,持有出售1。包括利息收入、贴现增加和扣除利息支出和递延融资成本摊销后的服务收入2。包括出售贷款和MSR创造的已实现和未实现收益(亏损)3。不包括Impairment21•SBAnetsalespremiumspeakingat13.1%andaveraging8.6%net•$133.6millionofSBAloanoriginations,including$19.8millionofsmallbalanceloanoriginations.•Currentmoneyuppipelineof$225.1million,,包括10月3日3310万美元的资金 |
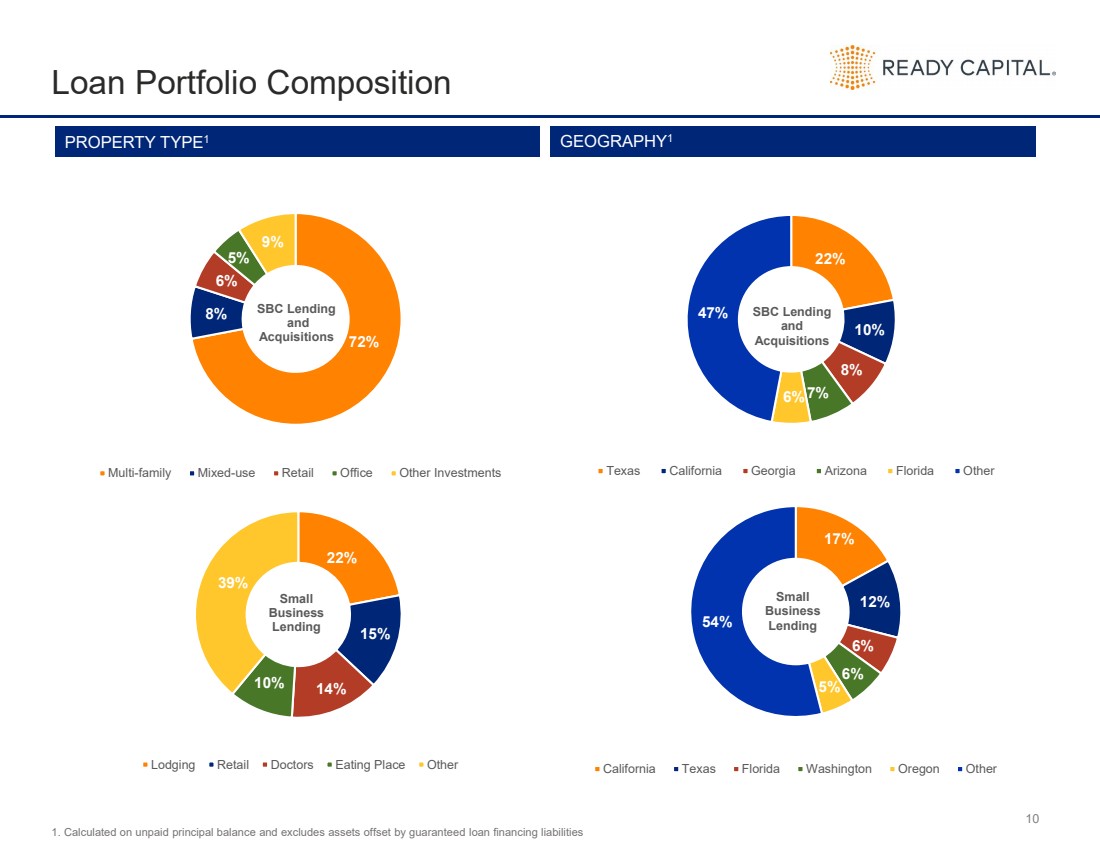
| 10贷款组合组合 22%15%14%10%39%小型企业Lending Lodging Retail Doctors Eating Place 其他1.按未付本金余额计算,不包括担保贷款融资负债抵销的资产 72%8%6%5%9%SBC Lending和Acquisitions Multi-family Mixed-use Retail Office Other投资 物业类型1 GeOGRAPHY1 22%10%8%7%6%47%SBC Lending和Acquisitions Texas California Georgia Arizona Florida Other 17%12%6%6%5%54小型企业Lending California Texas Florida Washington Oregon Other 百分比 |
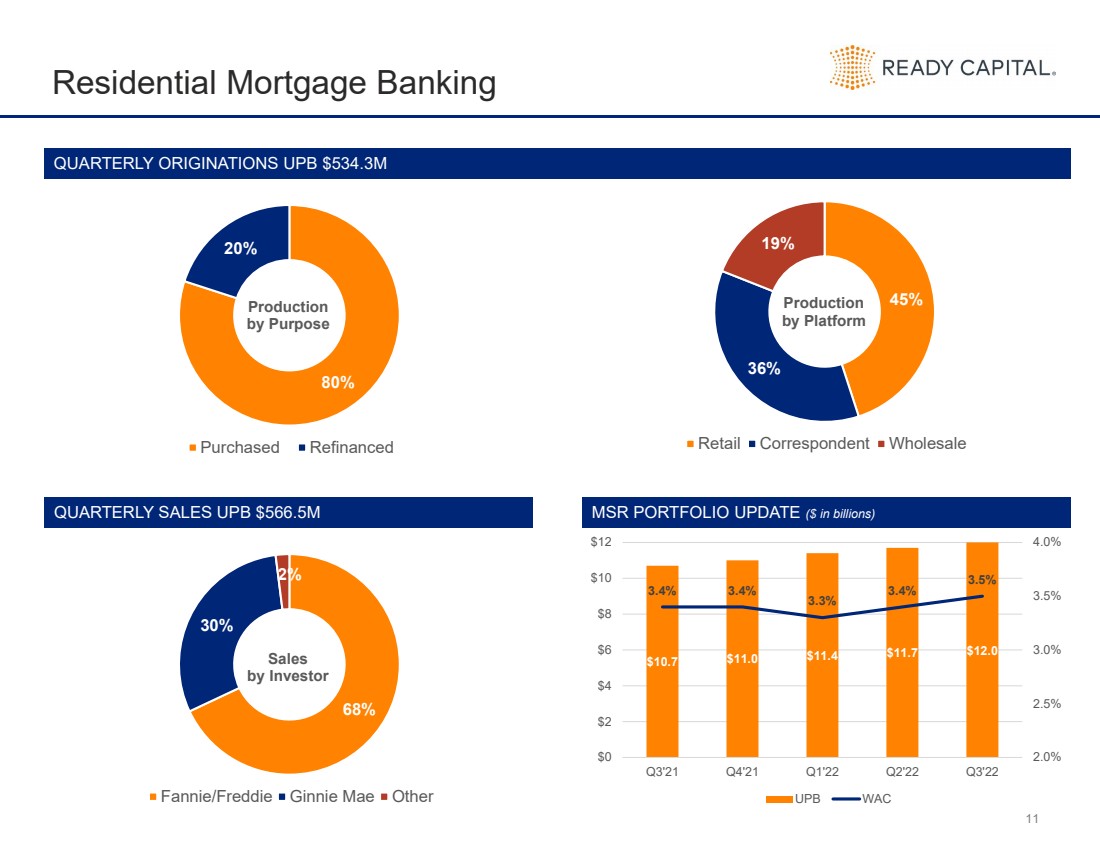
| 11 住宅抵押贷款银行季度销售额为534.3万美元 80%20%Purpose Purchased Refinanced QUARTERLY销售额为5.665亿美元 68%30% 2% 投资者销售额 房利美和房地美 其他 住房抵押贷款投资组合更新(以十亿美元计) 45%36%19%Platform Retail Correspondent Wholesale $10.7$11.0$11.4$11.7$12.生产03.4%3.4%3.3%3.4%3.5%2.0%2.5% 3.0% 3.5% 4.0%$0$2$4$6 $8$10 $12Q3‘21Q4’21Q1‘22Q2’22Q3‘22 UPB WAC |
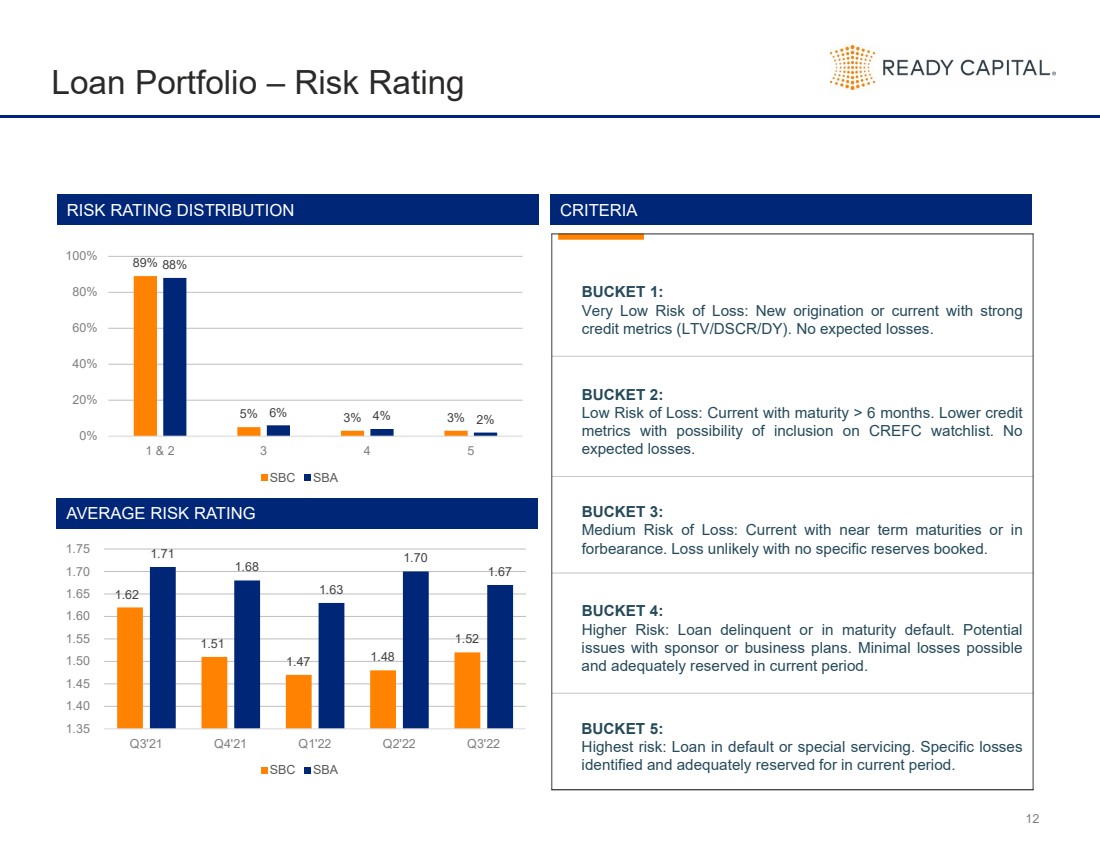
| 12贷款组合-Risk Rating BUCKET1:VeryLowRiskofLoss:Neworiginationorcurrentwithstrongcreditmetrics(LTV/DSCR/DY).Noexpectedlosses.BUCKET2:LowRiskofLoss:Currentwithmaturity>6months.LowercreditmetricswithpossibilityofinclusiononCREFCwatchlist.Noexpectedlosses.BUCKET3:MediumRiskofLoss:Currentwithneartermmaturitiesorinforbearance.Lossunlikelywithnospecificreservesbooked.BUCKET4:HigherRisk:Loandelinquentorinmaturitydefault.Potentialissueswithsponsororbusinessplans.Minimallossespossibleandadequatelyreservedincurrentperiod.BUCKET5:Highestrisk:Loanindefaultorspecialservicing.Specificlossesidentifiedandadequatelyreservedforincurrentperiod. RISK Rating DISTRIBUTION CRITERIA 89%5%3%3%88%6%4%2%0%20%40% 60% 80%100%1&2345 sbc sba 1.62 1.51 1.47 1.48 1.52 1.71 1.68 1.63 1.70 1.67 1.35 1.40 1.45 1.50 1.55 1.60 1.65 1.70 1.75Q3‘21Q4’21Q1‘22Q2’22Q3‘22 SBC SBA AVERAGE风险评级 |
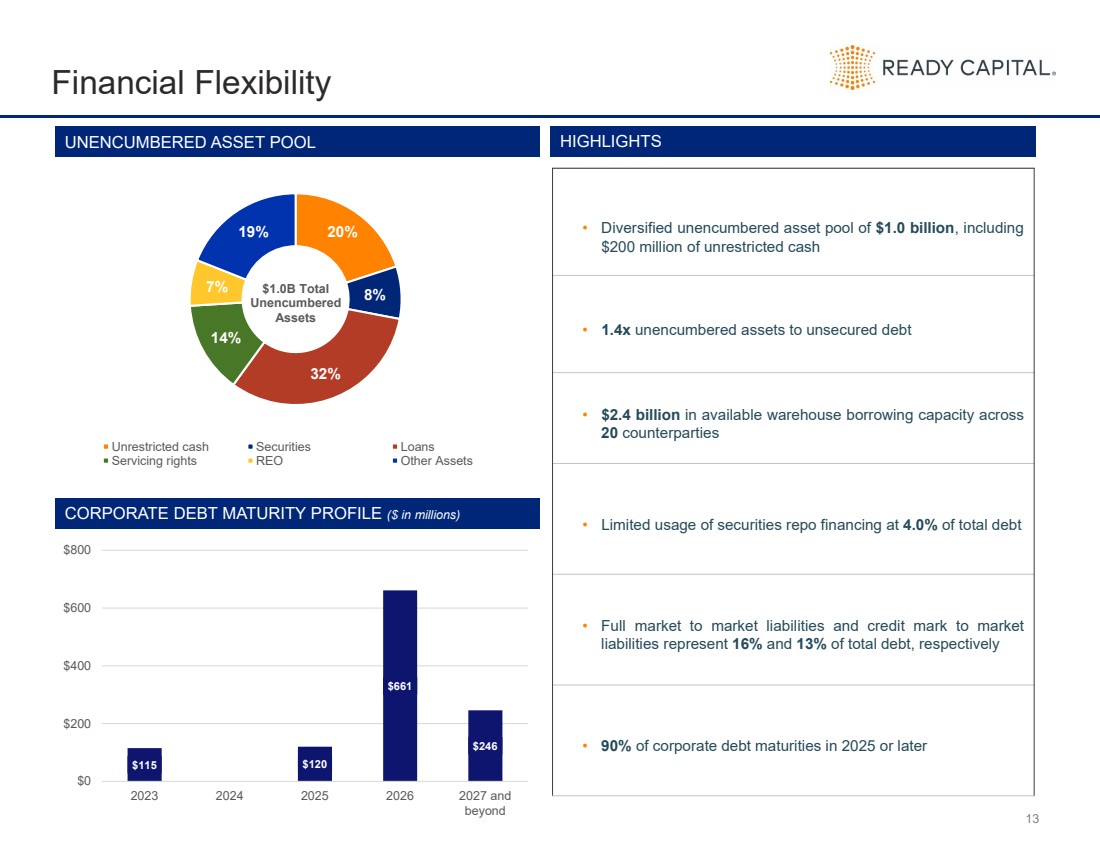
| 13财务灵活性 20%8%32%14%7%19%$10亿未受约束资产总额 无限制现金 证券 贷款 维修权 REO 其他资产 未受约束资产POOL HIGHLIGHTS $115 $120 $661 $246$0$200$400$600 $80020232024202520262027和Beyond 公司债务期限配置文件($in millions) •Diversifiedunencumberedassetpoolof$1.0billion,including$200millionofunrestrictedcash•1.4xunencumberedassetstounsecureddebt•$2.4billioninavailablewarehouseborrowingcapacityacross20counterparties•Limitedusageofsecuritiesrepofinancingat4.0%oftotaldebt•Fullmarkettomarketliabilitiesandcreditmarktomarketliabilitiesrepresent16%and13%oftotaldebt,respectively•90%ofcorporatedebtmaturitiesin2025orlater |
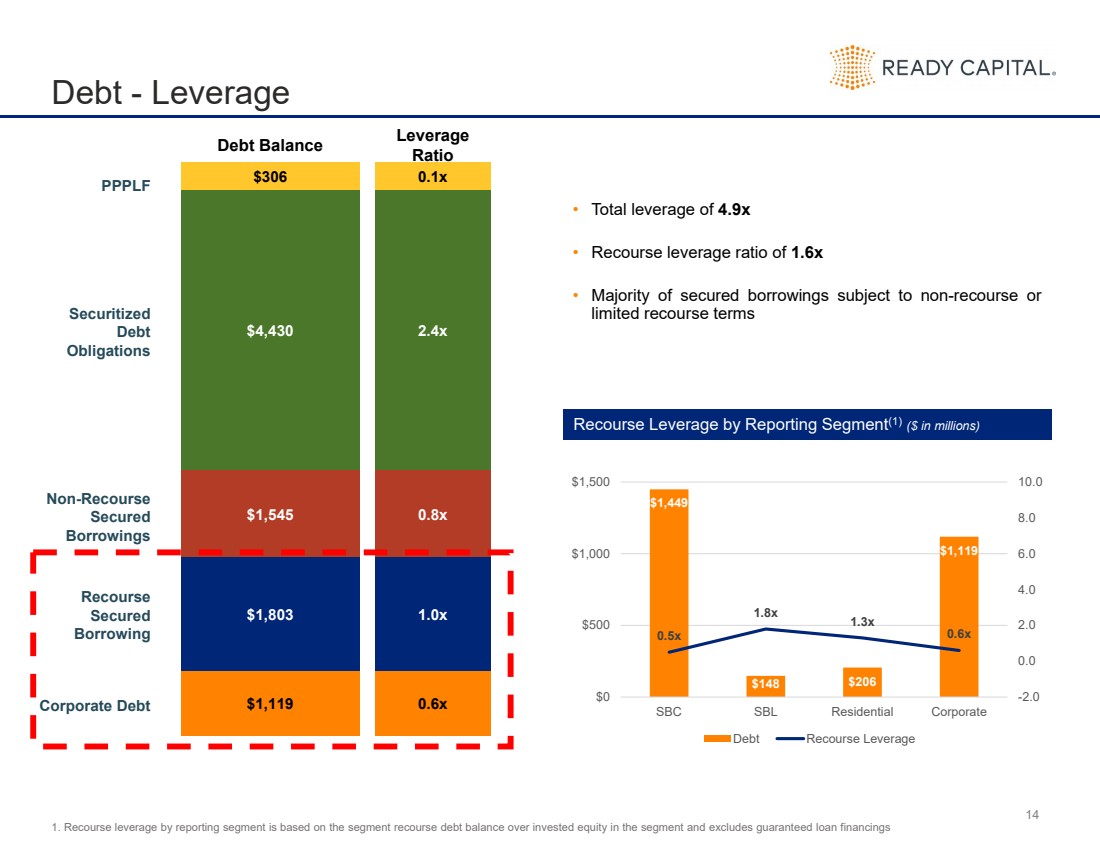
| 14债务杠杆公司债务PPPLF证券化债务豁免无追索权担保借款有追索权担保借款 0.1x2.4x0.8x1.0x0.6x债务余额杠杆Ratio•Totalleverageof4.9x•Recourseleverageratioof1.6x•Majorityofsecuredborrowingssubjecttonon-recourseorlimitedrecourseterms Recourse杠杆按报告部门(1)($in millions) $1,449$148$206$1,1190.5x1.8x1.3x0.6x-2.00.02.04.06.0 8.0 10.0$0$500$1,000$1,500SBCSBLResidentialCorporate Debt Recourse杠杆1.按报告分部划分的追索权杠杆率是基于分部的追索权债务余额对该分部的投资权益,不包括担保贷款financings $306$4,430$1,545$1,803$1,119 |
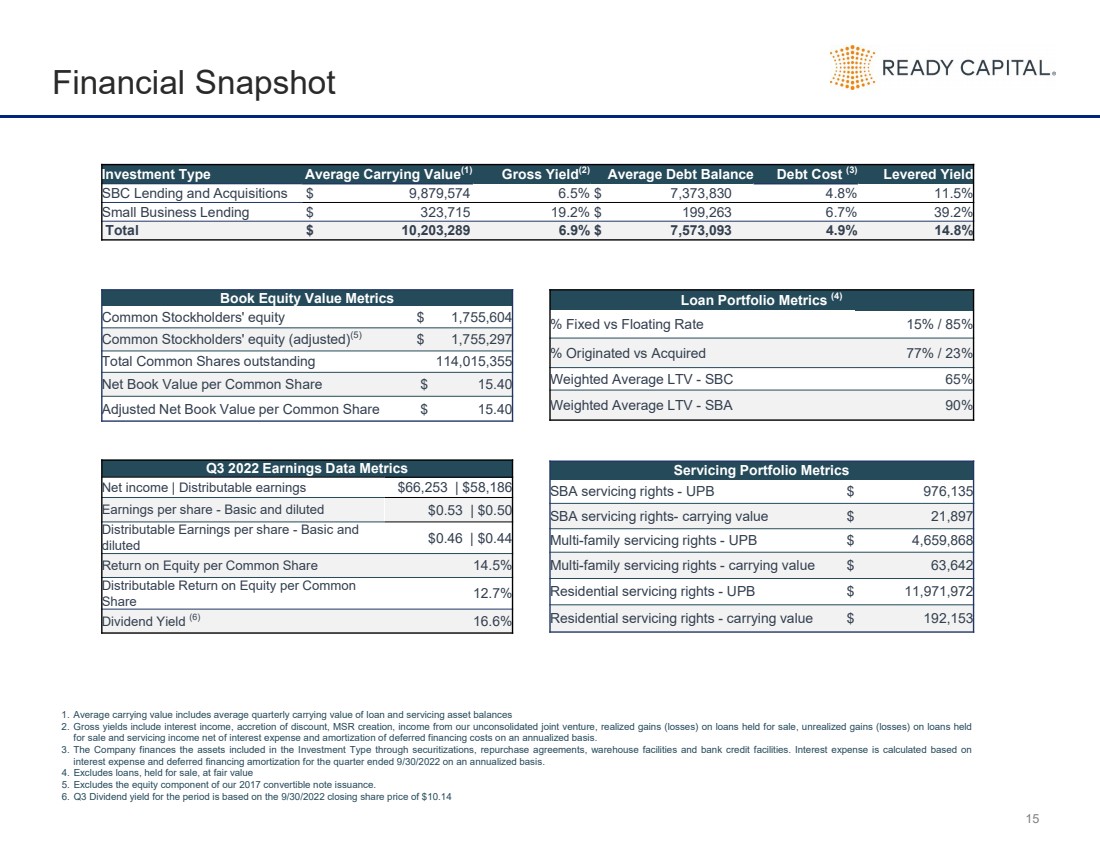
| 15财务快照 投资类型 平均账面价值 (1) 毛利率(2) 平均债务余额 债务成本 (3) 杠杆收益率 SBC借贷和收购 $9,879,574 6.5%$7,373,830 4.8% 11.5% 小型企业贷款 $323,715 19.2%$199,263 6.7% 39.2% 总计 $10,203,289 6.9% $7,573,093 4.9% 14.8% 账面权益价值指标 普通股股东权益 $1,755,604 普通股股东权益(调整后) (5) $1,755,297 已发行普通股总数 114,015,355 每股普通股账面净值 $15.40 调整后每股普通股账面净值 $15.40 贷款组合指标(4)%固定利率与浮动利率 15%/85% %源自与收购的 77%/23% 加权平均LTV-SBC 65% 加权平均LTV-SBA 90% 2022季度收益数据指标 净收益|可分配收益 $66,253|$58,186 每股收益 -基本和摊薄后 $0.53|$0.50 -基本和 摊薄后每股可分配收益 $0.46|$0.44 每股普通股股本回报率14.5% 每股普通股可分配股本回报率 12.7% 股息率 (6) 16.6% 服务组合指标SBA维修权-UPB $ ,976135 小型企业管理局维修权-账面价值 $ 21,897 多家庭维修权-upb $ 4,659,868 多家庭维修权-账面价值 $ 63,642 住宅维修权-upb $ 11,971,972 住宅维修权-账面价值 $ 192,153 1.Averagecarryingvalueincludesaveragequarterlycarryingvalueofloanandservicingassetbalances2.Grossyieldsincludeinterestincome,增量折扣,MSRCreation, 从未整合的合资企业获得的收入,在待售贷款上实现的收益(亏损),unrealizedgains(losses)onloansheldforsaleandservicingincomenetofinterestexpenseandamortizationofdeferredfinancingcostsonanannualizedbasis.3.TheCompanyfinancestheassetsincludedintheInvestmentTypethroughsecuritizations,回购协议,warehousefacilitiesandbankcreditfacilities.Interestexpenseiscalculatedbasedoninterestexpenseanddeferredfinancingamortizationforthequarterended9/30/2022onanannualizedbasis.4.Excludesloans,待售,atfairvalue5.Excludestheequitycomponentofour2017convertiblenoteissuance.6.Q3Dividendyieldfortheperiodisbasedonthe9/30/2022closingsharepriceof$10.14 |
| APPENDIX其他财务信息 |

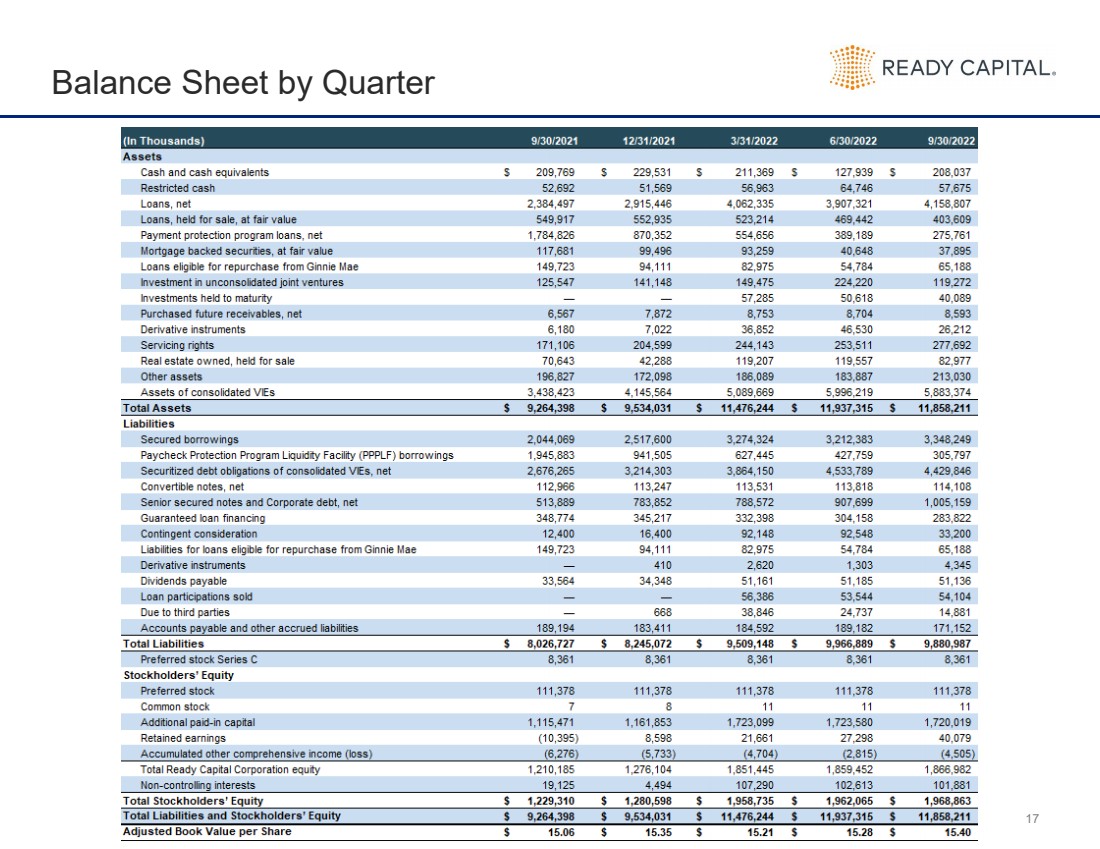
| 17按季度列出的余额表 |
| 18按季度分列的收入报表 |

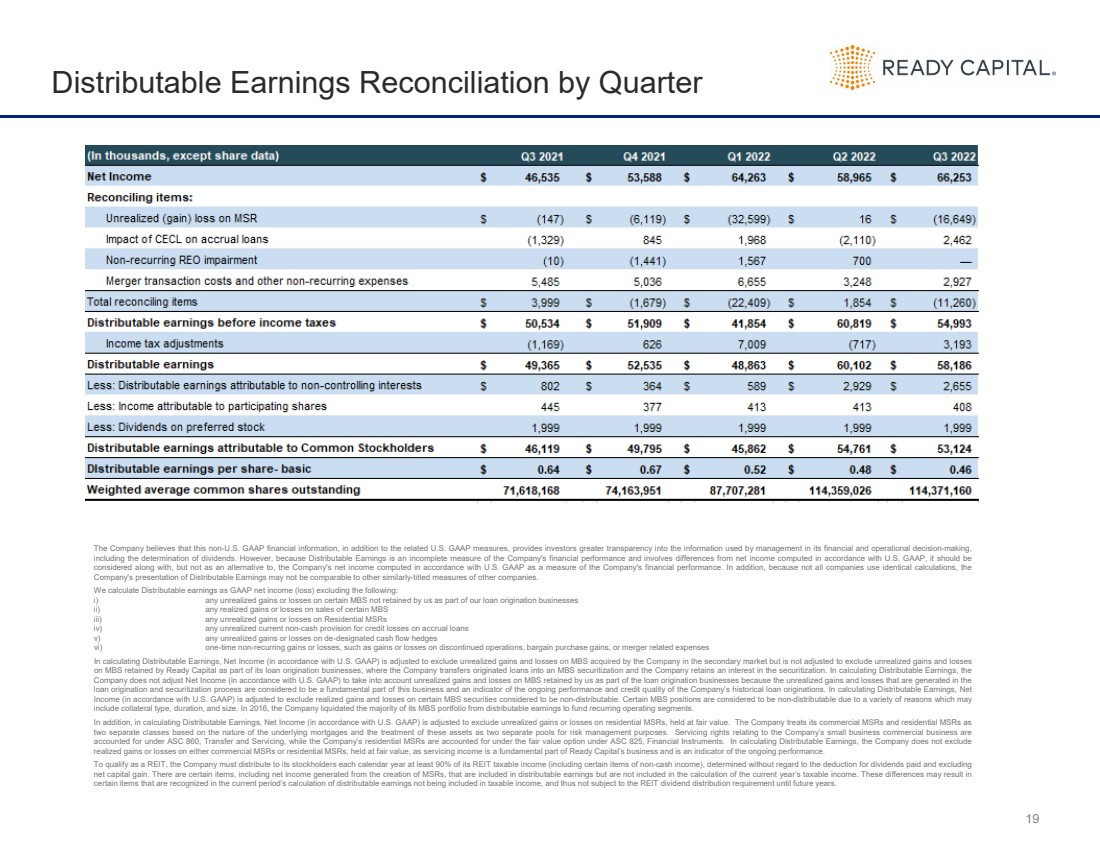
| 19Distributable Earnings Reconciliation by QuarterTheCompanybelievesthatthisnon-U.S.GAAPfinancialinformation,inadditiontotherelatedU.S.GAAPmeasures,providesinvestorsgreatertransparencyintotheinformationusedbymanagementinitsfinancialandoperationaldecision-making,includingthedeterminationofdividends.However,becauseDistributableEarningsisanincompletemeasureoftheCompany'sfinancialperformanceandinvolvesdifferencesfromnetincomecomputedinaccordancewithU.S.GAAP,itshouldbeconsideredalongwith,butnotasanalternativeto,theCompany'snetincomecomputedinaccordancewithU.S.GAAPasameasureoftheCompany'sfinancialperformance.Inaddition,becausenotallcompaniesuseidenticalcalculations,theCompany'spresentationofDistributableEarningsmaynotbecomparabletoothersimilarly-titledmeasuresofothercompanies.WecalculateDistributableearningsasGAAPnetincome(loss)excludingthefollowing:i)anyunrealizedgainsorlossesoncertainMBSnotretainedbyusaspartofourloanoriginationbusinessesii)anyrealizedgainsorlossesonsalesofcertainMBSiii)anyunrealizedgainsorlossesonResidentialMSRsiv)anyunrealizedcurrentnon-cashprovisionforcreditlossesonaccrualloansv)anyunrealizedgainsorlossesonde-designatedcashflowhedgesvi)one-timenon-recurringgainsorlosses,suchasgainsorlossesondiscontinuedoperations,bargainpurchasegains,ormergerrelatedexpensesIncalculatingDistributableEarnings,NetIncome(inaccordancewithU.S.GAAP)isadjustedtoexcludeunrealizedgainsandlossesonMBSacquiredbytheCompanyinthesecondarymarketbutisnotadjustedtoexcludeunrealizedgainsandlossesonMBSretainedbyReadyCapitalaspartofitsloanoriginationbusinesses,wheretheCompanytransfersoriginatedloansintoanMBSsecuritizationandtheCompanyretainsaninterestinthesecuritization.IncalculatingDistributableEarnings,theCompanydoesnotadjustNetIncome(inaccordancewithU.S.GAAP)totakeintoaccountunrealizedgainsandlossesonMBSretainedbyusaspartoftheloanoriginationbusinessesbecausetheunrealizedgainsandlossesthataregeneratedintheloanoriginationandsecuritizationprocessareconsideredtobeafundamentalpartofthisbusinessandanindicatoroftheongoingperformanceandcreditqualityoftheCompany’shistoricalloanoriginations.IncalculatingDistributableEarnings,NetIncome(inaccordancewithU.S.GAAP)isadjustedtoexcluderealizedgainsandlossesoncertainMBSsecuritiesconsideredtobenon-distributable.CertainMBSpositionsareconsideredtobenon-distributableduetoavarietyofreasonswhichmayincludecollateraltype,duration,andsize.In2016,theCompanyliquidatedthemajorityofitsMBSportfoliofromdistributableearningstofundrecurringoperatingsegments. Inaddition,incalculatingDistributableEarnings,NetIncome(inaccordancewithU.S.GAAP)isadjustedtoexcludeunrealizedgainsorlossesonresidentialMSRs,heldatfairvalue.TheCompanytreatsitscommercialMSRsandresidentialMSRsastwoseparateclassesbasedonthenatureoftheunderlyingmortgagesandthetreatmentoftheseassetsastwoseparatepoolsforriskmanagementpurposes.ServicingrightsrelatingtotheCompany’ssmallbusinesscommercialbusinessareaccountedforunderASC860,TransferandServicing,whiletheCompany’sresidentialMSRsareaccountedforunderthefairvalueoptionunderASC825,FinancialInstruments.IncalculatingDistributableEarnings,theCompanydoesnotexcluderealizedgainsorlossesoneithercommercialMSRsorresidentialMSRs,heldatfairvalue,asservicingincomeisafundamentalpartofReadyCapital’sbusinessandisanindicatoroftheongoingperformance.ToqualifyasaREIT,theCompanymustdistributetoitsstockholderseachcalendaryearatleast90%ofitsREITtaxableincome(includingcertainitemsofnon-cashincome),determinedwithoutregardtothedeductionfordividendspaidandexcludingnetcapitalgain.Therearecertainitems,includingnetincomegeneratedfromthecreationofMSRs,thatareincludedindistributableearningsbutarenotincludedinthecalculationofthecurrentyear’staxableincome.Thesedifferencesmayresultincertainitemsthatarerecognizedinthecurrentperiod’scalculationofdistributableearningsnotbeingincludedintaxableincome,andthusnotsubjecttotheREITdividenddistributionrequirementuntilfutureyears. |
|