* Refers to results excluding certain items included in our reported
results. These are non-GAAP financial measures. For a reconciliation to the most directly comparable US GAAP measures, see the Appendix of this Media Release
1 With the exception of Index Access and APAC Delta One
2 AUD / USD exchange rate of 0.724 used for purposes of calculating GFG Australian amounts
3 Net credit exposure is net of risk mitigation, specific allowances for credit losses, specific provisions for off-balance sheet credit exposures and valuation adjustments
4 Net credit exposure is net of risk mitigation, of specific allowances for credit
losses, specific provisions for off-balance sheet credit exposures and
valuation adjustments
|
5 1Q22 mark-to-market losses of CHF (34) mn (net of CHF 7 mn of hedges). 1Q21 included mark-to-market losses
of CHF (3) mn (net of CHF 4 mn of hedges)
6 Archegos impact includes revenues of USD 19 mn, release of provisions of credit losses of USD (167) mn and expenses of USD 12 mn
7 Based on Dealogic as of March 31, 2022 (Global)
8 With the exception of Index Access and APAC Delta One
9 Refers to Credit Suisse’s assets managed according to the Credit Suisse Sustainable Investment Framework (Sustainable AuM). This includes only AuM
balances from managed solutions that to date have been mapped to a sustainability rating of 2 and higher, based on the Framework scale (0-5). The increase vs. 1Q21 reflects a combination of further product classifications, onboarding of new
sustainable funds and net sales partially offset by market and FX movements
10 Percentage share of Sustainable AuM versus Total AuM
|
Appendix
| Key metrics |
|
|
in / end of |
|
% change |
|
|
|
1Q22 |
|
4Q21 |
|
1Q21 |
|
QoQ |
|
YoY |
|
| Credit Suisse Group results (CHF million) |
| Net revenues |
|
4,412 |
|
4,582 |
|
7,574 |
|
(4) |
|
(42) |
|
| Provision for credit losses |
|
(110) |
|
(20) |
|
4,394 |
|
450 |
|
– |
|
| Compensation and benefits |
|
2,458 |
|
2,145 |
|
2,207 |
|
15 |
|
11 |
|
| General and administrative expenses |
|
2,148 |
|
2,182 |
|
1,376 |
|
(2) |
|
56 |
|
| Commission expenses |
|
298 |
|
283 |
|
329 |
|
5 |
|
(9) |
|
| Restructuring expenses |
|
46 |
|
33 |
|
25 |
|
39 |
|
84 |
|
| Total other operating expenses |
|
2,492 |
|
4,121 |
|
1,730 |
|
(40) |
|
44 |
|
| Total operating expenses |
|
4,950 |
|
6,266 |
|
3,937 |
|
(21) |
|
26 |
|
| Loss before taxes |
|
(428) |
|
(1,664) |
|
(757) |
|
(74) |
|
(43) |
|
| Loss attributable to shareholders |
|
(273) |
|
(2,085) |
|
(252) |
|
(87) |
|
8 |
|
| Balance sheet statistics (CHF million) |
| Total assets |
|
739,554 |
|
755,833 |
|
865,576 |
|
(2) |
|
(15) |
|
| Risk-weighted assets |
|
273,043 |
|
267,787 |
|
302,869 |
|
2 |
|
(10) |
|
| Leverage exposure |
|
878,023 |
|
889,137 |
|
981,979 |
|
(1) |
|
(11) |
|
| Assets under management and net new assets (CHF billion) |
| Assets under management |
|
1,554.9 |
|
1,614.0 |
|
1,596.0 |
|
(3.7) |
|
(2.6) |
|
| Net new assets |
|
7.9 |
|
1.6 |
|
28.4 |
|
393.8 |
|
(72.2) |
|
| Basel III regulatory capital and leverage statistics (%) |
| CET1 ratio |
|
13.8 |
|
14.4 |
|
12.2 |
|
– |
|
– |
|
| CET1 leverage ratio |
|
4.3 |
|
4.3 |
|
3.8 |
|
– |
|
– |
|
| Tier 1 leverage ratio |
|
6.1 |
|
6.1 |
|
5.4 |
|
– |
|
– |
|
Results excluding certain items included in our reported results are non-GAAP financial
measures. Following the reorganization implemented at the beginning of 2022, we have
amended the presentation of our adjusted results. Management believes that such results
provide a useful presentation of our operating results for purposes of assessing our
Group and divisional performance consistently over time, on a basis that excludes
items that management does not consider representative of our underlying performance.
Provided below is a reconciliation to the most directly comparable US GAAP measures.
| Reconciliation of adjustment items |
|
|
Group |
|
| in |
|
1Q22 |
|
4Q21 |
|
1Q21 |
|
| Results (CHF million) |
| Net revenues |
|
4,412 |
|
4,582 |
|
7,574 |
|
| Real estate (gains)/losses |
|
(164) |
|
(224) |
|
0 |
|
| (Gains)/losses on business sales |
|
3 |
|
(13) |
|
0 |
|
| (Gain)/loss on equity investment in Allfunds Group |
|
353 |
|
(31) |
|
(144) |
|
| (Gain)/loss on equity investment in SIX Group AG |
|
(5) |
|
70 |
|
0 |
|
| Archegos |
|
(17) |
|
0 |
|
0 |
|
| Adjusted net revenues |
|
4,582 |
|
4,384 |
|
7,430 |
|
| Provision for credit losses |
|
(110) |
|
(20) |
|
4,394 |
|
| Archegos |
|
155 |
|
5 |
|
(4,430) |
|
| Adjusted provision for credit losses |
|
45 |
|
(15) |
|
(36) |
|
| Total operating expenses |
|
4,950 |
|
6,266 |
|
3,937 |
|
| Goodwill impairment |
|
– |
|
(1,623) |
|
– |
|
| Restructuring expenses |
|
(46) |
|
(33) |
|
(25) |
|
| Major litigation provisions |
|
(653) |
|
(514) |
|
(4) |
|
| Expenses related to real estate disposals |
|
(3) |
|
(11) |
|
(38) |
|
| Archegos |
|
(11) |
|
(14) |
|
0 |
|
| Adjusted total operating expenses |
|
4,237 |
|
4,071 |
|
3,870 |
|
| Income/(loss) before taxes |
|
(428) |
|
(1,664) |
|
(757) |
|
| Adjusted income before taxes |
|
300 |
|
328 |
|
3,596 |
|
| Adjusted economic profit |
|
(786) |
|
(842) |
|
1,726 |
|
| Adjusted return on tangible equity (%) |
|
4.3 |
|
(1.0) |
|
34.4 |
|
| Wealth Management |
|
|
in / end of |
|
% change |
|
|
|
1Q22 |
|
4Q21 |
|
1Q21 |
|
QoQ |
|
YoY |
|
| Results (CHF million) |
| Net revenues |
|
1,177 |
|
1,377 |
|
2,085 |
|
(15) |
|
(44) |
|
| Provision for credit losses |
|
24 |
|
(7) |
|
13 |
|
– |
|
85 |
|
| Total operating expenses |
|
1,510 |
|
1,227 |
|
1,094 |
|
23 |
|
38 |
|
| Income/(loss) before taxes |
|
(357) |
|
157 |
|
978 |
|
– |
|
– |
|
| Metrics |
| Economic profit (CHF million) |
|
(448) |
|
(68) |
|
544 |
|
– |
|
– |
|
| Cost/income ratio (%) |
|
128.3 |
|
89.1 |
|
52.5 |
|
– |
|
– |
|
| Assets under management (CHF billion) |
|
707.0 |
|
742.6 |
|
757.0 |
|
(4.8) |
|
(6.6) |
|
| Net new assets (CHF billion) |
|
4.8 |
|
(2.9) |
|
14.5 |
|
– |
|
– |
|
| Gross margin (annualized) (bp) |
|
65 |
|
73 |
|
114 |
|
– |
|
– |
|
| Net margin (annualized) (bp) |
|
(20) |
|
8 |
|
54 |
|
– |
|
– |
|
| Reconciliation of adjustment items |
|
|
Wealth Management |
|
| in |
|
1Q22 |
|
4Q21 |
|
1Q21 |
|
| Results (CHF million) |
| Net revenues |
|
1,177 |
|
1,377 |
|
2,085 |
|
| Real estate (gains)/losses |
|
(25) |
1 |
(19) |
|
0 |
|
| (Gains)/losses on business sales |
|
3 |
|
(17) |
|
0 |
|
| (Gain)/loss on equity investment in Allfunds Group |
|
353 |
|
(31) |
|
(144) |
|
| (Gain)/loss on equity investment in SIX Group AG |
|
(2) |
|
35 |
|
0 |
|
| Adjusted net revenues |
|
1,506 |
|
1,345 |
|
1,941 |
|
| Provision for credit losses |
|
24 |
|
(7) |
|
13 |
|
| Total operating expenses |
|
1,510 |
|
1,227 |
|
1,094 |
|
| Restructuring expenses |
|
(10) |
|
(7) |
|
(3) |
|
| Major litigation provisions |
|
(230) |
|
(3) |
|
11 |
|
| Expenses related to real estate disposals |
|
0 |
|
(3) |
|
(4) |
|
| Adjusted total operating expenses |
|
1,270 |
|
1,214 |
|
1,098 |
|
| Income/(loss) before taxes |
|
(357) |
|
157 |
|
978 |
|
| Adjusted income before taxes |
|
212 |
|
138 |
|
830 |
|
| Adjusted economic profit |
|
(21) |
|
(82) |
|
433 |
|
| Adjusted return on regulatory capital (%) |
|
7.1 |
|
4.5 |
|
26.3 |
|
1
Of which CHF 20 million is reflected in other revenues and CHF 5 million is reflected
in transaction- and performance-based revenues.
|
| Investment Bank |
|
|
in / end of |
|
% change |
|
|
|
1Q22 |
|
4Q21 |
|
1Q21 |
|
QoQ |
|
YoY |
|
| Results (CHF million) |
| Net revenues |
|
1,938 |
|
1,666 |
|
3,884 |
|
16 |
|
(50) |
|
| Provision for credit losses |
|
(156) |
|
(7) |
|
4,365 |
|
– |
|
– |
|
| Total operating expenses |
|
1,970 |
|
3,661 |
|
1,829 |
|
(46) |
|
8 |
|
| Income/(loss) before taxes |
|
124 |
|
(1,988) |
|
(2,310) |
|
– |
|
– |
|
| Metrics |
| Economic profit (CHF million) |
|
(297) |
|
(1,897) |
|
(2,194) |
|
(84) |
|
(86) |
|
| Cost/income ratio (%) |
|
101.7 |
|
219.7 |
|
47.1 |
|
– |
|
– |
|
| Results (USD million) |
| Net revenues |
|
2,096 |
|
1,820 |
|
4,263 |
|
15 |
|
(51) |
|
| Provision for credit losses |
|
(169) |
|
(8) |
|
4,635 |
|
– |
|
– |
|
| Total operating expenses |
|
2,131 |
|
4,002 |
|
2,015 |
|
(47) |
|
6 |
|
| Income/(loss) before taxes |
|
134 |
|
(2,174) |
|
(2,387) |
|
– |
|
– |
|
| Net revenue detail |
| in |
|
1Q22 |
|
4Q21 |
|
1Q21 |
|
| Net revenue detail (USD million) |
| Fixed income sales and trading |
|
802 |
|
504 |
|
1,616 |
|
| Equity sales and trading |
|
545 |
|
403 |
|
1,030 |
|
| Capital markets |
|
466 |
|
585 |
|
1,361 |
|
| Advisory and other fees |
|
221 |
|
331 |
|
257 |
|
| Other revenues |
|
62 |
|
(3) |
|
(1) |
|
| Net revenues |
|
2,096 |
|
1,820 |
|
4,263 |
|
| Reconciliation of adjustment items |
|
|
Investment Bank |
|
| in |
|
1Q22 |
|
4Q21 |
|
1Q21 |
|
| Results (CHF million) |
| Net revenues |
|
1,938 |
|
1,666 |
|
3,884 |
|
| Real estate (gains)/losses |
|
(53) |
|
0 |
|
0 |
|
| Archegos |
|
(17) |
|
0 |
|
0 |
|
| Adjusted net revenues |
|
1,868 |
|
1,666 |
|
3,884 |
|
| Provision for credit losses |
|
(156) |
|
(7) |
|
4,365 |
|
| Archegos |
|
155 |
|
5 |
|
(4,430) |
|
| Adjusted provision for credit losses |
|
(1) |
|
(2) |
|
(65) |
|
| Total operating expenses |
|
1,970 |
|
3,661 |
|
1,829 |
|
| Goodwill impairment |
|
0 |
|
(1,623) |
|
0 |
|
| Restructuring expenses |
|
(36) |
|
(25) |
|
(17) |
|
| Major litigation provisions |
|
0 |
|
(149) |
|
0 |
|
| Expenses related to real estate disposals |
|
(3) |
|
(8) |
|
(33) |
|
| Archegos |
|
(11) |
|
(19) |
|
0 |
|
| Adjusted total operating expenses |
|
1,920 |
|
1,837 |
|
1,779 |
|
| Income/(loss) before taxes |
|
124 |
|
(1,988) |
|
(2,310) |
|
| Adjusted income/(loss) before taxes |
|
(51) |
|
(169) |
|
2,170 |
|
| Adjusted economic profit |
|
(428) |
|
(533) |
|
1,165 |
|
| Adjusted return on regulatory capital (%) |
|
(1.2) |
|
(3.8) |
|
42.2 |
|
| Reconciliation of adjustment items |
|
|
Investment Bank |
|
| in |
|
1Q22 |
|
4Q21 |
|
1Q21 |
|
| Results (USD million) |
| Net revenues |
|
2,096 |
|
1,820 |
|
4,263 |
|
| Real estate (gains)/losses |
|
(57) |
|
0 |
|
0 |
|
| Archegos |
|
(19) |
|
0 |
|
0 |
|
| Adjusted net revenues |
|
2,020 |
|
1,820 |
|
4,263 |
|
| Provision for credit losses |
|
(169) |
|
(8) |
|
4,635 |
|
| Archegos |
|
167 |
|
5 |
|
(4,707) |
|
| Adjusted provision for credit losses |
|
(2) |
|
(3) |
|
(72) |
|
| Total operating expenses |
|
2,131 |
|
4,002 |
|
2,015 |
|
| Goodwill impairment |
|
– |
|
(1,775) |
|
– |
|
| Restructuring expenses |
|
(39) |
|
(27) |
|
(19) |
|
| Major litigation provisions |
|
0 |
|
(163) |
|
– |
|
| Expenses related to real estate disposals |
|
(3) |
|
(9) |
|
(35) |
|
| Archegos |
|
(12) |
|
(21) |
|
0 |
|
| Adjusted total operating expenses |
|
2,077 |
|
2,007 |
|
1,961 |
|
| Income/(loss) before taxes |
|
134 |
|
(2,174) |
|
(2,387) |
|
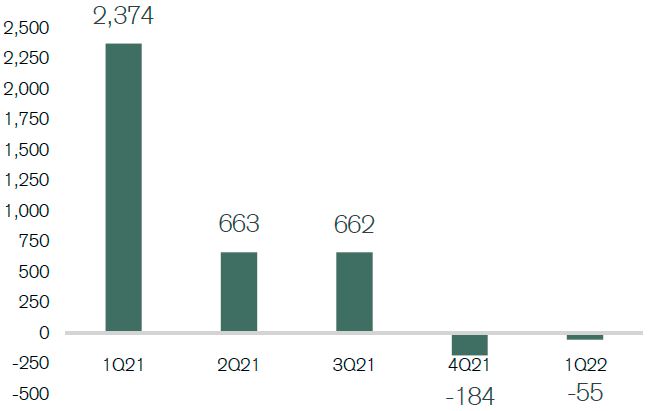
| Adjusted income/(loss) before taxes |
|
(55) |
|
(184) |
|
2,374 |
|
| Adjusted economic profit |
|
(466) |
|
(579) |
|
1,274 |
|
| Adjusted return on regulatory capital (%) |
|
(1.2) |
|
(3.8) |
|
42.2 |
|
| Swiss Bank |
|
|
in / end of |
|
% change |
|
|
|
1Q22 |
|
4Q21 |
|
1Q21 |
|
QoQ |
|
YoY |
|
| Results (CHF million) |
| Net revenues |
|
1,109 |
|
1,209 |
|
1,031 |
|
(8) |
|
8 |
|
| Provision for credit losses |
|
23 |
|
(4) |
|
26 |
|
– |
|
(12) |
|
| Total operating expenses |
|
615 |
|
606 |
|
593 |
|
1 |
|
4 |
|
| Income before taxes |
|
471 |
|
607 |
|
412 |
|
(22) |
|
14 |
|
| Metrics |
| Economic profit (CHF million) |
|
154 |
|
256 |
|
105 |
|
(40) |
|
47 |
|
| Cost/income ratio (%) |
|
55.5 |
|
50.1 |
|
57.5 |
|
– |
|
– |
|
| Assets under management (CHF billion) |
|
582.5 |
|
597.9 |
|
571.2 |
|
(2.6) |
|
2.0 |
|
| Net new assets (CHF billion) |
|
6.0 |
|
1.0 |
|
3.8 |
|
– |
|
– |
|
| Gross margin (annualized) (bp) |
|
75 |
|
82 |
|
74 |
|
– |
|
– |
|
| Net margin (annualized) (bp) |
|
32 |
|
41 |
|
29 |
|
– |
|
– |
|
| Reconciliation of adjustment items |
|
|
Swiss Bank |
|
| in |
|
1Q22 |
|
4Q21 |
|
1Q21 |
|
| Results (CHF million) |
| Net revenues |
|
1,109 |
|
1,209 |
|
1,031 |
|
| Real estate (gains)/losses |
|
(84) |
|
(205) |
|
0 |
|
| (Gain)/loss on equity investment in SIX Group AG |
|
(3) |
|
35 |
|
0 |
|
| Adjusted net revenues |
|
1,022 |
|
1,039 |
|
1,031 |
|
| Provision for credit losses |
|
23 |
|
(4) |
|
26 |
|
| Total operating expenses |
|
615 |
|
606 |
|
593 |
|
| Restructuring expenses |
|
(1) |
|
(1) |
|
(7) |
|
| Adjusted total operating expenses |
|
614 |
|
605 |
|
586 |
|
| Income before taxes |
|
471 |
|
607 |
|
412 |
|
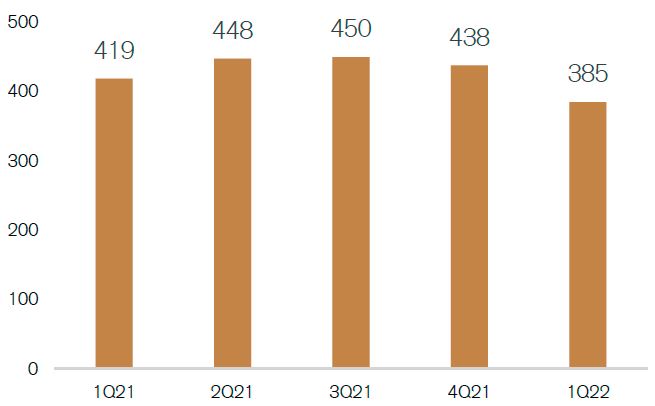
| Adjusted income before taxes |
|
385 |
|
438 |
|
419 |
|
| Adjusted economic profit |
|
90 |
|
129 |
|
111 |
|
| Adjusted return on regulatory capital (%) |
|
11.6 |
|
13.2 |
|
12.4 |
|
| Asset Management |
|
|
in / end of |
|
% change |
|
|
|
1Q22 |
|
4Q21 |
|
1Q21 |
|
QoQ |
|
YoY |
|
| Results (CHF million) |
| Net revenues |
|
361 |
|
399 |
|
400 |
|
(10) |
|
(10) |
|
| Provision for credit losses |
|
0 |
|
(2) |
|
0 |
|
100 |
|
– |
|
| Total operating expenses |
|
308 |
|
308 |
|
269 |
|
0 |
|
14 |
|
| Income before taxes |
|
53 |
|
93 |
|
131 |
|
(43) |
|
(60) |
|
| Metrics |
| Economic profit (CHF million) |
|
28 |
|
57 |
|
84 |
|
(51) |
|
(67) |
|
| Cost/income ratio (%) |
|
85.3 |
|
77.2 |
|
67.3 |
|
– |
|
– |
|
| Reconciliation of adjustment items |
|
|
Asset Management |
|
| in |
|
1Q22 |
|
4Q21 |
|
1Q21 |
|
| Results (CHF million) |
| Net revenues |
|
361 |
|
399 |
|
400 |
|
| Real estate (gains)/losses |
|
(2) |
|
0 |
|
0 |
|
| Adjusted net revenues |
|
359 |
|
399 |
|
400 |
|
| Provision for credit losses |
|
0 |
|
(2) |
|
0 |
|
| Total operating expenses |
|
308 |
|
308 |
|
269 |
|
| Restructuring expenses |
|
0 |
|
0 |
|
(1) |
|
| Expenses related to real estate disposals |
|
0 |
|
0 |
|
(1) |
|
| Adjusted total operating expenses |
|
308 |
|
308 |
|
267 |
|
| Income before taxes |
|
53 |
|
93 |
|
131 |
|
| Adjusted income before taxes |
|
51 |
|
93 |
|
133 |
|
| Adjusted economic profit |
|
27 |
|
57 |
|
86 |
|
| Adjusted return on regulatory capital (%) |
|
25.3 |
|
44.7 |
|
55.2 |
|
Cautionary statement regarding forward-looking information
This document contains statements that constitute forward-looking statements. In addition,
in the future we, and others on our behalf, may make statements that constitute forward-looking
statements. Such forward-looking statements may include, without limitation, statements
relating to the following:
■ our plans, targets or goals;
■ our future economic performance or prospects;
■ the potential effect on our future performance of certain contingencies; and
■ assumptions underlying any such statements.
Words such as “believes,” “anticipates,” “expects,” “intends” and “plans” and similar
expressions are intended to identify forward-looking statements but are not the exclusive
means of identifying such statements. We do not intend to update these forward-looking
statements.
By their very nature, forward-looking statements involve inherent risks and uncertainties,
both general and specific, and risks exist that predictions, forecasts, projections
and other outcomes described or implied in forward-looking statements will not be
achieved. We caution you that a number of important factors could cause results to
differ materially from the plans, targets, goals, expectations, estimates and intentions
expressed in such forward-looking statements and that the ongoing COVID-19 pandemic
creates significantly greater uncertainty about forward-looking statements in addition
to the factors that generally affect our business. These factors include:
■ the ability to maintain sufficient liquidity and access capital markets;
■ market volatility, increases in inflation and interest rate fluctuations or developments
affecting interest rate levels;
■ the ongoing significant negative consequences of the Archegos and supply chain finance
funds matters and our ability to successfully resolve these matters;
■ our ability to improve our risk management procedures and policies and hedging strategies;
■ the strength of the global economy in general and the strength of the economies of
the countries in which we conduct our operations, in particular the risk of negative
impacts of COVID-19 on the global economy and financial markets and the risk of continued
slow economic recovery or downturn in the EU, the US or other developed countries
or in emerging markets in 2022 and beyond;
■ the emergence of widespread health emergencies, infectious diseases or pandemics,
such as COVID-19, and the actions that may be taken by governmental authorities to
contain the outbreak or to counter its impact;
■ potential risks and uncertainties relating to the severity of impacts from COVID-19
and the duration of the pandemic, including potential material adverse effects on
our business, financial condition and results of operations;
■ the direct and indirect impacts of deterioration or slow recovery in residential and
commercial real estate markets;
■ adverse rating actions by credit rating agencies in respect of us, sovereign issuers,
structured credit products or other credit-related exposures;
■ the ability to achieve our strategic goals, including those related to our targets,
ambitions and financial goals;
■ the ability of counterparties to meet their obligations to us and the adequacy of
our allowance for credit losses;
■ the effects of, and changes in, fiscal, monetary, exchange rate, trade and tax policies;
■ the effects of currency fluctuations, including the related impact on our business,
financial condition and results of operations due to moves in foreign exchange rates;
■ geopolitical and diplomatic tensions, instabilities and conflicts, including war,
civil unrest, terrorist activity, sanctions or other geopolitical events or escalations
of hostilities;
■ political, social and environmental developments, including climate change;
■ the ability to appropriately address social, environmental and sustainability concerns
that may arise from our business activities;
■ the effects of, and the uncertainty arising from, the UK’s withdrawal from the EU;
■ the possibility of foreign exchange controls, expropriation, nationalization or confiscation
of assets in countries in which we conduct our operations;
■ operational factors such as systems failure, human error, or the failure to implement
procedures properly;
■ the risk of cyber attacks, information or security breaches or technology failures
on our reputation, business or operations, the risk of which is increased while large
portions of our employees work remotely;
■ the adverse resolution of litigation, regulatory proceedings and other contingencies;
■ actions taken by regulators with respect to our business and practices and possible
resulting changes to our business organization, practices and policies in countries
in which we conduct our operations;
■ the effects of changes in laws, regulations or accounting or tax standards, policies
or practices in countries in which we conduct our operations;
■ the discontinuation of LIBOR and other interbank offered rates and the transition
to alternative reference rates;
■ the potential effects of changes in our legal entity structure;
■ competition or changes in our competitive position in geographic and business areas
in which we conduct our operations;
■ the ability to retain and recruit qualified personnel;
■ the ability to protect our reputation and promote our brand;
■ the ability to increase market share and control expenses;
■ technological changes instituted by us, our counterparties or competitors;
■ the timely development and acceptance of our new products and services and the perceived
overall value of these products and services by users;
■ acquisitions, including the ability to integrate acquired businesses successfully,
and divestitures, including the ability to sell non-core assets; and
■ other unforeseen or unexpected events and our success at managing these and the risks
involved in the foregoing.
We caution you that the foregoing list of important factors is not exclusive. When
evaluating forward-looking statements, you should carefully consider the foregoing
factors and other uncertainties and events, including the information set forth in
“Risk factors” in I – Information on the company in our Annual Report 2021.
1Q22 Results Analyst and Investor Call Thomas Gottstein Chief Executive OfficerDavid Mathers Chief
Financial OfficerApril 27, 2022
Disclaimer (1/2) 2 Credit Suisse has not finalized its 1Q22 Financial Report and Credit Suisse’s
independent registered public accounting firm has not completed its review of the condensed consolidated financial statements (unaudited) for the period. Accordingly, the financial information contained in this presentation is subject to
completion of quarter-end procedures, which may result in changes to that information.This material does not purport to contain all of the information that you may wish to consider. This material is not to be relied upon as such or used in
substitution for the exercise of independent judgment. Cautionary statement regarding forward-looking statements This presentation contains forward-looking statements that involve inherent risks and uncertainties, and we might not be able to
achieve the predictions, forecasts, projections and other outcomes we describe or imply in forward-looking statements. A number of important factors could cause results to differ materially from the plans, targets, goals, expectations,
estimates and intentions we express in these forward-looking statements, including those we identify in "Risk factors” in our Annual Report on Form 20-F for the fiscal year ended December 31, 2021 and in the “Cautionary statement regarding
forward-looking information" in our 1Q22 Earnings Release published on April 27, 2022 and filed with the US Securities and Exchange Commission, and in other public filings and press releases. We do not intend to update these forward-looking
statements. In particular, the terms “Estimate”, “Illustrative”, “Ambition”, “Objective”, “Outlook”, “Goal”, “Commitment” and “Aspiration” are not intended to be viewed as targets or projections, nor are they considered to be Key Performance
Indicators. All such estimates, illustrations, ambitions, objectives, outlooks, goals, commitments and aspirations are subject to a large number of inherent risks, assumptions and uncertainties, many of which are completely outside of our
control. These risks, assumptions and uncertainties include, but are not limited to, general market conditions, market volatility, increased inflation, interest rate volatility and levels, global and regional economic conditions, challenges and
uncertainties resulting from Russia’s invasion of Ukraine, political uncertainty, changes in tax policies, scientific or technological developments, evolving sustainability strategies, changes in the nature or scope of our operations, changes
in carbon markets, regulatory changes, changes in levels of client activity as a result of any of the foregoing and other factors. Accordingly, these statements, which speak only as of the date made, are not guarantees of future performance and
should not be relied on for any purpose. We do not intend to update these estimates, illustrations, ambitions, objectives, outlooks, goals, commitments, aspirations or any other forward-looking statements. For these reasons, we caution you not
to place undue reliance upon any forward-looking statements. We may not achieve the benefits of our strategic initiativesWe may not achieve all of the expected benefits of our strategic initiatives. Factors beyond our control, including but not
limited to the market and economic conditions (including macroeconomic and other challenges and uncertainties, for example, resulting from Russia’s invasion of Ukraine), changes in laws, rules or regulations and other challenges discussed in
our public filings, could limit our ability to achieve some or all of the expected benefits of these initiatives. Estimates and assumptionsIn preparing this presentation, management has made estimates and assumptions that affect the numbers
presented. Actual results may differ. Annualized numbers do not take into account variations in operating results, seasonality and other factors and may not be indicative of actual, full-year results. Figures throughout this presentation may
also be subject to rounding adjustments. All opinions and views constitute good faith judgments as of the date of writing without regard to the date on which the reader may receive or access the information. This information is subject to
change at any time without notice and we do not intend to update this information.Cautionary statements relating to interim financial informationThis presentation contains certain unaudited interim financial information for the second quarter
of 2022. This information has been derived from management accounts, is preliminary in nature, does not reflect the complete results of the second quarter of 2022 and is subject to change, including as a result of any normal quarterly
adjustments in relation to the financial statements for the second quarter of 2022. This information has not been subject to any review by our independent registered public accounting firm. There can be no assurance that the final results for
these periods will not differ from these preliminary results, and any such differences could be material. Quarterly financial results for the second quarter of 2022 will be included in our 2Q22 Financial Report. These interim results of
operations are not necessarily indicative of the results to be achieved for the remainder of or the full second quarter of 2022.
Disclaimer (2/2) 3 Statement regarding non-GAAP financial measuresThis presentation contains non-GAAP
financial measures, including results excluding certain items included in our reported results as well as return on regulatory capital and return on tangible equity. Further details and information needed to reconcile such non-GAAP financial
measures to the most directly comparable measures under US GAAP can be found in the Appendix as well as in the 1Q22 Earnings Release, which are both available on our website at www.credit-suisse.com. Our estimates, ambitions, objectives and
targets often include metrics that are non-GAAP financial measures and are unaudited. A reconciliation of the estimates, ambitions, objectives and targets to the nearest GAAP measures is unavailable without unreasonable efforts. Results
excluding certain items included in our reported results do not include items such as goodwill impairment, major litigation provisions, real estate gains, impacts from foreign exchange and other revenue and expense items included in our
reported results, all of which are unavailable on a prospective basis. Return on tangible equity is based on tangible shareholders' equity, a non-GAAP financial measure also known as tangible book value, which is calculated by deducting
goodwill and other intangible assets from total shareholders' equity as presented in our balance sheet, both of which are unavailable on a prospective basis. Return on regulatory capital (a non-GAAP financial measure) is calculated using
income/(loss) after tax and assumes a tax rate of 25% and capital allocated based on the average of 13.5% of risk-weighted assets and 4.25% of leverage exposure; the essential components of this calculation are unavailable on a prospective
basis. Such estimates, ambitions, objectives and targets are calculated in a manner that is consistent with the accounting policies applied by us in preparing our financial statements. Statement regarding capital, liquidity and leverageCredit
Suisse is subject to the Basel framework, as implemented in Switzerland, as well as Swiss legislation and regulations for systemically important banks, which include capital, liquidity, leverage and large exposure requirements and rules for
emergency plans designed to maintain systemically relevant functions in the event of threatened insolvency. Credit Suisse has adopted the Bank for International Settlements (BIS) leverage ratio framework, as issued by the Basel Committee on
Banking Supervision (BCBS) and implemented in Switzerland by the Swiss Financial Market Supervisory Authority FINMA.Unless otherwise noted, leverage exposure is based on the BIS leverage ratio framework and consists of period-end balance sheet
assets and prescribed regulatory adjustments. The tier 1 leverage ratio and CET1 leverage ratio are calculated as BIS tier 1 capital and CET1 capital, respectively, divided by period-end leverage exposure. SourcesCertain material in this
presentation has been prepared by Credit Suisse on the basis of publicly available information, internally developed data and other third-party sources believed to be reliable. Credit Suisse has not sought to independently verify information
obtained from public and third-party sources and makes no representations or warranties as to accuracy, completeness, reasonableness or reliability of such information.
2022 is a transition year for Credit Suisse 1Q22 key messages Footnotes are an integral part of this
presentation. See slides 36-40 in the appendix of this presentation for detailed information, including important presentation and other information relating to non-GAAP financial measures, and defined terms. 4 CHF (0.4) bnreported pre-tax
income;CHF (0.2) bn Russia-related impact CHF 0.3 bnadjusted pre-tax income;CHF (0.2) bn Russia-related impact 13.8% CET1 ratio4.3% CET1 leverage ratio Integrated strategylaunched to deliver growth in WM;positive NNA across all regions in
volatile environment Cost savingsfrom centralized Procurement and Prime Services exit1; unified platforms and divisions to drive synergies from 2023 Dynamic managingof risk in response to Russia’s invasion of Ukraine with 56% reduction in
credit exposure2 from 4Q21 Strengtheningof both first and second line of defense on track Proactive approachto settlement of litigation cases; CHF 0.7 bn of litigation provisions Strategy Risk and Litigation Financials 82%of USD
>3 bn IB allocated capital reduction ambition achieved
Reported PTI of CHF (428) mnincluded real estate gains of CHF 164 mn offset by major litigation
provisions of CHF 653 mn, losses of CHF 353 mn related to Allfunds and CHF 206 mn from Russia-related losses Adjusted PTI of CHF 300 mnpost Russia-related losses of CHF 206 mn and vs. exceptionally strong 1Q21, from reduced client activity
and capital markets issuances in volatile market conditions, cumulative reduction in risk appetite in 2021, impact of flattening yield curve in Corporate Center Treasury results and increased cash accruals for compensation due to normalized
deferral levels 1Q22 reflected reduced client activity in volatile markets… Footnotes are an integral part of this presentation. See slides 36-40 in the appendix of this presentation for detailed information, including important presentation
and other information relating to non-GAAP financial measures, and defined terms. 5 Group quarterly net revenues and pre-tax incomein CHF bn Net revenues Pre-tax income Reported Adjusted 1Q21 2Q21 3Q21 4Q21 1Q22
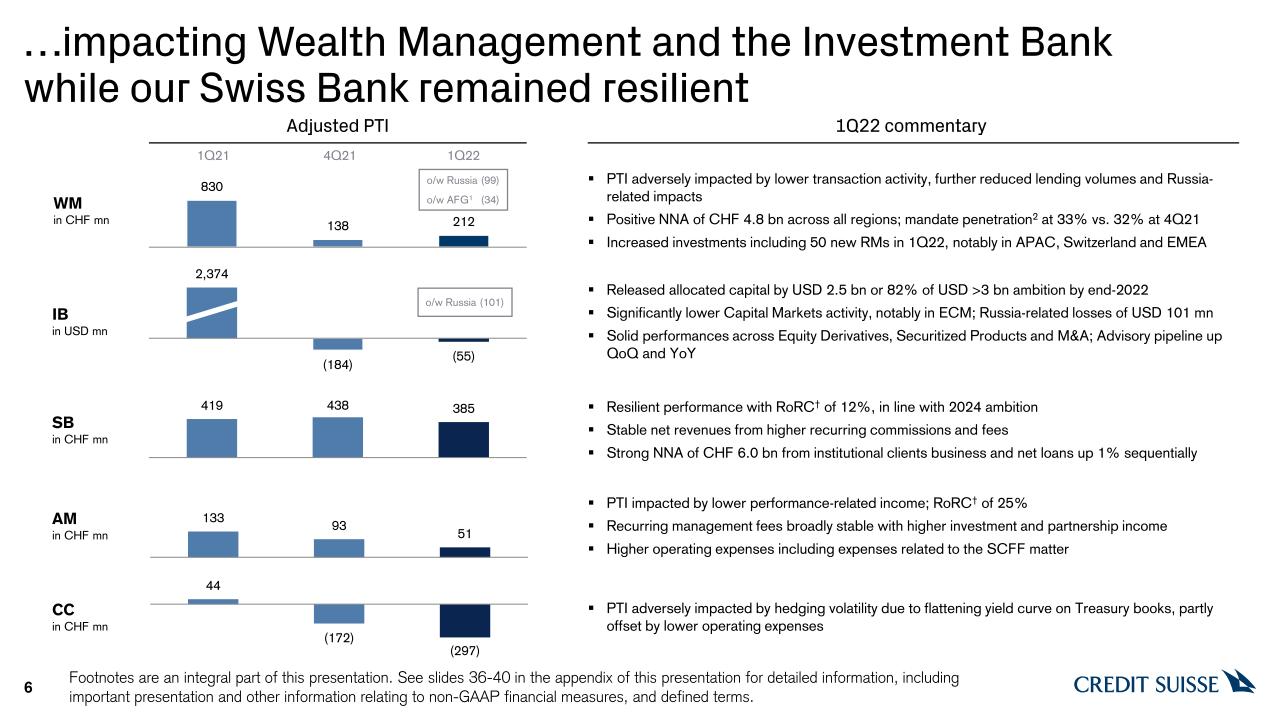
…impacting Wealth Management and the Investment Bank while our Swiss Bank remained resilient Footnotes
are an integral part of this presentation. See slides 36-40 in the appendix of this presentation for detailed information, including important presentation and other information relating to non-GAAP financial measures, and defined terms.
6 Adjusted PTI 1Q22 commentary WMin CHF mn IBin USD mn SBin CHF mn AMin CHF mn CCin CHF mn PTI adversely impacted by lower transaction activity, further reduced lending volumes and Russia-related impactsPositive NNA of CHF 4.8 bn
across all regions; mandate penetration2 at 33% vs. 32% at 4Q21Increased investments including 50 new RMs in 1Q22, notably in APAC, Switzerland and EMEA o/w Russia (99)o/w AFG1 (34) o/w Russia (101) Released allocated capital by USD 2.5 bn
or 82% of USD >3 bn ambition by end-2022Significantly lower Capital Markets activity, notably in ECM; Russia-related losses of USD 101 mnSolid performances across Equity Derivatives, Securitized Products and M&A; Advisory pipeline up QoQ
and YoY Resilient performance with RoRC† of 12%, in line with 2024 ambitionStable net revenues from higher recurring commissions and feesStrong NNA of CHF 6.0 bn from institutional clients business and net loans up 1% sequentially PTI
impacted by lower performance-related income; RoRC† of 25%Recurring management fees broadly stable with higher investment and partnership incomeHigher operating expenses including expenses related to the SCFF matter PTI adversely impacted by
hedging volatility due to flattening yield curve on Treasury books, partly offset by lower operating expenses 1Q21 4Q21 1Q22
Comprehensive de-risking measures executed, improving our risk profile but impacting top-line in the
short-term Footnotes are an integral part of this presentation. See slides 36-40 in the appendix of this presentation for detailed information, including important presentation and other information relating to non-GAAP financial measures, and
defined terms. 7 Wealth Management Ship financingExit of Sub-Saharan Africa markets (excluding South Africa)Russia-related de-riskingConcentration risks, notably in AsiaClient risk review Improved risk profile of Bank CHF ~(25) mn1of
net revenues in 1Q22 Group credit portfolio down 9% YoYincluding 17% reduction in non-investment grade portfolio and 17% reduction in Emerging Markets portfolioGroup market risk reductionof 21% in market risk RWA YoY De-risking measures(in
the last 12 months) Impact from de-risking measures Investment Bank Ongoing exit of Prime Services2Optimization of Corporate Bank exposureReduction of long-duration structured derivatives bookOngoing exit of ~10 non-core GTS markets without
Wealth Management nexus USD ~(250) mnof net revenues in 1Q22
Select updates on strengthening of Risk Management and addressing legacy issues Footnotes are an
integral part of this presentation. See slides 36-40 in the appendix of this presentation for detailed information, including important presentation and other information relating to non-GAAP financial measures, and defined terms. 8 Risk and
Compliance 56% reductionin Russia-related credit exposure2 vs. end-2021 Executing strategyconsistent with approved risk appetite Strengthening of first and second line of defenseon track to enhance efficiency and effectiveness of Client
Lifecycle Processes Legal Established Strategic Regulatory Remediation Committeeat the Executive Board level to oversee delivery on our regulatory programs Proactive approachto settlement of litigation cases; litigation provisions of CHF
0.7 bn in 1Q22, most of which related to matters that originated more than a decade ago, in addition to CHF 0.5 bn in 4Q21 Settlement of 12 major litigation cases in civil matters since 2020, at an accelerated pace vs. previous years Further
strengthening of our risk culture with compensation aligned to improved risk and control practices; development of metrics to track progress Dismissal of >80 cases1since 2020
Select Group Strategy metrics and milestones progress Footnotes are an integral part of this
presentation. See slides 36-40 in the appendix of this presentation for detailed information, including important presentation and other information relating to non-GAAP financial measures, and defined terms. 9 Release capital allocated to
IB to shift into core businesses Select strategic initiatives Deliver Group productivity cost savings for investment Continue to deliver sustainability strategy Wealth Management:Leverage House View to grow recurring revenues Investment
Bank:Exit Prime Services, optimize Corporate Bank Swiss Bank:Drive digital model for retail and SME clients Asset Management:Grow core operating business Reinforce our integrated model USD 2.5 bn reduction vs. 4Q20, representing 82% of
ambition 1Q22 progress Outsourcing of Procurement expected to lead to cash savings of CHF 150 mn in 2022, rising to CHF 250 mn in 2023; other cost measures, e.g. CTOO integration, to yield savings later in the year, increasing into
2023 Sustainable AuM3 of CHF 144 bn, up 22% vs. 1Q21; additional restrictions on Arctic oil & gas, oil sands and deep sea mining Mandate penetration of 33% vs. 30% at 4Q20(for WM and PB Switzerland) 84% reduction in Prime balances since
1Q21Hired ~50 MDs4 in IBCM reflecting our commitment to rebuild 125k5 CSX clients at 1Q22 Management fee margin of 26 bpsJoined Net Zero Asset Managers initiative Launched Private & Growth Markets and refocused GTS platform to reinforce
collaboration between IB and WM USD >3 bn reduction by 4Q22 vs. 4Q20 Ambitions CHF ~1.0-1.5 bn structural cost savings p.a. by 20241 Deliver sustainable solutions Mandate penetration of 33-35% by 2024(for WM and PB Switzerland) Exit
Prime Services2 by end-2022 200k clients by end-2022 Stable management fee margin ~26 bps Increase revenues from collaboration
We will progressively deploy resources in Wealth Management to accelerate growth Footnotes are an
integral part of this presentation. See slides 36-40 in the appendix of this presentation for detailed information, including important presentation and other information relating to non-GAAP financial measures, and defined terms. 10 Defined
and launched the new integrated Wealth Management organization under the new divisional leadership, with clear lines of accountability, to execute our long-term vision for wealth managementDeployed new coverage set-upLaunched new, dedicated
strategic capabilities including Financing & Products, Investment Solutions & Sustainability and Client Segment Management Evolved our strategy following the Wealth Management CEO’s first 50 days assessment, also against the backdrop
of the rapidly changing geopolitical contextLaunched practical development initiatives with clear senior-level accountability to operationalize these Ten strategic priorities focused on: client segments, priority markets, products and
solutions, simplification and people Exit of Private Banking activities in Sub-Saharan Africa markets (excluding South Africa)Accelerated digital outreach in Core HNW segment (e.g. PBI ‘CS in Brief’ extended to clients in 55 markets;
behavioral client tracking analytics in place)Invested in 50 Relationship Manager hires in 1Q22 with focus on APAC, Switzerland and EMEA Launch of integratedWealth Management division Started execution of initiatives Defined strategic
execution program CBV CHF ~1.6 trn by 2024(for WM and PB Switzerland) AuMCHF ~1.1 trn by 2024(for WM and PB Switzerland) Adj. RoRC†>18% by 2024 Key aspirations
Continued progress on reshaping the Investment Bank and investing for growth 11 Release capital from
Prime and de-risk franchise Invest in capital-light Investment Banking & Capital Markets business Build a global franchise and increase Wealth Management connectivity Hired ~50 new MDs4 in IBCM as part of our growth plan, with 21 new
hires starting by 1H22 Grew market share in IBCM EMEA (Top 5) and IBCM APAC (Top 5) in 1Q225, commensurate with rebalancing the regional footprint Increased SoW in Leveraged Finance Capital Markets QoQ5Continue to rebuild IBCM Managing Director
footprint, with a particular focus on high growth sectors and areas linked to sustainability Delivered USD 2.5 bn reduction in allocated capital vs. 2020, achieving 82% of USD >3 bn capital release ambition1Reduced Prime chargeable balances
by 84% since 1Q21 and 54% since 4Q21Increased oil and gas lending clients in the Aware or above category of the Client Energy Transition Framework2 by 8 pp. vs. 1Q21Enhanced risk management framework led to swift reduction in Russia
exposureFull exit3 of Prime business to be achieved by end-2022 at the latest Reintegrated Securities Research, APAC IBCM and Swiss IBCM to better serve clients globallyRefocused GTS platform with a simplified asset-aligned structure and
unified sales team to drive collaboration Integrated HOLT in Equities franchise to deliver industry leading content & analytics Launched new Private & Growth Markets organization to capture nexus of WM and IB activity in EMEA2nd best
quarterly Equity Derivatives result after 1Q21Focus on better harmonizing GTS and financing functionality globally Drive market-leading Credit and Securitized Products businesses Continued momentum in Securitized Products and expanded ESG
offering in our Credit franchise#2 rank6 in Agency CMBS and #3 rank7 Pass Through trading Capital1 releaseUSD >3 bn over 2021-2022 Key aspirations Adj. RoRC†>12% in 2024 Footnotes are an integral part of this presentation. See slides
36-40 in the appendix of this presentation for detailed information, including important presentation and other information relating to non-GAAP financial measures, and defined terms.
Swiss Bank building on its leading positions 12 Further build strong consumer banking business Further
grow our leading corporate banking franchise Grow Private and Digital Banking businesses Gain further market share in institutional business Go-live of ‘Life Plan’ Advisory in Private Banking to better access growing retirement asset
poolInvested into PB growth: new RMs, wealth planning, underlying ITStrong growth in CSX, 125k clients in 1Q22; targeting 200k clients in 2022Roll out CSX bundles; new mortgage partnership with MoneyPark/PriceHubble Leading positions in
premium cardsSuccessful credit partnerships, e.g. with leading car manufacturersCapitalized on post-COVID normalization in cards, FX and leasingFurther enhance digitalization and partner integration Top 2 Corporate Banking franchise leveraging
#1 IBCM position1; robust deal flow in 1Q22Strong collaboration with Private Banking centered around EntrepreneursDrive lending growth including expansion of structured / capital velocity solutionsFurther develop sustainable finance
offering #1 Institutional Banking franchise2; continued strong NNA momentum in 1Q22Continued strong growth in fund lending solutions; expanding offeringEnhance Asset Servicing offering including ESG analytic capabilities Simplify and
digitalize front-to-back processes Rolled out mortgage tools and select workflow automationSimplified onboarding in Private and Corporate BankingTargeted IT investments into simplification / automation – faster to client, lower cost to
serve CBVLow- to mid-single digitCAGR over 2022-2024 Adj. cost/income ratioMid 50s in 2024 Adj. RoRC†>12% in 2024 Key aspirations Footnotes are an integral part of this presentation. See slides 36-40 in the appendix of this presentation
for detailed information, including important presentation and other information relating to non-GAAP financial measures, and defined terms.
Progress on executing our ambitious strategy in Asset Management with a focus on talent and
technology 13 Strengthen and simplify organization and governance model Improve risk management and strengthen our control environment Drive execution towards our long term strategic ambition Strengthened product development process,
including systematic viability and risk appetite assessments Extended and enhanced existing risk management framework and prepared for the build out of strategic priority areas, e.g. Private MarketsLaunch new ‘Everyone is a Risk Manager’
training program Completed hiring and onboarding of senior management team in AM, e.g. Head of Distribution and Head of ProductDefined new global, functionally aligned organizational structureOptimized governance framework to further increase
accountability and efficiencies Embed new global functional organization structure and support talent to thrive in the new AM organization structure Defined new Sustainability Strategy for AM and joined Net Zero Asset Managers
initiativeContinued to exit non-core investments and partnerships portfolio in a value accretive wayInitiated design of future AM / WM collaboration modelInitiated hiring in selected priority markets and investment capabilitiesDevelop detailed
plans for few remaining strategic priority areas, e.g. Private Markets, definition of investment hub and product localization strategy NNA growth>4% in 2024 Management fee marginStable at ~26 bps Adj. cost/income ratio~75% in 2024 Adj.
RoRC†>45% by 2024 Key aspirations Footnotes are an integral part of this presentation. See slides 36-40 in the appendix of this presentation for detailed information, including important presentation and other information relating to
non-GAAP financial measures, and defined terms.
Our recently established CTOO Organization is focused on agile, digital transformation and identifying
rationalization opportunities Rolled out new Engineering & Operations OrganizationLaunched program to adopt agile practices firm-wideLaunched program to leverage enterprise-wide digital core capabilities Aligned with the Strategic
Regulatory Remediation Committee to ensure IT delivery of our commitmentsEnhancing culture of personal accountability and responsibility by “tone from the top”Attracting key talent and becoming a destination of choice for engineers Kicked off
planning and design process to establish single wealth management platformIdentified opportunities to decrease vendor dependencies and expensesIdentified opportunities to materially reduce IT delivery overheadLaunching location strategy to
further identify and build out capabilities in high value locations Strengthen Simplify Establishing Digitization & Investment Governance to prioritize and fully align resources to CS strategy Further driving CSX roll out with ambition
of 200k clients by end-2022Assigning dedicated engineering resources to CS wide ESG focusAutomating across client journey to enhance client experience with initial focus on client onboarding Invest for Growth Best-known Swiss brand for
digital banking in Switzerland Best Structured Product Technological Solution, Americas Best Digital Networking Bank for Entrepreneurs in Asia #1 E-Trading platform in APAC for AES 2021
WatersTechnology Asia Awards – Best AI Initiative HK Technology – Innovative or Emerging Technology Adoption Best Private Bank for Use of RegTech Best Private Bank – Client Experience
Footnotes are an integral part of this presentation. See slides 36-40 in the appendix of this presentation for detailed information, including important presentation and other information relating to
non-GAAP financial measures, and defined terms. 14
Leading the bank and our clients into a sustainable future 15 1Q22 milestones Net Zero Asset
Managers Initiativejoined on March 22, 2022 Sole Conservation Bond Structurer of the World Bank-issuedWildlife Conservation (“Rhino”) Bond Additional policy restrictionson Arctic oil & gas, oil sands and deep sea mining Financial
progress and way forward 2021 Sustainability Reportpublished on March 10, 2022 with additional disclosures including reporting against core WEF IBC Stakeholder Capitalism Metrics and increased TCFD disclosure Sustainability Bond of the year
– sovereign1winner at Environmental Finance Bond Awards for acting as sole structurer & arranger of the Blue Bond for The Nature Conservancy 164 Wealth Management ESG funds3in 1Q22, up from 122 in 1Q21 Sustainable AuM2 of CHF 144 bnin
1Q22 resulting in penetration of 9.3% of total AuM;up from CHF 118 bn and penetration of 7.4% in 1Q21 New Sustainability LeadershipNewly appointed Chief Sustainability Officer, directly reporting to Group CEO Footnotes are an integral part of
this presentation. See slides 36-40 in the appendix of this presentation for detailed information, including important presentation and other information relating to non-GAAP financial measures, and defined terms. Continue to support clients’
transition and expand sustainable investment and finance offering, also via strategic partnerships Further progresstowards our commitment to provide at least CHF 300 bn in sustainable finance by 2030 Reconfirm our commitmentto reach 2050 net
zero emissions in line with the guidelines of the Science Based Targets Initiative
Group Overview Footnotes are an integral part of this presentation. See slides 36-40 in the appendix of
this presentation for detailed information, including important presentation and other information relating to non-GAAP financial measures, and defined terms. 17 Reported net revenuesinclude real estate gains of CHF 164 mn, a loss of CHF 353
mn related to Allfunds and CHF 148 mn of Russia-related impact Provision for credit lossesincludes a CHF 155 mn release related to Archegos, partly offset by CHF 58 mn of provisions related to Russia’s invasion of Ukraine Higher operating
expensesup 26%, driven by major litigation provision of CHF 653 mn, increased cash accruals for compensation due to normalized deferral levels and incremental investments Adjusted PTI of CHF 300 mnpost Russia-related losses of CHF 206 mn and
vs. exceptionally strong 1Q21, from reduced client activity and capital markets issuances in volatile market conditions, cumulative reduction in risk appetite in 2021, impact of hedging volatility due to flattening yield curve in Corporate
Center Treasury results and increased cash accruals for compensation due to normalized deferral levels Credit Suisse Group in CHF mn 1Q22 4Q21 1Q21 Δ 4Q21 Δ 1Q21 Reported Net
revenues 4,412 4,582 7,574 (4)% (42)% Provision for credit losses (110) (20) 4,394 Total operating expenses 4,950 6,266 3,937 (21)% 26% Pre-tax income (428) (1,664) (757) n/m n/m Effective tax
rate 35% (25)% 70% Net income/(loss) attributable to shareholders (273) (2,085) (252) n/m n/m Return on tangible equity‡ (2.6)% (20.9)% (2.6)% Cost/income
ratio 112% 137% 52% Adjusted Net revenues 4,582 4,384 7,430 5% (38)% Provision for credit losses 45 (15) (36) Total operating expenses 4,237 4,071 3,870 4% 9% Pre-tax
income 300 328 3,596 (9)% (92)% o/w Russia-related (206) - -
We have significantly reduced our Russia credit exposure Footnotes are an integral part of this
presentation. See slides 36-40 in the appendix of this presentation for detailed information, including important presentation and other information relating to non-GAAP financial measures, and defined terms. 18 Financial
institutionsnet credit exposure down 67% with further reduction of exposures ongoingCorporates & Individualshighly collateralized with non-Russia collateral and limited losses Substantial reductionin our Russia net credit exposure by 56%
to CHF 373 mn at March 31, 2022 CHF 0.2 bn net asset value of our Russian subsidiaries, down CHF 16 mn vs. December 31, 2021 in CHF mn Gross Net2 Gross Net2 Risk exposure1 1,569 848 1,041 373 o/w
Sovereigns - - 35 35 o/w Financial institutions 634 536 229 177 o/w Corporates 468 148 429 82 o/w Individuals 467 164 348 79 As at December 31, 2021 As at March 31, 2022 PTI losses of CHF 206
mninclude trading and fair value losses of CHF 148 mn as well as PCL of CHF 58 mn, of which CHF 44 mn of non-specific provisions
Higher operating expenses driven by increased cash accruals for compensation due to normalized deferral
levels and incremental investments Footnotes are an integral part of this presentation. See slides 36-40 in the appendix of this presentation for detailed information, including important presentation and other information relating to non-GAAP
financial measures, and defined terms. 19 Group adjusted operating expensesin CHF mn Higher compensation and benefitsprimarily driven by CHF 214 mn of increased cash accruals for compensation due to normalized deferral levels
Incremental investmentsof CHF 152 mn in relation to our Group strategy and increased remediation spend in Risk, Compliance and Infrastructure Restructuring expensesof CHF 79 mn over 4Q21-1Q22, with CHF 46 mn in 1Q22, out of our guidance
of CHF ~400 mn, with the balance to be utilized over the rest of the year Outsourcing of Procurementexpected to lead to cash savings of CHF 150 mn in 2022, rising to CHF 250 mn in 2023; other cost measures, e.g. CTOO integration to yield
savings later in the year, increasing into 2023
Wealth Management & Private Banking Switzerland CBV impacted by adverse market movements; positive
NNA across all regions Footnotes are an integral part of this presentation. See slides 36-40 in the appendix of this presentation for detailed information, including important presentation and other information relating to non-GAAP financial
measures, and defined terms. 20 Regions AuM NNA Switzerland 238 2.1 EMEA 284 0.6 Asia Pacific 212 1.8 Americas 82 0.1 Total 816 4.6 Wealth Management & Private Banking Switzerland1Q22 regional volumesin CHF
bn Market moves (35)FX impact 7Other1 (16)NNA 5 Assets under Management Net loans Custody assets (5)%QoQ Wealth Management & Private Banking Switzerland1Q22 volumes overviewin CHF bn AuM CBV Wealth Management Private
BankingSwitzerland
Resilient CET1 capital and leverage ratios Footnotes are an integral part of this presentation. See
slides 36-40 in the appendix of this presentation for detailed information, including important presentation and other information relating to non-GAAP financial measures, and defined terms. 21 CET1 ratio down 60 bpswith RWA increases of CHF
2 bn from operational risk (excluding FX) and CHF 2 bn from FX, partly offset by a reduction of USD 2 bn from Prime Services exit2 Leverage exposure down CHF 11 bndriven by a reduction of USD 20 bn from Prime Services exit2 Parent CET1 ratio
of 11.8%vs. 11.4% at January 1, 2022, including dividend payment from CS Schweiz and capital repatriation from CSH USA totaling CHF ~2 bn; further planned dividend payments and capital repatriations from subsidiaries expected to increase the
CET1 ratio in the second half of the year, subject to regulatory approval 13.8% CET1 ratio 14.4% Risk-weighted assets in CHF bn 1 Leverage exposure in CHF bn o/w IB (13) o/w WM, SB, AM 0 1 4.3% CET1 leverage
ratio 4.3% 6.1% Tier 1 leverage ratio 6.1% o/w IB 0 o/w WM, SB, AM 1
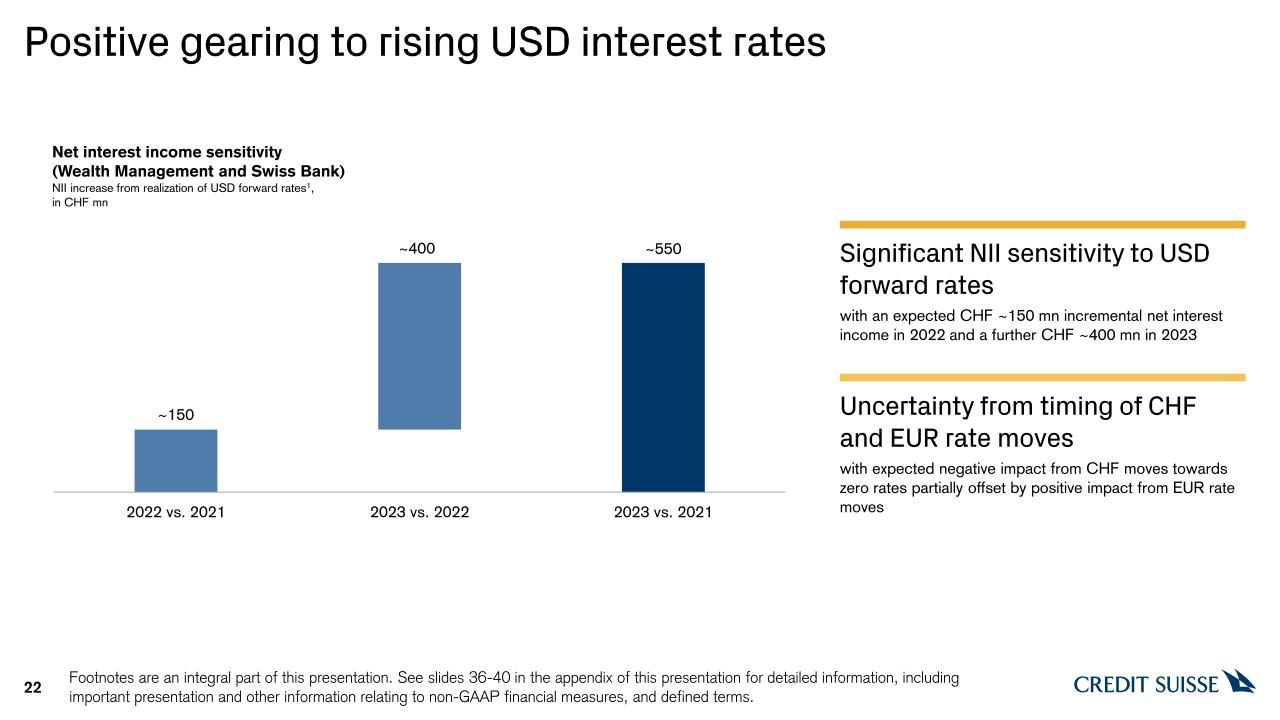
Positive gearing to rising USD interest rates Footnotes are an integral part of this presentation. See
slides 36-40 in the appendix of this presentation for detailed information, including important presentation and other information relating to non-GAAP financial measures, and defined terms. 22 Net interest income sensitivity(Wealth
Management and Swiss Bank)NII increase from realization of USD forward rates1,in CHF mn Significant NII sensitivity to USD forward rateswith an expected CHF ~150 mn incremental net interest income in 2022 and a further CHF ~400 mn in
2023 Uncertainty from timing of CHF and EUR rate moveswith expected negative impact from CHF moves towards zero rates partially offset by positive impact from EUR rate moves
Wealth Management Footnotes are an integral part of this presentation. See slides 36-40 in the appendix
of this presentation for detailed information, including important presentation and other information relating to non-GAAP financial measures, and defined terms. 23 PTI significantly down YoY from lower transaction activity and
Russia-related impacts Transaction revenues downvs. strong 1Q21 reflecting Russia-related losses of CHF 59 mn, MtM losses2 in APAC Financing of CHF 32 mn, weaker GTS revenues and lower brokerage and product issuance feesFees and net interest
income declinebroadly mirrors YoY reductions in volumes; NII up QoQInvesting in our businessHigher operating expenses driven by increased cash accruals for compensation due to normalized deferral levels, technology investments, higher
Group-wide risk and compliance costs and higher RM headcountReported PTI reflects headwindsincluding CHF 353 mn loss on investment in Allfunds; major litigation provisions of CHF 230 mn; Russia-related impacts of CHF (99) mn, including credit
provisions of CHF 40 mn De-risking impacted volumes & flowswith lower loan volumes from Russia’s invasion of Ukraine and de-risking measures; CBV down 5% QoQ due to market movements and structural effects; positive NNA in difficult
environment in CHF mn 1Q22 4Q21 1Q21 Δ 1Q21 Adjusted key financials Net interest income 514 502 561 (8)% Recurring commissions and fees 420 432 444 (5)% Transaction-based 578 413 938 (38)% Net
revenues1 1,506 1,345 1,941 (22)% Provision for credit losses 24 (7) 13 Total operating expenses 1,270 1,214 1,098 16% Adjusted PTI 212 138 830 (74)% o/w Russia-related
impact (99) - - Adjusted C/I ratio 84% 90% 57% Adjusted RoRC† 7% 5% 26% Reported PTI (357) 157 978 n/m Reported RoRC† (12)% 5% 31% in CHF bn Key
metrics Adjusted net margin in bps 12 7 46 (34) Client business volume 1,040 1,099 1,143 (9)% Net loans 97 103 114 (14)% Net new assets 4.8 (2.9) 14.5 Risk-weighted
assets 60 60 68 (12)% Leverage exposure 233 233 245 (5)% Number of relationship managers 1,940 1,890 1,900 2%
Investment Bank Footnotes are an integral part of this presentation. See slides 36-40 in the appendix of
this presentation for detailed information, including important presentation and other information relating to non-GAAP financial measures, and defined terms. 24 Pre-tax loss reflects substantially reduced Capital Markets revenues,
Russia-related losses and reduced capital usage primarily due to Prime Services exit in USD mn 1Q22 4Q21 1Q21 Δ 1Q21 Adjusted key financials Fixed income sales & trading 802 504 1,616 (50)% Equity sales &
trading 526 403 1,030 (49)% Capital markets 466 585 1,361 (66)% Advisory and other fees 221 331 257 (14)% Other1 5 (3) (1) n/m Net revenues 2,020 1,820 4,263 (53)% Provision for credit
losses (2) (3) (72) Total operating expenses 2,077 2,007 1,961 6% Adjusted PTI (55) (184) 2,374 n/m o/w Russia-related impact (101) - - Adjusted C/I ratio 103% 110% 46% Adjusted
RoRC† (1)% (4)% 42% Reported PTI 134 (2,174) (2,387) n/m Reported RoRC† 3% (45)% (42)% in USD bn Key metrics Risk-weighted assets 93 92 117 (21)% Leverage
exposure 364 380 444 (18)% Net revenues down 53% vs. record 1Q21Significantly lower ECM activity and reduced M&A fees; lower YoY leveraged finance revenues due to reduced risk appetite, however regained share2 QoQLower GTS results
reflecting underperformance in macro and emerging markets and resilient equity derivatives trading revenues vs. strong 1Q21Fixed Income results mainly reflect normalized securitized products revenues, albeit significantly above historic
levelsEquities revenues include the impact from the exit3 of prime services and lower cash trading volumes; we maintained a #6 rank4 in cash equitiesOperating expenses increased 6%primarily driven by increased cash accruals for compensation due
to normalized deferral levels and higher Group-wide technology, risk & compliance costsPre-tax loss of USD 55 mnreflecting our strategy to de-risk our franchise, lower client activity across all businesses and Russia-related losses of USD
101 mn, of which USD 97 mn in GTS from trading and fair value losses; reported PTI of USD 134 mn includes real estate gains of USD 57 mn and Archegos impact5 of USD 174 mn RWA and LE declined YoYprimarily due to reductions in Prime Services;
reduced allocated capital by USD 2.5 bn vs. 2020, on track to achieve our ambition of USD >3 bn capital release by 2022
Swiss Bank Footnotes are an integral part of this presentation. See slides 36-40 in the appendix of this
presentation for detailed information, including important presentation and other information relating to non-GAAP financial measures, and defined terms. 25 Resilient results despite higher compensation expenses in CHF
mn 1Q22 4Q21 1Q21 Δ 1Q21 Adjusted key financials Net interest income 576 587 591 (3)% Recurring commissions and fees 336 332 314 7% Transaction-based 136 138 142 (4)% Net
revenues1 1,022 1,039 1,031 (1)% Provision for credit losses 23 (4) 26 o/w Russia-related impact 14 - - Total operating expenses 614 605 586 5% Adjusted PTI 385 438 419 (8)% Adjusted C/I
ratio 60% 58% 57% Adjusted RoRC† 12% 13% 12% Reported PTI 471 607 412 14% Reported RoRC† 14% 18% 12% in CHF bn Key metrics Adjusted net margin in
bps 26 30 30 (4) Client business volume 871 890 856 2% Net loans 163 161 165 (1)% Net new assets 6.0 1.0 3.8 Risk-weighted assets 70 69 73 (4)% Leverage
exposure 248 248 254 (2)% Number of relationship managers 1,680 1,630 1,660 1% Net revenues stablewith an increase of 7% in recurring commissions and fees supported by higher revenues from improved performance in our investment
in Swisscard and higher AuM levels, offset by lower net interest income and decreased transaction-based revenues driven by lower IB collaboration revenuesOperating expenses up 5%from increased cash accruals for compensation due to normalized
deferral levels, targeted investments in Swiss business and higher Group-wide technology, risk and compliance costsPTI down 8%due to higher operating expenses; RoRC† at 12%Russia-related impact of CHF 14 mnin provision for credit
losses Client business volume up 2%mainly driven by NNA; net loans up 1% compared to 4Q21 driven by our corporate banking and institutional clients businesses; NNA of CHF 6.0 bn entirely driven by our institutional clients business
Asset Management Footnotes are an integral part of this presentation. See slides 36-40 in the appendix
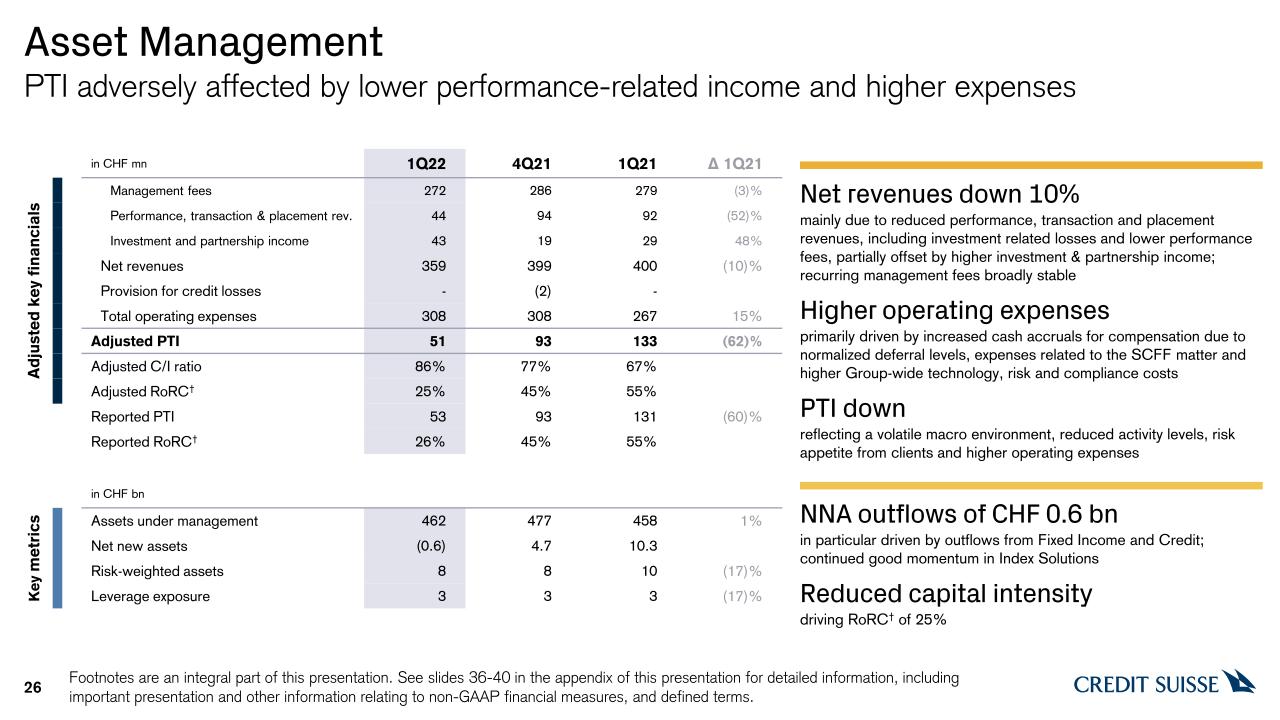
of this presentation for detailed information, including important presentation and other information relating to non-GAAP financial measures, and defined terms. 26 PTI adversely affected by lower performance-related income and higher
expenses in CHF mn 1Q22 4Q21 1Q21 Δ 1Q21 Adjusted key financials Management fees 272 286 279 (3)% Performance, transaction & placement rev. 44 94 92 (52)% Investment and partnership
income 43 19 29 48% Net revenues 359 399 400 (10)% Provision for credit losses - (2) - Total operating expenses 308 308 267 15% Adjusted PTI 51 93 133 (62)% Adjusted C/I
ratio 86% 77% 67% Adjusted RoRC† 25% 45% 55% Reported PTI 53 93 131 (60)% Reported RoRC† 26% 45% 55% in CHF bn Key metrics Assets under
management 462 477 458 1% Net new assets (0.6) 4.7 10.3 Risk-weighted assets 8 8 10 (17)% Leverage exposure 3 3 3 (17)% Net revenues down 10%mainly due to reduced performance, transaction and placement
revenues, including investment related losses and lower performance fees, partially offset by higher investment & partnership income; recurring management fees broadly stableHigher operating expensesprimarily driven by increased cash
accruals for compensation due to normalized deferral levels, expenses related to the SCFF matter and higher Group-wide technology, risk and compliance costsPTI downreflecting a volatile macro environment, reduced activity levels, risk appetite
from clients and higher operating expenses NNA outflows of CHF 0.6 bnin particular driven by outflows from Fixed Income and Credit; continued good momentum in Index SolutionsReduced capital intensitydriving RoRC† of 25%
Investor Deep Dive Footnotes are an integral part of this presentation. See slides 36-40 in the appendix
of this presentation for detailed information, including important presentation and other information relating to non-GAAP financial measures, and defined terms. 27 Risk, Compliance, Technology and Wealth Management Deep Dive Event to be
held before 2Q22 results, date to be announced in due course
CEO concluding remarks Footnotes are an integral part of this presentation. See slides 36-40 in the
appendix of this presentation for detailed information, including important presentation and other information relating to non-GAAP financial measures, and defined terms. 28 Further strengthen risk culture Accelerate client and revenue
momentum Execute strategic plan
Net and gross margins Footnotes are an integral part of this presentation. See slides 36-40 in the
appendix of this presentation for detailed information, including important presentation and other information relating to non-GAAP financial measures, and defined terms. 30 Adjusted gross margin in
bps 1Q22 4Q21 2Q21 1Q21 3Q21 1Q22 4Q21 2Q21 1Q21 3Q21 729 830 Average AuM in CHF bn Adjusted pre-tax income in CHF mn Adjusted net revenues in CHF
mn 1,941 1,547 1,567 384 432 754 759 1,506 212 724 1,345 138 755 Wealth
Management 1Q22 4Q21 2Q21 1Q21 3Q21 1Q22 4Q21 2Q21 1Q21 3Q21 560 419 1,031 1,019 1,049 450 448 579 592 1,022 385 588 1,039 438 593 Swiss Bank Adjusted net margin in bps
Corporate Center Footnotes are an integral part of this presentation. See slides 36-40 in the appendix
of this presentation for detailed information, including important presentation and other information relating to non-GAAP financial measures, and defined terms. 31 Corporate Center in CHF mn 1Q22 4Q21 1Q21 Δ
1Q21 Adjusted key financials Treasury results (254) (130) 129 n/m Asset Resolution unit 39 17 (33) n/m Other1 42 48 78 (46)% Net revenues (173) (65) 174 n/m Provision for credit
losses (1) - (10) Total operating expenses 125 107 140 (11)% Adjusted PTI (297) (172) 44 n/m Reported PTI (719) (533) 32 n/m in CHF bn Key metrics Total
assets 56 55 57 (3)% Risk-weighted assets 49 46 42 16% Leverage exposure 58 58 62 (5)% ARU within Corporate Center in CHF mn 1Q22 4Q21 1Q21 Δ 1Q21 Key financials Net
revenues 39 17 (33) n/m Provision for credit losses (1) 0 (1) Total operating expenses 30 27 36 (17)% PTI 10 (10) (68) n/m in USD bn Key metrics Risk-weighted
assets 7 8 9 (23)% Leverage exposure 16 18 20 (23)%
Oil & Gas / Leveraged Finance exposures Footnotes are an integral part of this presentation. See
slides 36-40 in the appendix of this presentation for detailed information, including important presentation and other information relating to non-GAAP financial measures, and defined terms. 32 Oil & Gas exposure1in USD bn Leveraged
Finance exposure2in USD bn
Currency mix & Group capital metrics Footnotes are an integral part of this presentation. See slides
36-40 in the appendix of this presentation for detailed information, including important presentation and other information relating to non-GAAP financial measures, and defined terms. 33 Adjusted Credit Suisse Group results Applying a +/-
10% movement on the average FX rates for 1Q22 LTM, the sensitivities are:USD/CHF impact on 1Q22 LTM pre-tax income by CHF +332 / (332) mnEUR/CHF impact on 1Q22 LTM pre-tax income by CHF +150 / (150) mn Sensitivity analysis on Group
results2 1Q22 LTMin CHF mn Contribution Wealth Management Investment Bank Swiss Bank Asset Management Group CHF USD EUR GBP Other Currency mix capital metric3 A 10% strengthening / weakening of the USD (vs.
CHF) would have a (2.6) bps / +3.0 bps impact on the BIS CET1 ratio Basel III Risk-weighted assets Swiss leverage exposure CHF EUR Other USD USD CET1 capital 4 CHF Net revenues 19,696 29% 44% 12% 3%
12%Total expenses1 16,393 32% 33% 5% 10% 20% Net revenues 5,965 13% 48% 17% 4% 18%Total expenses1 4,799 34% 23% 7% 6% 30% Net revenues 8,360 5% 64% 13% 5% 13%Total expenses1 7,363 7% 50% 5% 15% 23% Net revenues 4,129 90% 2% 5% 1% 2%Total
expenses1 2,408 89% 2% 2% 2% 5% Net revenues 1,580 51% 36% 10% 1% 2%Total expenses1 1,183 42% 38% 6% 8% 6%
34 Results excluding certain items included in our reported results are non-GAAP financial measures.
Following the reorganization implemented at the beginning of 2022, we have amended the presentation of our adjusted results. Management believes that such results provide a useful presentation of our operating results for purposes of assessing
our Group and divisional performance consistently over time, on a basis that excludes items that management does not consider representative of our underlying performance. Provided below is a reconciliation of our adjusted results to the most
directly comparable US GAAP measures. Reconciliation of adjustment items (1/2)
35 Results excluding certain items included in our reported results are non-GAAP financial measures.
Following the reorganization implemented at the beginning of 2022, we have amended the presentation of our adjusted results. Management believes that such results provide a useful presentation of our operating results for purposes of assessing
our Group and divisional performance consistently over time, on a basis that excludes items that management does not consider representative of our underlying performance. Provided below is a reconciliation of our adjusted results to the most
directly comparable US GAAP measures. Reconciliation of adjustment items (2/2)
Notes 36 General notesThroughout this presentation and the 1Q22 Results presentation rounding
differences may occurUnless otherwise stated, all financial numbers presented and discussed are adjusted. Results excluding certain items included in our reported results are non-GAAP financial measures. All percentage changes and comparative
descriptions refer to YoY measurements unless otherwise specifiedUnless otherwise noted, all CET1 capital, CET1 ratio, Tier 1 leverage ratio, risk-weighted assets and leverage exposure figures shown in these presentations are as of the end of
the respective periodGross and net margins are shown in basis pointsGross margin = net revenues annualized / average AuM; net margin = pre-tax income annualized / average AuM. Net margin excluding certain significant items, as disclosed herein,
is calculated excluding those items applying the same methodologyMandates reflect advisory and discretionary mandate volumesMandate penetration reflects advisory and discretionary mandate volumes as a percentage of AuM, excluding those from the
external asset manager businessParent means Credit Suisse AG on a standalone basis. All CET1 capital and CET1 ratio figures shown in these presentations for Parent are Swiss capital metricsClient Business Volume includes assets under
management, custody assets and net loansCustody assets includes assets under custody and commercial assetsSpecific notes† Regulatory capital is calculated as the average of 13.5% of RWA and 4.25% of leverage exposure and return on regulatory
capital, a non-GAAP financial measure, is calculated using income/(loss) after tax and assumes a tax rate of 25% from 2020 onward. For the Investment Bank, return on regulatory capital is based on US dollar denominated numbers. Return on
regulatory capital excluding certain items included in our reported results is calculated using results excluding such items, applying the same methodology. Adjusted return on regulatory capital excluding certain items included in our reported
results is calculated using results excluding such items, applying the same methodology.‡ Return on tangible equity, a non-GAAP financial measure, is calculated as annualized net income attributable to shareholders divided by average tangible
shareholders’ equity. Tangible shareholders’ equity, a non-GAAP financial measure, is calculated by deducting goodwill and other intangible assets from total shareholders’ equity as presented in our balance sheet.For end-1Q21, tangible
shareholders’ equity excluded goodwill of CHF 4,644 mn and other intangible assets of CHF 239 mn from total shareholders’ equity of CHF 44,590 mn as presented in our balance sheet.For end-4Q21, tangible shareholders’ equity excluded goodwill of
CHF 2,917 mn and other intangible assets of CHF 276 mn from total shareholders’ equity of CHF 43,954 mn as presented in our balance sheet.For end-1Q22, tangible shareholders’ equity excluded goodwill of CHF 2,931 mn and other intangible assets
of CHF 307 mn from total shareholders’ equity of CHF 44,442 mn as presented in our balance sheet.Our ambition to release USD >3 bn of capital from the Investment Bank over 2021-2022 and our ambition to invest CHF ~3 bn of capital in Wealth
Management over 2021-2024 is based on an average of 13.5% risk-weighted assets and 4.25% leverage exposure.AbbreviationsAdj. = Adjusted; AM = Asset Management; APAC = Asia Pacific; ARU = Asset Resolution Unit; AuM = Assets under Management; BIS
= Bank of International Settlements; bps = basis points; CAGR = Compound annual growth rate; CBV = Client Business Volume; CC = Corporate Center; CET1 = Common Equity Tier 1; CHF = Swiss Franc; CM = Capital Markets; CMBS = commercial
mortgage-backed securities; COVID = Coronavirus disease; CTOO = Chief Technology and Operations Officer; C/I = cost income ratio; ECM = Equity Capital Markets; EMEA = Europe, Middle East and Africa; ESG = Environment, Social, Governance; EUR =
Euro; FINMA = Swiss Financial Market Supervisory Authority; FX = Foreign Exchange; GAAP = Generally Accepted Accounting Principles; GTS = Global Trading Solutions; HNW = High Net Worth; IB = Investment Bank; IG = Investment Grade; IT =
Information Technology; LE = Leverage exposure; LTM = Last twelve months; M&A = Mergers & Acquisitions; MD = Managing Director; MtM = mark to market; NII = net interest income; NNA = Net New Assets; p.a. = per annum; PB = Private
Banking; PBI = Private Banking International; PCL = provision for credit losses; pp. = percentage points; PTI = Pre-tax income; QoQ = Quarter on Quarter; rev. = revenues; RM = Relationship Manager; RoRC = Return on Regulatory Capital; RWA =
Risk-weighted assets; SB = Swiss Bank; SCFF = Supply Chain Finance Funds; SME = Small and Medium Enterprises; SoW = Share of Wallet; TCFD = Task Force on Climate-Related Financial Disclosures; USD = United States Dollar; vs. = versus; WEF IBC =
World Economic Forum’s International Business Council; WM = Wealth Management; YoY = Year on year
Footnotes 37 Slide 4 2022 is a transition year for Credit Suisse – 1Q22 key messages1. With the
exception of Index Access and APAC Delta One2. Exposure is net of risk mitigation, specific allowances, specific provisions for credit losses and valuation adjustmentsSlide 6 …impacting Wealth Management and the Investment Bank while our Swiss
Bank remained resilient1. Includes MtM losses in APAC Financing 2. Includes Wealth Management & Private Banking SwitzerlandSlide 7 Comprehensive de-risking measures executed, improving our risk profile but impacting top-line in the
short-term1. Primarily driven by Ship Financing, concentration risks and client risk reviews2. With the exception of Index Access and APAC Delta OneSlide 8 Select updates on strengthening of Risk Management and addressing legacy issues1.
Includes any type of case against Credit Suisse2. Exposure is net of risk mitigation, specific allowances, specific provisions for credit losses and valuation adjustmentsSlide 9 Select Group Strategy metrics and milestones progress1. Measured
using adjusted operating expenses, excluding significant items, at constant 2021 FX rates, progressively increasing from 2022-2024; does not include cost reductions from exited businesses2. With the exception of Index Access and APAC Delta
One3. Refers to Credit Suisse’s assets managed according to the Credit Suisse Sustainable Investment Framework (Sustainable AuM). This includes only AuM balances from managed solutions that to date have been mapped to a sustainability rating of
2 and higher, based on the Framework scale (0-5). The majority of this growth vs. 1Q21 has been achieved through progress on our framework implementation and product classification. The other relevant drivers include the launch of new
sustainable funds and net sales of existing sustainable funds partially offset by market performance4. Since the beginning of 20215. Includes transfer of existing Bonviva clients to the CSX solutions
Footnotes 38 Slide 11 Continued progress on reshaping the Investment Bank and investing for growth1.
Allocated capital based on the average of 13.5% RWA and 4.25% Leverage Exposure2. Client Energy Transition Framework (CETF) reflects CS methodology to assess the climate transition readiness of our clients3. With the exception of Index Access
and APAC Delta One4. MD hires from January 1, 2021 to March 31, 20225. Source: Dealogic as of March 31, 2022 6. Source: Source CMBS Alert as of March 31, 20227. Source: Tradeweb as of March 31, 2022Slide 12 Swiss Bank building on its leading
positions1. Dealogic as of 31 December 20212. BCGSlide 15 Leading the bank and our clients into a sustainable future1. Environmental Finance2. Refers to Credit Suisse’s assets managed according to the Credit Suisse Sustainable Investment
Framework (Sustainable AuM). This includes only AuM balances from managed solutions that to date have been mapped to a sustainability rating of 2 and higher, based on the Framework scale (0-5). The majority of this growth vs. 1Q21 has been
achieved through progress on our framework implementation and product classification. The other relevant drivers include the launch of new sustainable funds and net sales of existing sustainable funds partially offset by market performance3.
Refers to Credit Suisse Wealth Management Global Lead Offering funds (including both CS and Third Party Funds) that, as of March 31, 2022, have been mapped to a sustainability classification of 2 and higher, based on the CS Sustainable
Investments Framework scale (0-5)
Footnotes 39 Slide 18 We have significantly reduced our Russia credit exposure1. Exposure is net of
specific allowances, specific provisions for credit losses and valuation adjustments2. Post risk mitigation including hedges (derivatives), guarantees, insurance and collateralSlide 20 Wealth Management and Private Banking Switzerland CBV
impacted by adverse market movement; positive NNA across all regions1. Structural effects, including certain de-risking measures and CHF 10.4 bn related to the sanctions imposed in connection with Russia’s invasion of UkraineSlide 21 Resilient
CET1 capital and leverage ratios1. FX impact from January to March FX rates2. With the exception of Index Access and APAC Delta OneSlide 22 Positive gearing to rising USD interest rates1. As of March 31, 2022Slide 23 Wealth Management1.
Includes other revenues of CHF (6) mn in 1Q22, CHF (2) mn in 4Q21 and CHF (2) mn in 1Q212. 1Q22 mark-to-market losses of CHF (34) mn (net of CHF 7 mn of hedges). 1Q21 included mark-to-market losses of CHF (3) mn (net of CHF 4 mn of hedges)Slide
24 Investment Bank1. Other revenues include treasury funding costs and changes in the carrying value of certain investments2. Source: Dealogic as of March 31, 2022 3. With the exception of Index Access and APAC Delta One 4. Third Party
competitive analysis as of FY 20215. Archegos impact includes revenues of USD 19 mn, credit provisions release of USD (167) mn and expenses of USD 12 mn
Footnotes 40 Slide 25 Swiss Bank1. Includes other revenues of CHF (26) mn in 1Q22, CHF (18) mn in 4Q21
and CHF (16) mn in 1Q21Slide 31 Corporate Center1. Other revenues primarily include required elimination adjustments associated with trading in own shares, treasury commissions charged to divisions, the cost of certain hedging transactions
executed in connection with the Group's RWAs and valuation hedging impacts from long-dated legacy deferred compensation and retirement programs mainly relating to former employees Slide 32 Oil & Gas / Leveraged Finance exposures1. Oil &
Gas net lending exposure in Corporate Bank2. Represents non-Investment Grade underwriting exposureSlide 33 Currency mix & capital metrics1. Total expenses include provisions for credit losses2. Sensitivity analysis based on Adjusted numbers
and on weighted average exchange rates of USD/CHF of 0.92 and EUR/CHF of 1.01 for 1Q22 LTM results3. Data based on March 2022 month-end currency mix4. Reflects actual capital positions in consolidated Group legal entities (net assets) including
net asset hedges less applicable Basel III regulatory adjustments (e.g. goodwill)
Signatures
Pursuant to the requirements of the Securities Exchange Act of 1934, the registrants
have duly caused this report to be signed on their behalf by the undersigned, thereunto
duly authorized.
CREDIT SUISSE GROUP AG and CREDIT SUISSE AG
(Registrants)
Date: April 27, 2022
By:
/s/ Thomas Gottstein /s/ David R. Mathers
Thomas Gottstein David R. Mathers
Chief Executive Officer Chief Financial Officer
 Form 40-F