| 4 第 个QTR 2021 投资者演示文稿 纳斯达克:mrbk ® |

| 2 Meridian Corporation Forward - Looking Statements Meridian Corporation (the “Corporation”) may from time to time make written or oral “forward - looking statements” within the meaning of the “Safe harbor” provisions of the Private Securities Litigation Reform Act of 1995 . These forward - looking statements include statements with respect to Meridian Corporation’s strategies, 目标、 信念、 期望、 估计、 意图、 资金 筹集 努力、 financial condition and results of operations, future performance and business . Statements preceded by, 之后 or that include the words “may,“ ”可能,“ ”应该,“ ”预计 表格,“ ”展望 ,“ ”将,“ ”相信,“ ”预期,“ ”预期,“ ”估计,“ ”打算,“ ”计划,“ ”项目“, or similar expressions generally indicate a forward - looking statement . These forward - looking statements involve risks and uncertainties that are subject to change based on various important 因数 ( 中的一些 , 整体 或 部分 、 are beyond Meridian Corporation’s control) . Numerous competitive, 经济、 监管、 法律 和 技术 因素、 risks and uncertainties including, without limitation : the impact of the ongoing COVID - 19 pandemic and government responses thereto, on the U . S . economy and customer behavior, including the markets in which we operate ; actions that we and our customers take in response to these factors and the effects such actions have on our operations, 产品, services and customer relationships ; and the risk that the Small Business Administration may not fund some or all Paycheck Protection Program (PPP) loan guaranties, the effects of actions by the federal government, including the Board of Governors of the Federal Reserve System and other government agencies, that may affect market interest rates and the money supply, 以及 其他 , could cause Meridian Corporation’s financial performance to differ materially from the goals, 计划、 目标、 intentions and expectations expressed in such forward - looking statements . Meridian Corporation cautions that the foregoing factors are not exclusive, and neither such factors nor any such forward - looking statement takes into account the impact of any future events . All forward - looking statements and information set Forth herein are based on management’s current beliefs and assumptions as of the date hereof and speak only as of the date they are made . For a more complete{Br}讨论 假设, risks and uncertainties related to our business, you are encouraged to review Meridian Corporation’s filings with the Securities and Exchange Commission, including our Annual Report on Form 10 - K for the year ended December 31 , 2020 and subsequently filed quarterly reports on Form 10 - Q and current reports on Form 8 - K that update or provide information in addition to the information Included in the Form 10 - K and Form 10 - Q filings, if any . Meridian Corporation does not undertake to update any forward - looking statement whether written or oral, that may be made from time to time by Meridian Corporation or by or on behalf of Meridian Bank, except as may be required under applicable law . |
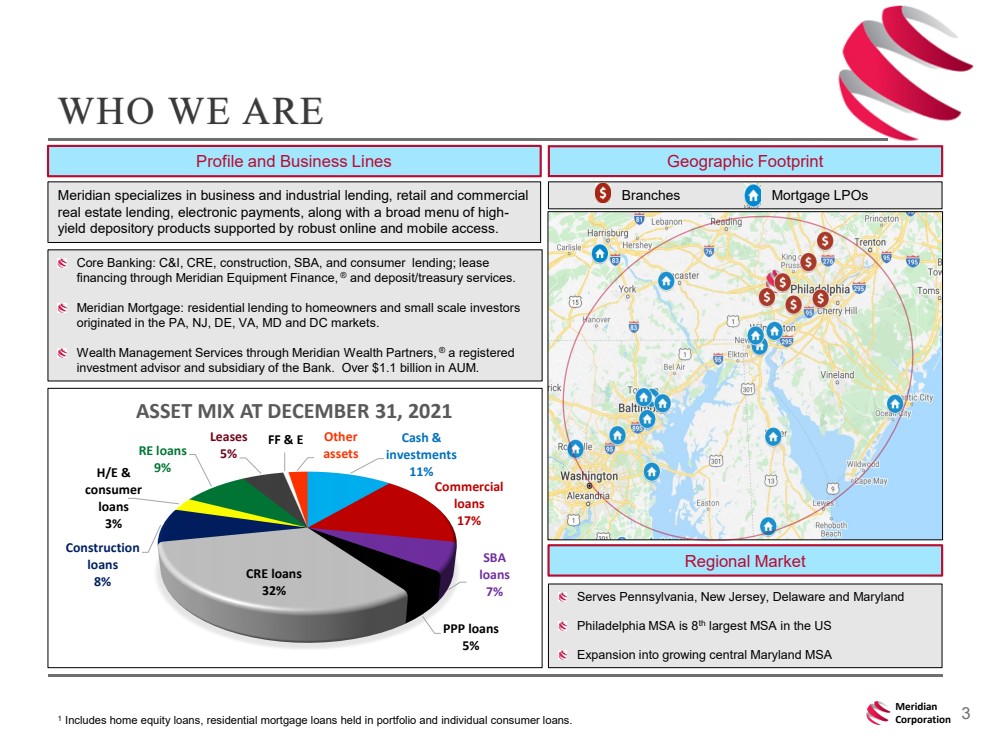
| 3 子午线 公司 世卫组织 我们是 1 包括房屋净值贷款、投资组合中持有的住宅抵押贷款和个人消费贷款。 地理Footprint Branches Mortgage LPOs Regional市场 服务于宾夕法尼亚州、新泽西州、特拉华州和马里兰州 马里兰州 费城马萨诸塞州是美国第8大马萨诸塞州 扩展到不断增长的马里兰州中部 和消费贷款;租赁 通过Meridian Equipment Finance、 ® 和存款/金库服务融资。 Meridian Mortgage: 面向房主和小规模投资者的住宅贷款 源自PA、NJ、DE、VA、MD和DC 市场。 通过Meridian Wealth Partners提供的财富管理服务, ® 超过11亿美元的AUM。 Meridian专门从事商业和工业贷款,零售和商业房地产贷款,电子支付,以及广泛的高收益 - 托管产品,由强大的在线和移动访问提供支持。 Cash& investments 11% Commercial loans 17% SBA loans 7% PPP Loans 5% Cash loans 32% Construction loans 8% H/E& Consumer Loans 3% RE贷款 9% 租赁 5% FF&E 其他 资产 截至12月31日的资产组合,2021年 |
| 4 子午线 公司 我们 提供的 商业/工业、房地产和 消费者方面的咨询专业知识。我们的 经验丰富的商业银行家精心设计了定制的金融解决方案,帮助我们的客户蓬勃发展。 利用特拉华谷三大州市场 - 州市场 的销售文化和银行重大失误, 在多元化贷款领域展示了 有机增长引擎。 金融服务业务模式在Meridian Mortgage、SBA Lending和Meridian Wealth Partners中有显著的非 - 利息收入流。 在Meridian Mortgage、SBA Lending和Meridian Wealth Partners中,金融服务业务模式具有显著的非 - 利息收入流允许“分行 - lite”的银行战略,提供 实质性的运营杠杆。 熟练、长期的 - 终身管理团队,具有丰富的 - 市场经验 。 资产质量优异 贷款组合多样化。 商业地产(CRE)集中度低;专注于规模较小、工期较短的 项目,使其更加 灵活 。 全国公认的优秀工作场所;历史上员工流动率非常低。 |

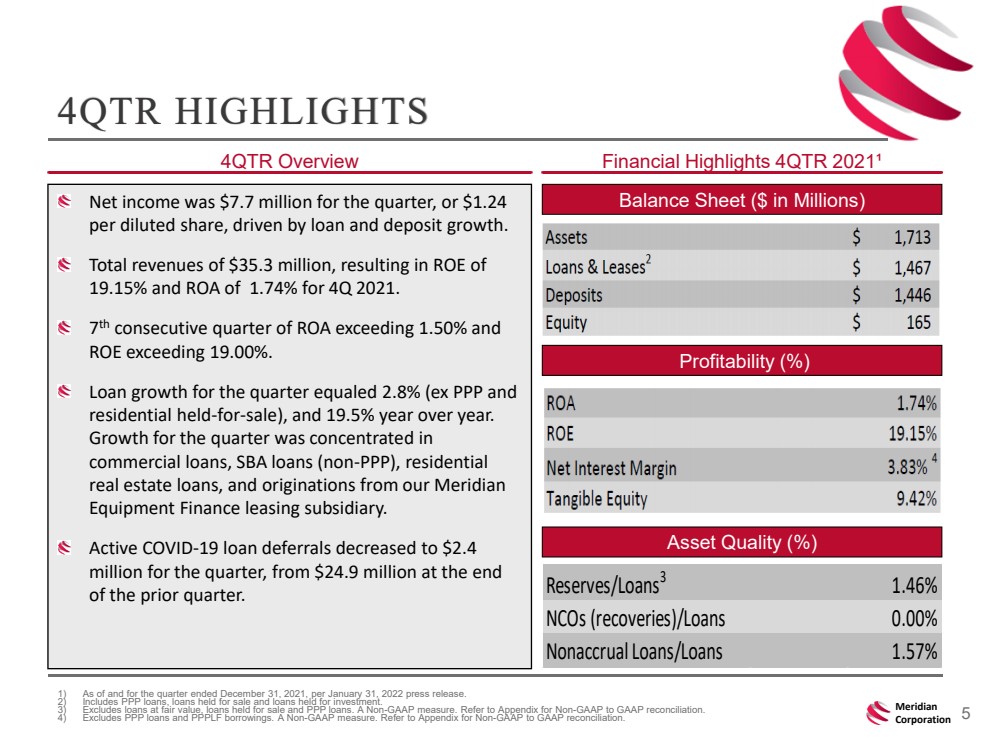
| 根据2022年1月31日的新闻稿,5 Meridian Corporation 4 qtr重点介绍了截至2021年12月31日的季度 1) 。 2) 包括PPP贷款、待售贷款和投资贷款。 3) 不包括公允价值贷款、待售贷款和PPP贷款。非 - GAAP度量。非 - GAAP到GAAP记录 调节参见附录。 4) 不包括PPP贷款和PPPLF借款。非 - GAAP度量。请参阅附录了解非 - 公认会计准则到公认会计准则的对账。 4 qtr Overview Financial Highlights 4 QTR 2021年» 资产负债表 表(百万美元) 资产 质量(%) 盈利能力(%) 本季度净收入为 770万美元,或每股稀释后收益1.24亿美元。受 贷款 和存款增长的推动。 总收入 $3530万 ,2021年第四季度净资产收益率(ROE)为19.15% ,净资产收益率(ROA)为 1.74%。 连续7个季度净资产收益率(ROA)超过1.50%, 净资产收益率(ROE)超过19.00%。 本季度贷款增长相当于 2.8% (不含购买力平价(PPP)和 住宅持有 - 销售 和19.5% 同比增长。 本季度增长集中在 商业贷款 、SBA贷款(非 - ppp)、 住宅 房地产贷款和我们子午线 设备金融租赁子公司的 发端。 活跃的COVID - 19笔贷款 延期减少 从前一次quarter. Reserves/Loans 3 1.46% NCOs(回收)/贷款 结束时的 $2490万 % 0.00% 非应计贷款/贷款 1.57% |
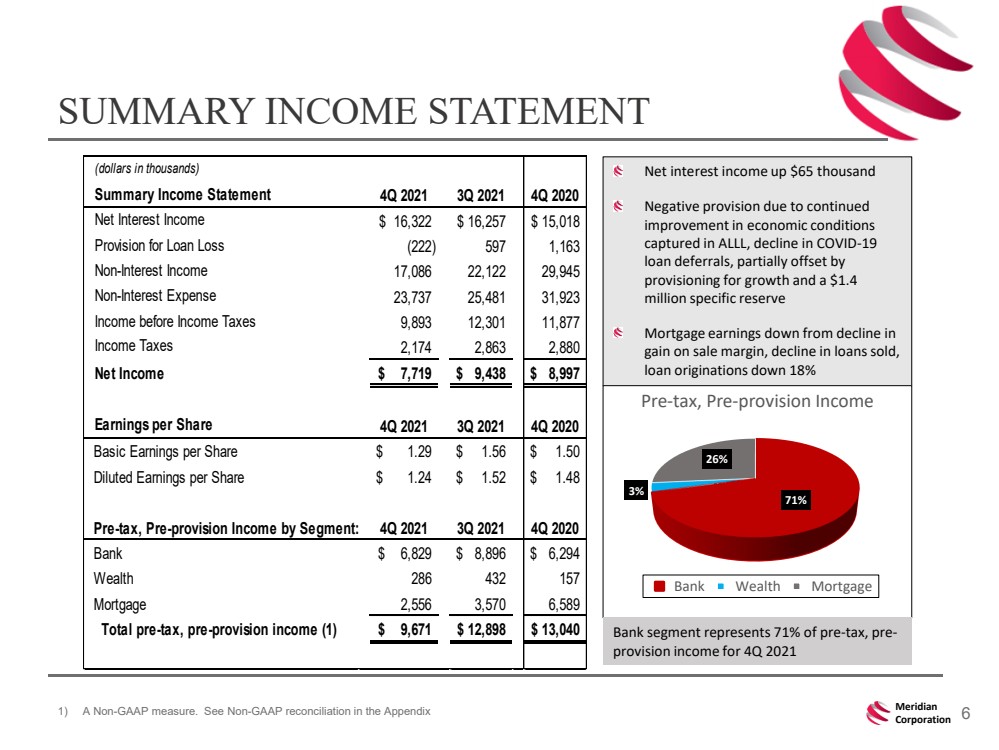
| 6 子午线 公司 汇总损益表 1) 非 - GAAP衡量标准。见附录中的 非 - GAAP对账 净利息收入增加$65,000 负拨备,原因是: ALLL中记录的经济状况持续改善,COVID - 19 贷款延期,部分被 增长拨备和140万美元的特定准备金所抵消 抵押贷款收益从#年的下降 贷款金额下降18% (千美元) 汇总损益表 4q 2021 3q 2021 4q 2020 净利息收入 16,322 $ 16,257 $ 15,018 $ 贷款损失准备金 (163 非利息收入 17、086 22、122 29、945 非利息支出 23、737 25、481 31、923 877 所得税 2,174 2,863 2,880 7,719 $ 9,438 $ 8997 $ 每股收益 2021财季 2021财年第三财季 2020财年第四财季 每Share 1.29 $ 1.56 $ 1.50 $ 基本收益稀释后每Share 1.24 $ 1.52 $ 1.48 $ 税前收益,按部门划分的拨备前收入: 4Q2021 3Q2021 4Q2020 银行 6,829 $ 8,896 $ 6,294 $ Wealth 286 432 157 抵押贷款 2,556 3,570 6,589 税前、拨备前总收入(1) 9,671 $ 12,898 $ 13,040 $ 71% 3% 26% Pre - tax,税前 - 拨备收入 银行 财富 抵押贷款 银行 部门占税前 - 的71%, 预 - 2021年第四季度拨备收入 |
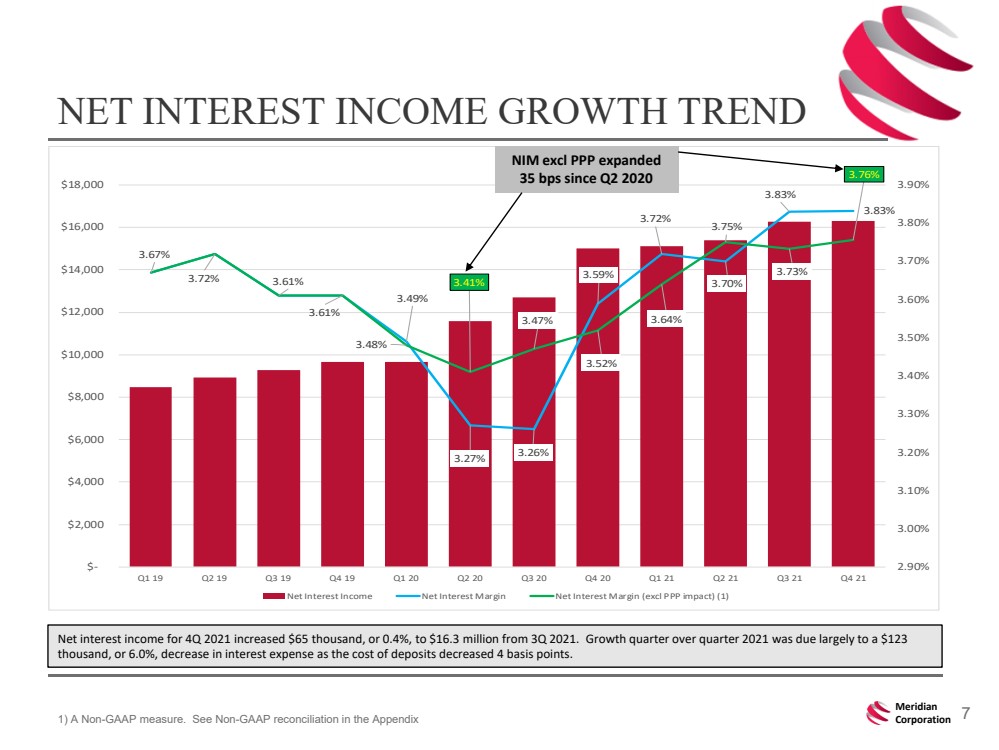
| 7 子午线 公司 净利息收入增长趋势 1)A 非 - GAAP衡量标准。参见附录 中的非 - GAAP对账 2021年第四季度 净利息收入增加 $ 6 5 千,或 0.4%, 至$ 1630 百万 ,自2021年第三季度 起增加 $ 5 千,或 0.4%, 至$ 1630 百万 。 2021年季度环比增长 主要归功于 $123 千美元,或6.0%,利息支出减少,因为存款成本下降了4个基点points. 3.67% 3.72% 3.61% 3.61% 3.49% 3.27% 3.26% 3.59% 3.72% 3.70% 3.83% 3.83% 3.48% 3.41% 3.47%{Br}3.52% 3.64% 3.75% 3.73% 3.76% 2.90% 3.00% 3.10% 3.20% 3.30% 3.40% 3.50% 3.60% 3.70% 3.80% 3.90% $- $2,000 $4,000 $6,000 $8,000 $10,000 $12,000 $14,000 $16,000 Q1 19 Q2 19 Q3 19 Q4 19 Q1 20 Q2 20 Q3 20 Q4 20 Q1 21 Br}自2020年第二季度起,NIM不含PPP扩展 35bps |
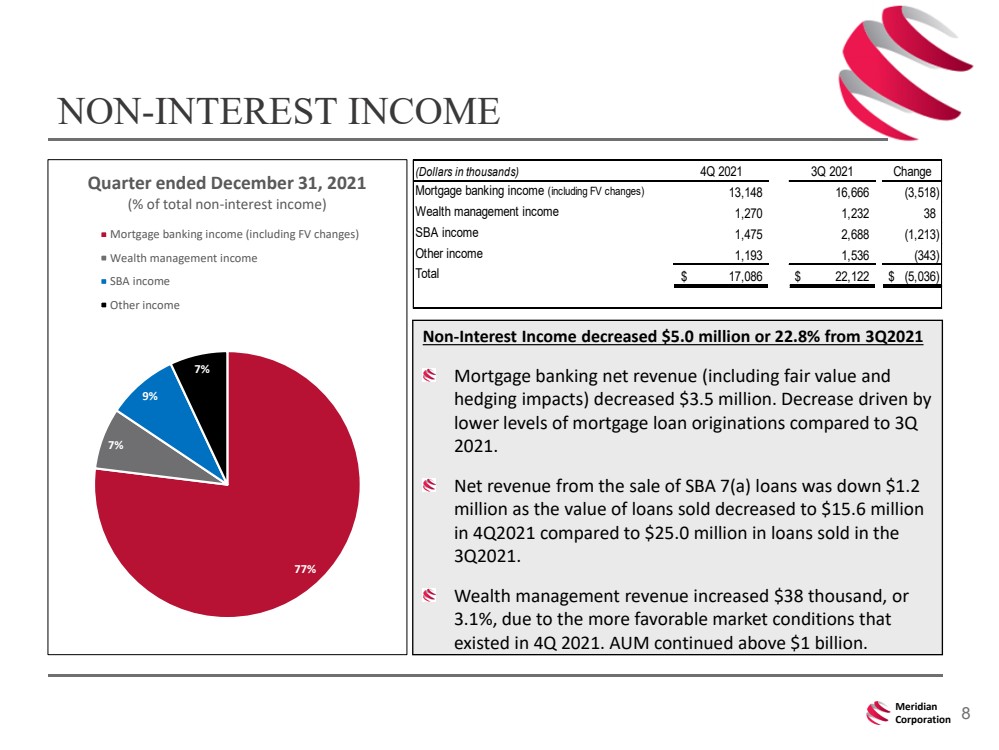
| 8 Meridian Corporation NON - INTEREST收入 非 - 利息收入从 3 2021年第三季度 抵押银行净收入(包括公允价值和 对冲影响)减少500万美元或22.8%。与2021年第三季度相比, 抵押贷款发放量减少了 。 销售SBA7(A)贷款的净收入 下降了120万美元 贷款的价值sold decreased to $15.6 million in 4Q2021 compared降至 2500万美元 2021年第三季度销售的贷款为2500万美元。 财富管理收入增加了 $38 000或者 3.1%, 因为 在 四季度 二零二一年存在更有利的市场条件。AUM继续保持在10亿美元以上。 (千美元) 2021第四季度 第三季度2021 变化 抵押银行收入 (包括FV changes) 13,148 16,666 (3,518) Wealth管理income 1,270 1,232 38 SBA收入 1,475{Br} 2,688 (1,213) Other income 1,193 1,536 (343) Total 17,086 $ 22,122 $ (5,036) $ 77% 7% 9% 7% Quarter截至12月31日,2021年 (占非 - 利息收入总额的%) 抵押银行收入(含FV变动) 财富管理收入 SBA收入 其他收入 |
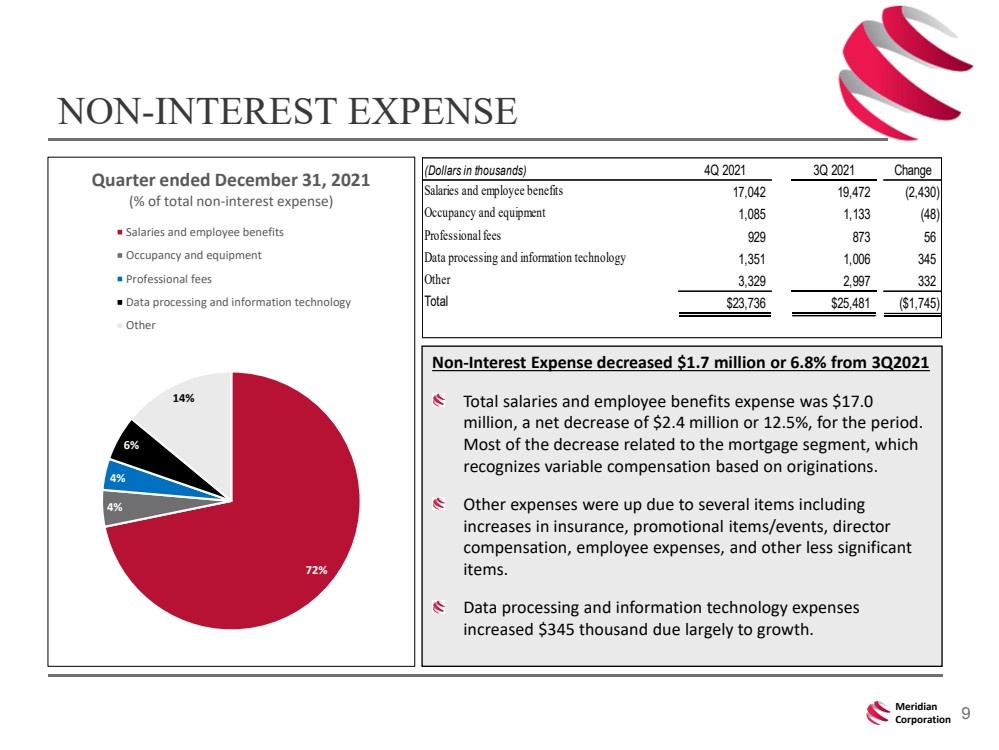
| 9 Meridian Corporation NON - INTEREST费用 非 - 利息费用比2021年第三季度减少170万美元或6.8% 该期间的工资和员工福利总支出为1700万美元 净减少240万美元或12.5%。 减少的大部分与抵押贷款部门有关,该部门 根据来源确认可变薪酬。 其他费用增加,原因包括保险、促销项目/活动、主管 薪酬、员工费用、以及其他不太重要的 项目。 数据处理和信息技术支出 增加了34万5千美元,这主要是由于增长。 (千美元) 2021第四季度 第三季度2021 变化 工资以及员工benefits 17,042 19,472 (2,430) Occupancy和equipment 1,085 1,133 (48) Professional费用 929 873 56 数据处理和信息技术 1,351 1,006 345 Other 3,329 2,997 332 Total $23,736 $25,481 ($1,745) 72% 4% 4% 6% 14% Quarter截至12月31日,2021年 (占总非 - 利息支出的%) 工资和员工福利 占用和设备 专业费 数据处理和信息技术 其他 |
| 10 子午线 公司 资产质量 2021年12月31日 1) 不包括持有的待售贷款,以及2020年第二季度至2021年第四季度的PPP贷款。A 非 - GAAP度量。非 - GAAP对账见附录。 2) 包括持有以供出售和持有以供投资的贷款。 非应计项目贷款 2 (%) 4 q 2021亮点: 强大的储备占总贷款的比例;2021年第四季度 2021年第四季度贷款拨备为负 $22.2万美元 由于经济因素改善 损失 非权责发生贷款占总贷款的比例 2 1.57%在2021年第四季度 COVID修改降至240万美元;一个 关系(1,380万美元)现在归类为非 - 执行 储备/贷款 1 (%) 净费用 - 休假 / 平均Loans 2 (%) 0.39% 0.30% 0.46% 0.49% 0.48% 0.52% 1.34% 2018 2019 2020 1Q21 2Q21 3Q21 4Q21 0.03% (0.06%) 0.00% 0.00% 0.01% 0.00% 0.00% 2018 2019 2020 1Q21 2Q21 3Q21 4Q21 0.97% 1.00% 1.65% 1.65% 1.58% 1.52% 1.46% 2018 2019 2020 1Q21 2Q21 3Q21 4Q21 |

| 11 Meridian Corporation 更新COVID - 19客户支持 Cares Act贷款延期 PPP贷款 1/31/22 注意 1: 广告业内1,380万美元的贷款关系 已到期的Cares Act 延期付款。在第四季度, 贷款被重新分类为非 - 履行贷款 关系,具体准备金为140万美元 。 截至1月31日, 2022 2021年第四季度剩余的240万美元贷款延期已过期 ,没有进一步延期或修改给 借款人。 81%的PPP贷款已延期。 81%的PPP贷款已延期 2022: 2,780万美元(176笔贷款)来自第二轮 , 尚未 偿还 已通过SBA 担保计划提交了1,090万美元的贷款进行偿还。 $63,000 拖欠 (百万美元) PPP贷款 $贷款价值 借款人偿还的贷款 $ $ 3 已偿还的小型企业管理局担保Payments 2.6 $ 5 Total贷款 295.9 $ 1172 尚未申请Requested 31.2 $ 88 Not的Forgiveness 38.7 $ 191 Total贷款为Forgiven 70.0 $ 279 Total购买力平价贷款 365.9 $ 1, 451 (百万美元) 贷款延期(按行业划分) 2021年第四季度 2021第三季度 2020年第四季度 广告 (注1) - $ 13.8 $ - $ Hotels - 7.7 11.8 ${Br} C&I大楼Construction - 1.0 10.1 $ Other 2.4 2.4 2.2 $ Total贷款延期 2.4 $ 24.9 24.2 $ |

| 12 Meridian Corporation CAPITALIZATION截至 12/31/2021年 所有 c 法定资本比率 显著超过资本化监管 要求 银行level - Community Banking Leverage比率 为11.51%,而 最低为8.5% - $5130万超额资本 第四季度2021年季度股息 每股0.2美元;宣布将于2021年1月21日支付每股1.00美元的特别股息 2021年第一季度支付每股1.00美元的特别 股息 2.4万股 通过 公开宣布的计划 在第四季度回购的股份 20,000 40,000 60,000 80,000 100,000 120,000 140,000 161 超出监管最低限额的总RBC 85,388 103,671 125,886 155,506 74,991 56,708 34,493 63,894 Capital($2000) 监管最低限额 监管Excess 9.42% 10.83% 10.83% 14.81% |

| 13 子午线 公司 附录 |

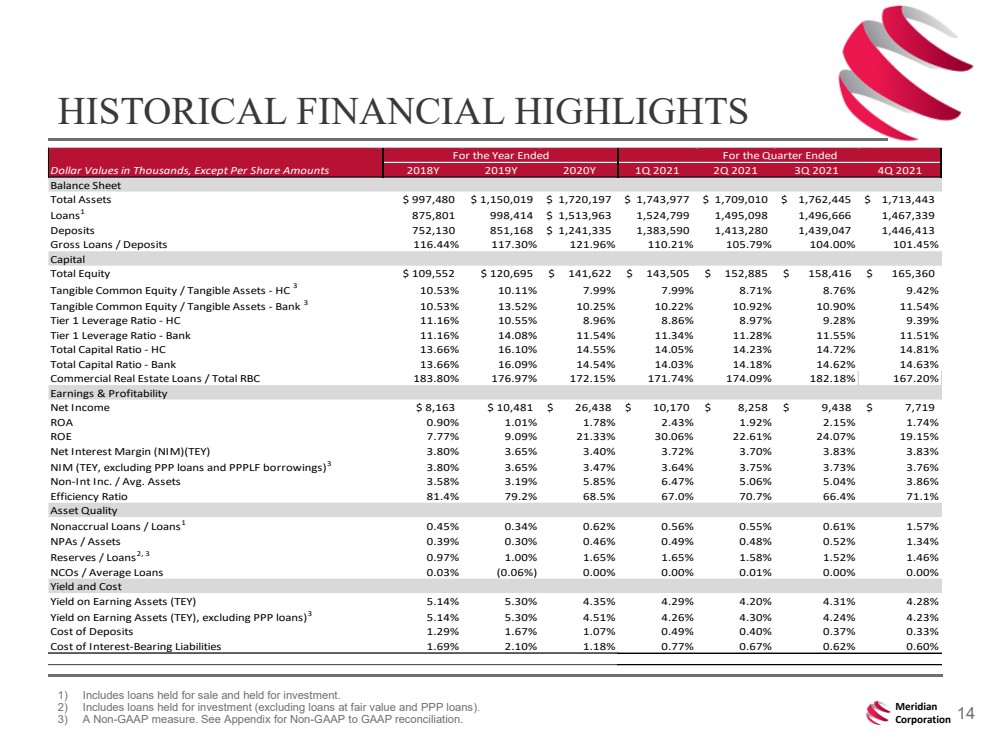
| 14 Meridian Corporation HISTORICAL FINANCIAL HIGHLIGHTS 1) Includes loans held for sale and held for investment . 2) Includes loans held for investment (excluding loans at fair value and PPP loans ). 3) A Non - GAAP measure. See Appendix for Non - GAAP to GAAP reconciliation . Dollar Values in Thousands, Except Per Share Amounts 2018Y 2019Y 2020Y 1Q 2021 2Q 2021 3Q 2021 4Q 2021 Balance Sheet Total Assets $ 997,480 $ 1,150,019 1,720,197 $ 1,743,977 $ 1,709,010 $ 1,762,445 $ 1,713,443 $ Loans 1 875,801 998,414 1,513,963 $ 1,524,799 1,495,098 1,496,666 1,467,339 Deposits 752,130 851,168 1,241,335 $ 1,383,590 1,413,280 1,439,047 1,446,413 Gross Loans / Deposits 116.44% 117.30% 121.96% 110.21% 105.79% 104.00% 101.45% Capital Total Equity $ 109,552 $ 120,695 141,622 $ 143,505 $ 152,885 $ 158,416 $ 165,360 $ Tangible Common Equity / Tangible Assets - HC 3 10.53% 10.11% 7.99% 7.99% 8.71% 8.76% 9.42% Tangible Common Equity / Tangible Assets - Bank 3 10.53% 13.52% 10.25% 10.22% 10.92% 10.90% 11.54% Tier 1 Leverage Ratio - HC 11.16% 10.55% 8.96% 8.86% 8.97% 9.28% 9.39% Tier 1 Leverage Ratio - Bank 11.16% 14.08% 11.54% 11.34% 11.28% 11.55% 11.51% Total Capital Ratio - HC 13.66% 16.10% 14.55% 14.05% 14.23% 14.72% 14.81% Total Capital Ratio - Bank 13.66% 16.09% 14.54% 14.03% 14.18% 14.62% 14.63% Commercial Real Estate Loans / Total RBC 183.80% 176.97% 172.15% 171.74% 174.09% 182.18% 167.20% Earnings & Profitability Net Income $ 8,163 $ 10,481 26,438 $ 10,170 $ 8,258 $ 9,438 $ 7,719 $ ROA 0.90% 1.01% 1.78% 2.43% 1.92% 2.15% 1.74% ROE 7.77% 9.09% 21.33% 30.06% 22.61% 24.07% 19.15% Net Interest Margin (NIM)(TEY) 3.80% 3.65% 3.40% 3.72% 3.70% 3.83% 3.83% NIM (TEY, excluding PPP loans and PPPLF borrowings) 3 3.80% 3.65% 3.47% 3.64% 3.75% 3.73% 3.76% Non-Int Inc. / Avg. Assets 3.58% 3.19% 5.85% 6.47% 5.06% 5.04% 3.86% Efficiency Ratio 81.4% 79.2% 68.5% 67.0% 70.7% 66.4% 71.1% Asset Quality Nonaccrual Loans / Loans 1 0.45% 0.34% 0.62% 0.56% 0.55% 0.61% 1.57% NPAs / Assets 0.39% 0.30% 0.46% 0.49% 0.48% 0.52% 1.34% Reserves / Loans 2, 3 0.97% 1.00% 1.65% 1.65% 1.58% 1.52% 1.46% NCOs / Average Loans 0.03% (0.06%) 0.00% 0.00% 0.01% 0.00% 0.00% Yield and Cost Yield on Earning Assets (TEY) 5.14% 5.30% 4.35% 4.29% 4.20% 4.31% 4.28% Yield on Earning Assets (TEY), excluding PPP loans) 3 5.14% 5.30% 4.51% 4.26% 4.30% 4.24% 4.23% Cost of Deposits 1.29% 1.67% 1.07% 0.49% 0.40% 0.37% 0.33% Cost of Interest-Bearing Liabilities 1.69% 2.10% 1.18% 0.77% 0.67% 0.62% 0.60% For the Quarter Ended For the Year Ended |
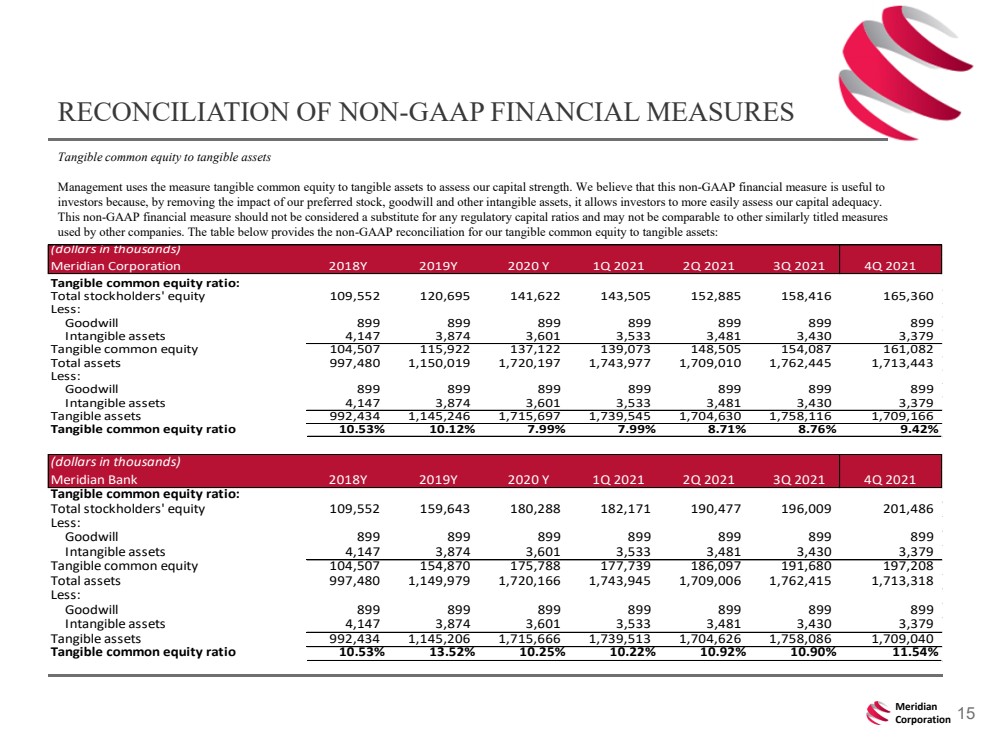
| 15 Meridian Corporation RECONCILIATION OF NON - GAAP FINANCIAL MEASURES Tangible common equity to tangible assets Management uses the measure tangible common equity to tangible assets to assess our capital strength. We believe that this non - GAAP financial measure is useful to investors because, by removing the impact of our preferred stock , goodwill and other intangible assets, it allows investors to more easily assess our capital adequacy. This non - GAAP financial measure should not be considered a substitute for any regulatory capital ratios and may not be comparable to other similarly titled measures used by other companies. The table below provides the non - GAAP reconciliation for our tangible common equity to tangible assets: (dollars in thousands) Meridian Corporation 2018Y 2019Y 2020 Y 1Q 2021 2Q 2021 3Q 2021 4Q 2021 Tangible common equity ratio: Total stockholders' equity 109,552 120,695 141,622 143,505 152,885 158,416 165,360 Less: Goodwill 899 899 899 899 899 899 899 Intangible assets 4,147 3,874 3,601 3,533 3,481 3,430 3,379 Tangible common equity 104,507 115,922 137,122 139,073 148,505 154,087 161,082 Total assets 997,480 1,150,019 1,720,197 1,743,977 1,709,010 1,762,445 1,713,443 Less: Goodwill 899 899 899 899 899 899 899 Intangible assets 4,147 3,874 3,601 3,533 3,481 3,430 3,379 Tangible assets 992,434 1,145,246 1,715,697 1,739,545 1,704,630 1,758,116 1,709,166 Tangible common equity ratio 10.53% 10.12% 7.99% 7.99% 8.71% 8.76% 9.42% (dollars in thousands) Meridian Bank 2018Y 2019Y 2020 Y 1Q 2021 2Q 2021 3Q 2021 4Q 2021 Tangible common equity ratio: Total stockholders' equity 109,552 159,643 180,288 182,171 190,477 196,009 201,486 Less: Goodwill 899 899 899 899 899 899 899 Intangible assets 4,147 3,874 3,601 3,533 3,481 3,430 3,379 Tangible common equity 104,507 154,870 175,788 177,739 186,097 191,680 197,208 Total assets 997,480 1,149,979 1,720,166 1,743,945 1,709,006 1,762,415 1,713,318 Less: Goodwill 899 899 899 899 899 899 899 Intangible assets 4,147 3,874 3,601 3,533 3,481 3,430 3,379 Tangible assets 992,434 1,145,206 1,715,666 1,739,513 1,704,626 1,758,086 1,709,040 Tangible common equity ratio 10.53% 13.52% 10.25% 10.22% 10.92% 10.90% 11.54% |
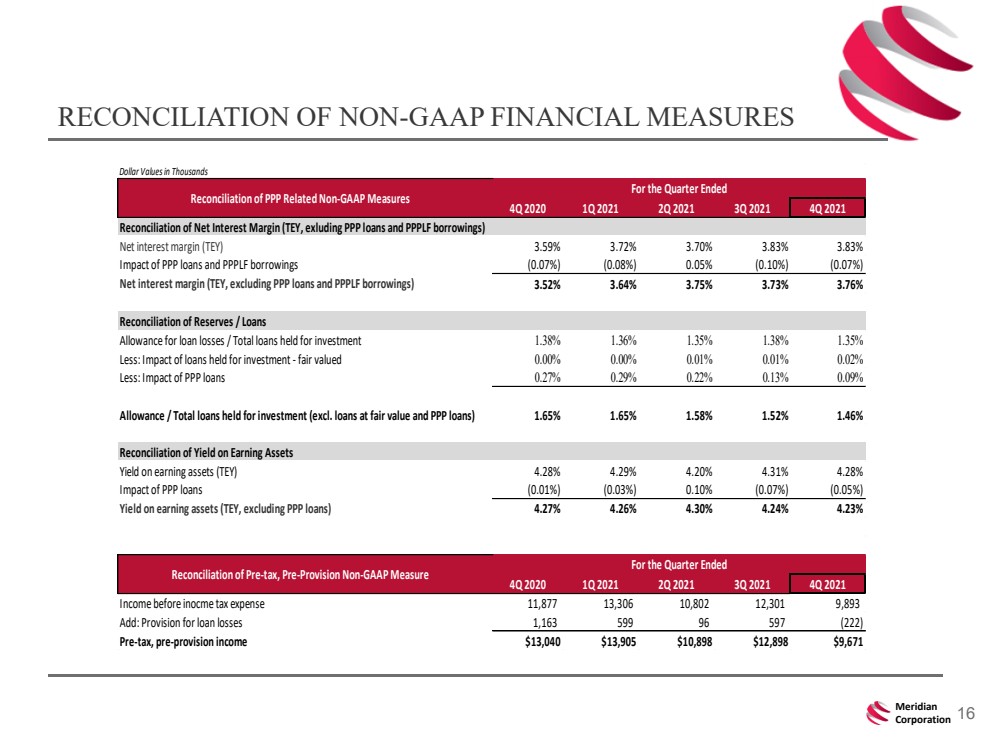
| 16 Meridian Corporation RECONCILIATION OF NON - GAAP FINANCIAL MEASURES Dollar Values in Thousands 4Q 2020 1Q 2021 2Q 2021 3Q 2021 4Q 2021 Reconciliation of Net Interest Margin (TEY, exluding PPP loans and PPPLF borrowings) Net interest margin (TEY) 3.59% 3.72% 3.70% 3.83% 3.83% Impact of PPP loans and PPPLF borrowings (0.07%) (0.08%) 0.05% (0.10%) (0.07%) Net interest margin (TEY, excluding PPP loans and PPPLF borrowings) 3.52% 3.64% 3.75% 3.73% 3.76% Reconciliation of Reserves / Loans Allowance for loan losses / Total loans held for investment 1.38% 1.36% 1.35% 1.38% 1.35% Less: Impact of loans held for investment - fair valued 0.00% 0.00% 0.01% 0.01% 0.02% Less: Impact of PPP loans 0.27% 0.29% 0.22% 0.13% 0.09% Allowance / Total loans held for investment (excl. loans at fair value and PPP loans) 1.65% 1.65% 1.58% 1.52% 1.46% Reconciliation of Yield on Earning Assets Yield on earning assets (TEY) 4.28% 4.29% 4.20% 4.31% 4.28% Impact of PPP loans (0.01%) (0.03%) 0.10% (0.07%) (0.05%) Yield on earning assets (TEY, excluding PPP loans) 4.27% 4.26% 4.30% 4.24% 4.23% 4Q 2020 1Q 2021 2Q 2021 3Q 2021 4Q 2021 Income before inocme tax expense 11,877 13,306 10,802 12,301 9,893 Add: Provision for loan losses 1,163 599 96 597 (222) Pre-tax, pre-provision income $13,040 $13,905 $10,898 $12,898 $9,671 Reconciliation of PPP Related Non-GAAP Measures Reconciliation of Pre-tax, Pre-Provision Non-GAAP Measure For the Quarter Ended For the Quarter Ended |