管理層的
討論
和分析
| A.我們如何報告我們的結果 | J.資本和流動性管理 | ||||||||||
| 1.資本 | |||||||||||
| B.概述 | 2.資本充足率 | ||||||||||
| 1.戰略 | 3.股東分紅 | ||||||||||
| 2.財務目標 | 4.資金的主要來源和用途 | ||||||||||
3.收購和其他 | 5.流動性 | ||||||||||
| C.財務概要 | K.風險管理 | ||||||||||
| 1.風險管理框架 | |||||||||||
| D.盈利能力 | 2.風險治理 | ||||||||||
| 3.風險全域 | |||||||||||
| E.增長 | 4.風險偏好 | ||||||||||
| 1.銷售額、總流量和新業務價值 | 5.風險管理政策 | ||||||||||
| 2.管理資產 | 6.風險管理過程 | ||||||||||
| 7.三道防線 | |||||||||||
| F.合約服務邊際 | 8.風險文化與哲學 | ||||||||||
| 9.風險類別 | |||||||||||
| G.資金實力 | |||||||||||
| L.額外財務披露 | |||||||||||
| H.按業務集團分類的業績 | 1.精選年度信息 | ||||||||||
1.資產管理 | 2.與運營說明書相關的項目 | ||||||||||
2.加拿大 | 3.與財務狀況表相關的項目 | ||||||||||
3.美國 | 4. 2024年第四季度盈利能力 | ||||||||||
4.亞洲 | 5. 2024年第四季度增長 | ||||||||||
| 5.企業 | 6.前幾個季度 | ||||||||||
| I.投資 | M.非國際財務報告準則財務計量 | ||||||||||
| 1.投資形象 | |||||||||||
| 2.債務證券 | N.會計和控制事項 | ||||||||||
| 3.股票 | 1.關鍵會計政策和估計 | ||||||||||
| 4.抵押貸款和貸款 | 2.會計政策變動 | ||||||||||
| 5.衍生物 | 3.披露控制及程序 | ||||||||||
| 6.投資物業 | |||||||||||
| 7.損失備抵和信用損失撥備 | O.法律和監管程序 | ||||||||||
| P.前瞻性聲明 | |||||||||||
管理層的討論與分析永明人壽金融公司,2024年12月31日1
管理層的討論和分析 | ||
2025年2月12日
| 答:我們如何報告結果 | |||||
永明人壽是一家領先的國際金融服務機構,爲個人和機構客戶提供資產管理、財富、保險和健康解決方案。永明人壽的業務遍及全球多個市場,包括加拿大、美國、英國、愛爾蘭、香港、菲律賓、日本、印度尼西亞、印度、中國、澳大利亞、新加坡、越南、馬來西亞和百慕大。截至2024年12月31日,永明人壽管理的總資產(萬億)爲1.54万亿美元。欲了解更多信息,請訪問:Www.sunlife.com.
永明人壽金融公司在多倫多證券交易所(多倫多證券交易所)、紐約證券交易所(NYSE)和菲律賓證券交易所(PSE)交易,股票代碼爲SLF。
永明人壽金融公司(Sun Life Financial Inc.)是一家以加拿大爲註冊地的上市公司,是加拿大永明人壽保險公司(「永明人壽」)的控股公司。在本管理層的討論和分析(「MD&A」)中,SLF公司、其子公司以及在適用的情況下,其合資企業和聯營公司統稱爲「本公司」、「永明人壽」、「我們」、「我們」和「我們」。除非另有說明,否則本MD&A中的所有信息均以截至2024年12月31日的年度爲單位提供,本文檔中包含的信息以加元表示。本文檔中的金額受四捨五入影響。2023年收益和合同服務利潤率(CSM)變動分析中的某些結果已得到改進,以更準確地反映業務的管理方式。
如果沒有截至2024年12月31日及截至2024年12月31日的年度的信息,則使用2024年12月31日之前的最新期間的信息。除非另有說明,財務信息是按照國際財務報告準則(「IFRS」)和金融機構監理處(「OSFI」)的會計要求列報的。報告淨收益(虧損)是指普通股股東根據國際財務報告準則確定的淨收益(虧損)。
我們在五個業務部門管理我們的業務並報告我們的財務結果:資產管理、加拿大、美國(美國)、亞洲和公司。我們的年度和中期合併財務報表及附註(分別爲「年度合併財務報表」和「中期合併財務報表」,以及「合併財務報表」統稱爲「合併財務報表」)以及本MD&A文件中包含有關這些部分的信息。
按業務類型劃分的基本淨收入
永明人壽擁有多元化的業務組合,我們按業務類型劃分的收益支持我們對業績的分析:
•財富和資產管理:永明人壽的財富和資產管理業務產生手續費收入和/或投資產品的利差。
•團體-健康與防護:集團企業爲僱主和政府計劃成員提供健康和保護福利。這些產品的覆蓋期限通常較短,重新定價的頻率也更高。收入來自所提供保險的保費以及基於費用的收益(即,僅限行政服務的計劃和牙醫費用)。
•個人--保護:一般來說,個人保護業務具有較長期的盈利狀況,對體驗趨勢更敏感。保費包括提供保護的按金,並用於投資,以賺取高於履行保險責任所需預期金額的回報。
下面概述了永明人壽業務部門/業務組中的業務類型:

2024年12月2日至31日,永明人壽金融有限公司與管理層的討論和分析將於2024年12月31日在北京舉行。
幫助客戶積累財富並提供終身財務保障。
提供優質的產品和解決方案,滿足客戶的需求。通過始終如一的卓越客戶體驗提供及時和專業的建議。通過以下方式提供穩健的長期客戶投資回報:
利用我們的集體專業知識做出更好的投資決策。
採購廣泛的投資能力,以滿足全球客戶的需求。
實現客戶的投資目標。
通過以下方式推動積極的衛生行動:成爲值得信賴的健康和健康保險範圍廣泛的提供者。幫助客戶訪問、導航並支付他們所需的護理費用。通過提供健康解決方案和增強客戶管理健康的能力,改善健康結果,包括身心健康。.
雖然我們的目標指引着我們,我們的價值觀是關愛、真實、大膽、鼓舞人心和有影響力的,但它指導着我們如何在每一天都表現出來,創造影響。
| 我們的目標是「成爲世界上最好的資產管理和保險公司」。我們對此的定義是:爲股東提供卓越的回報,同時創造卓越的客戶影響力和體驗,將自己定位爲客戶最信任的品牌和首選,同時專注於強有力的執行力,以實現我們的中期財務目標 | |||||
基本每股收益(EPS)增長:8%-10%。
基礎股本回報率(ROE):18%+。
基礎股息支付率:40%-50%。
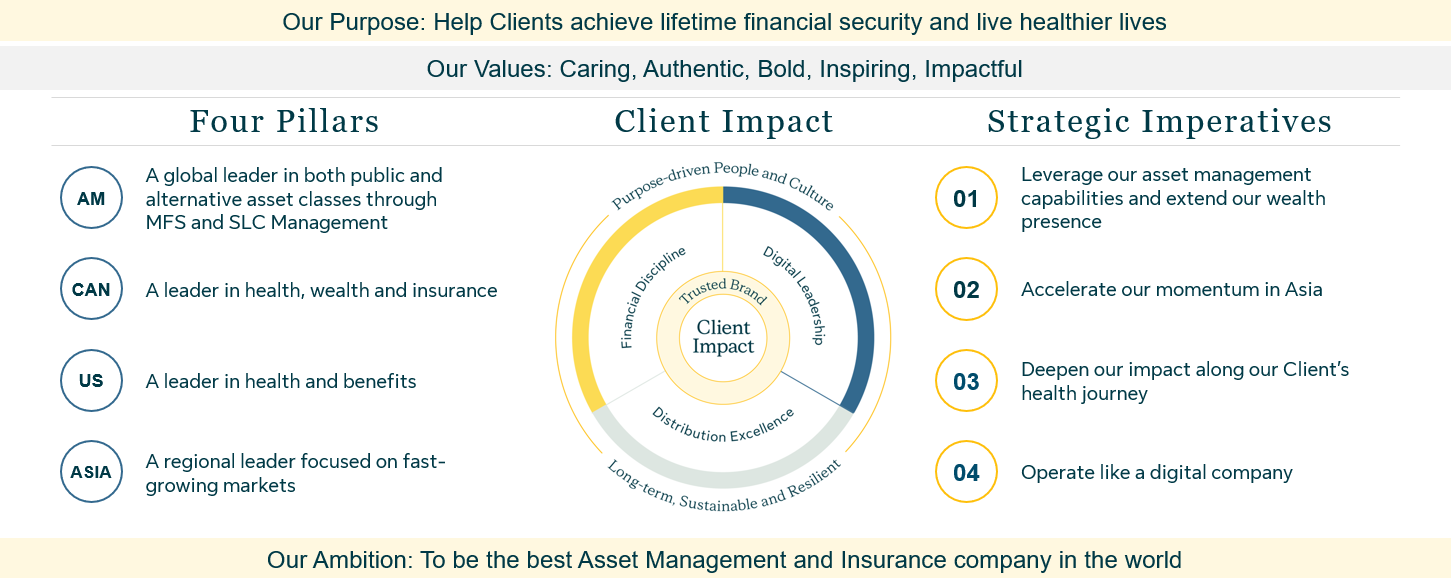
有關我們中期財務目標的更多信息,請參閱本文件中的B節-概述-2-財務目標。基礎每股收益、基礎淨資產收益率和基礎股息支付率均爲非國際財務報告準則財務指標。見本文件M節--非《國際財務報告準則》財務措施。
在2024年11月的投資者日期間,我們宣佈將基本每股收益增長和基本淨資產收益率中期財務目標分別提高到10%和20%。這些更新得到了強勁的業務表現的支持。我們關於基本股息支付率的中期財務目標沒有改變。
2024年12月4日至31日永明人壽金融有限公司與管理層的討論和分析將於2024年12月31日在北京舉行。
我們的四大支柱
•我們的四大支柱定義了我們經營的業務和市場。在這些支柱中,我們專注於通過滿足客戶需求並在有吸引力的全球市場具有強勁增長前景、有利的淨資產收益率和強勁的資本創造的業務來創造價值和積極影響我們的客戶。我們在我們的每一個支柱上都處於有利的地位。
•資產管理:通過MFS和SLC管理在公共和另類資產類別方面處於全球領先地位
•我們通過提供高質量的投資產品提供價值並推動積極的客戶影響:
MFS投資管理公司(「MFS」)是一家長期領先的主動型投資管理公司,爲全球散戶和機構投資者提供全面的資產管理產品和服務。
•SLC Management是一家機構投資管理公司,爲機構投資者提供另類固定收益、私人信貸、基礎設施和全球房地產解決方案。此外,通過收購Advisors Asset Management,Inc.(「AAM」)的多數股權以及與Scotia Global Wealth Management的合作伙伴關係,SLC Management還向北美的零售高淨值(HNW)市場提供解決方案。
•加拿大:健康、財富和保險領域的領先者
•我們通過我們的集團和個人業務爲超過1200萬加拿大人提供價值和影響,具體方式如下:
爲零售客戶提供廣泛的資產管理、財富、健康和保護解決方案。
•幫助加拿大人過上健康的生活,既是作爲集團利益的主要提供者,也是通過日益關注能夠帶來更好健康結果的創新產品和服務。
•在工作場所的團體退休服務方面保持市場領先地位,包括固定繳款養老金和固定福利養老金降低風險。
•美國:健康和福利領域的領先者
我們在醫療保健市場擁有深厚的專業知識,幫助我們的客戶在改善健康結果的同時獲得他們所需的保險。我們是:
美國最大的獨立醫療止損提供商,爲自行投保員工健康計劃的僱主提供大額醫療索賠保護,以及針對複雜條件的計劃和醫療導航服務,以幫助成員改善結果。(1)(2):
•按會員人數計算,美國最大的牙科福利提供商
•。美國牙科業務爲大約3,500名萬成員提供服務
•通過政府計劃和商業集團爲各種規模的僱主提供牙科和視力解決方案。
(1)是美國十大團體人壽和殘障保險提供商之一,提供廣泛的團體保險產品和服務組合,以及爲健康計劃和其他保險公司提供交鑰匙風險管理解決方案。
(2)亞洲:專注於快速增長市場的地區領導者
通過我們在菲律賓、印度尼西亞、越南、香港、中國、印度、馬來西亞以及包括國際和新加坡在內的高淨值人士的不同業務組合,我們在亞洲處於有利地位,可以實現我們的增長目標。這些市場約佔亞洲GDP的67%,未來增長潛力很大
。我們是:
一家個人人壽保險和健康保險的提供商,在我們所有的市場上提供客戶價值。
在特定市場提供資產管理和集團退休產品和服務的提供商。
在爲HNW客戶提供人壽保險解決方案方面處於全球領先地位。
•我們的客戶影響戰略
•我們的客戶影響戰略有七個重點領域,我們正在我們的四大支柱中追求。這些重點領域定義了我們如何在我們的市場上競爭,擴大我們的競爭優勢,實現我們的目標,並支持我們成爲世界上最好的資產管理和保險公司的雄心。我們致力於通過堅持不懈地專注於卓越的執行、數字領導以及培養強大的人才和能夠實現高績效的文化來提升我們的領導地位。
客戶端影響:
我們的客戶是我們所做一切的中心。無論是幫助解決健康問題,爲退休儲蓄和計劃,還是爲他們的家人提供經濟保障,我們的重點都是我們對客戶生活的積極影響。我們相信,這使我們能夠開發和提供正確的解決方案和體驗,建立持久和值得信賴的客戶關係,併爲客戶創造價值,同時也爲永明人壽帶來更好的業務成果。我們致力於通過推動積極的健康和財務行動來幫助客戶,並提供穩健的長期投資回報。
•值得信賴的品牌:
•在一個日益複雜和數字化的世界裏,保持我們作爲一個值得信賴的品牌的長期聲譽是至關重要的。150多年來,我們與永明人壽所有市場的客戶以及我們的經銷夥伴建立了牢固的、值得信賴的關係。我們的品牌反映了我們創造的差異化的永明人壽體驗,我們提供的產品和服務體驗,以及我們賴以實現目標的文化。我們的前瞻性品牌戰略仍然專注於提供對客戶的影響,我們將努力建立我們未來的競爭優勢和品牌吸引力,無論是新客戶還是現有客戶。
•基於截至2024年12月31日的會員資格,適用於由永明人壽公司提供或管理的計劃。排名由永明人壽編制,基於競爭對手披露的數據。
包括也有永明人壽集團保險的成員。
資料來源:國際貨幣基金組織,2024年10月。
•管理層的討論與分析永明人壽金融公司,2024年12月31日5
•卓越的分銷:(1)我們已經建立了全渠道的分銷方式,使客戶更容易在所有市場與我們做生意。爲了在分銷方面脫穎而出,我們將卓越的服務放在首位,在客戶希望參與的時間和方式上與他們聯繫,並提供個性化的整體解決方案。我們致力於通過成爲卓越的分銷合作伙伴來滿足客戶的需求,使我們的顧問和合作夥伴能夠提供無縫的客戶體驗。(2)數字領導力:
•我們專注於使我們的企業能夠與客戶創建有意義的數字連接,以產生最大的客戶和業務影響。通過數字領導戰略,我們像一家專注於以下業務的數字公司一樣運營:
爲客戶、員工、顧問和合作夥伴提供卓越和個性化的數字體驗。
利用數字能力和工作方式,在我們所做的每一件事上提高速度和成本效益。(3)釋放生成性人工智能等新技術的潛力
•,同時繼續投資於現代技術堆棧,以提供最佳的客戶體驗和整體業務生產力。
•財務紀律:
•我們的戰略基於對強勁的財務業績和風險管理的持續承諾,以及對資本管理的關注。對這些領域的持續關注支持了我們的中期財務目標和我們的目標,即股東總回報排在前四位。重點關注的具體領域包括:
提供強勁、穩定的收益增長和紀律嚴明的費用管理。
管理我們的資本,以保護我們的投保人,保持財務靈活性,創造股東價值。
紀律嚴明的有機投資和程序性併購建立規模和能力以推動未來增長的方法。
長期、可持續和有彈性的:我們將長期、可持續和有彈性的思維融入我們的戰略、文化和運營,爲我們的客戶、員工、顧問、投資者和社區帶來有意義的社會和經濟成果。我們渴望成爲一家以客戶爲中心、以目標爲導向、具有競爭力、前瞻性、可持續和具有長期彈性的負責任管理的企業。
(1)目標驅動的人和文化:
(2)我們有能力吸引、留住和發展最優秀的人才,並使我們的員工能夠推動業績,從而支持我們戰略的實施。我們專注於保持和加強我們以客戶爲中心、誠信、合作和包容的強大文化。具體地說,我們的重點是:
(3)成爲頂尖人才的首選僱主。
培養將強大的領導能力與技術悟性相結合的人才,以支持我們向領先的數字組織轉型。
授權所有員工和顧問採取行動、做出決定並承擔責任。繼續建設一個高績效、包容的環境,展示思想的多樣性,吸引頂尖人才。
有目的地設計我們的未來工作,爲員工提供選擇和靈活性,讓他們選擇我們的工作方式和地點。關鍵戰略優先事項
•加上我們四大支柱和主要中期戰略重點領域的堅實基礎,我們的戰略強調了四個關鍵戰略優先事項:
•利用我們的資產管理能力並擴展財富存在
•:我們的目標是通過擴大SLC Management,保持我們在MFS領域的領先地位,加強財富分配,並尋求跨業務線的協同效應,將自己打造爲公共資產和另類資產類別的全球領先者。(1)加快我們在亞洲的發展勢頭
:我們的目標是通過加強分銷渠道,通過數字進步加快我們實現價值的速度,擴大我們的财富管理服務,並強調卓越的執行,成爲快速增長市場的地區領導者。深化我們對客戶健康之旅的影響
•:我們努力成爲值得信賴的健康合作伙伴,通過擴大我們的健康服務,爲客戶配備數字功能以主動管理他們的健康,爲高需求領域的客戶開發簽名解決方案,並在牙科護理產品方面出類拔萃,專注於獲取、負擔得起和賦權。
•像數字公司一樣運營
•:我們致力於成爲數字領導者,方法是整合整個組織的數字能力,嵌入數字思維,使我們的技術基礎設施現代化,利用客戶的洞察力,並在生成性人工智能領域領先。(2)我們相信,我們處於有利地位,能夠執行這些戰略重點中的每一個,通過這樣做,我們將加快增長,改善競爭定位,並創造積極的客戶影響。
展望未來,我們相信,我們的戰略將使我們能夠實現我們的目標,推動積極的客戶成果,爲我們的股東創造有意義的價值,並支持我們成爲世界上最好的資產管理和保險公司的雄心。生成性人工智能是一種可以創建各種類型的內容的人工智能,包括文本、圖像、音頻和合成數據。
合併與收購(「M&A」)2024年12月6日至31日,永明人壽金融股份有限公司與管理層的討論和分析將於2024年12月31日舉行。
•2.財務目標
•在採用國際財務報告準則第17號和第9號之後,我們的中期財務目標的進展情況以三年爲基礎進行衡量。我們的中期財政目標概述如下:
•國際財務報告準則17和國際財務報告準則9
•量測
•中期
財務目標
3年制
1.2024年結果潛在的每股收益增長
2.每股收益的增長反映了公司對爲股東創造可持續收益的關注。基本淨資產收益率
3.淨資產收益率是股東價值的重要驅動力,也是所有業務管理層的主要關注點。18%+
4.基礎股息支付率基於基本淨利潤的資本相對於股東價值的支付。
基礎每股收益、基礎淨資產收益率和基礎股息支付率均爲非國際財務報告準則財務指標。見本文件M節--非《國際財務報告準則》財務措施。基礎股息支付率代表普通股股東的股息與攤薄的基礎每股收益的比率。看見
J節-資本和流動性管理-3-本文件中的股東分紅,以了解有關分紅的進一步信息。
(1)在2024年11月的投資者日期間,我們宣佈將基本每股收益增長和基本淨資產收益率中期財務目標分別提高到10%和20%。這些更新得到了強勁的業務表現的支持。我們關於基本股息支付率的中期財務目標沒有改變。
(2)雖然我們被認爲是合理的,但我們可能無法達到我們的中期財政目標,因爲我們的假設可能被證明是不準確的。因此,我們的實際結果可能與我們如上所述的中期財務目標大不相同。我們的中期財務目標並不構成指導。我們的中期財務目標是前瞻性的、非國際財務報告準則的財務措施,本MD&A在P節--前瞻性報表--中期財務目標中提供了更多信息。
2022年採用《國際財務報告準則》第17號和相關的《國際財務報告準則9》分類覆蓋部分(「新標準」)的結果已被重述。重述的業績可能不能完全代表我們未來的收益狀況,因爲我們沒有在新標準下管理我們的資產和負債組合。爲重新平衡資產組合和將資產負債管理執行過渡到國際財務報告準則第17號基礎而採取的大部分行動發生在23年第一季度。因此,基於2022年比較結果的分析不一定預示未來的趨勢,應結合這一背景進行解釋。
基本每股收益增長是使用兩年複合年增長率計算的。基礎淨資產收益率和股息支付率使用2022-2024年的三年平均值計算。這些計算反映了新標準下可用的數據。隨着我們在未來期間繼續根據新標準進行報告,我們將增加一年,直到我們達到與2022年及之前的披露一致的五年期間。
年內及中期而言,在反映經濟不明朗因素的嚴峻經營環境下,我們的中期財務目標表現穩健。
3.收購和其他 | |||||||||||
自2024年1月1日以來,發生了以下事態發展。關於收購和處置的其他信息在我們2024年年度合併財務報表的附註3中提供。(1) | 2024年3月21日,爲了履行監管義務,我們完成了出售我們在Aditya Birla Sun Life AMC Limited(BSE:ABSLAMC.BO和NSE:ABSLAMC.NS)的6.3%股權的交易,產生了9,800美元萬(稅後8,400美元萬)的報告淨收益。作爲交易的結果,我們在ABSLAMC的所有權權益從36.5%降至30.2%,總收益爲 13600美元的萬。隨後,在2024年5月31日,我們額外出售了0.2%的所有權權益。(2)(3) | 2024年8月22日,我們收購了紅外線資本合夥公司(InnfraRed)剩餘的20%權益。自我們於2020年7月1日首次收購紅外線的多數股權以來,紅外線擴大了SLC Management的另類投資解決方案套件,同時也爲紅外線創造了通過我們的分銷網絡接觸北美投資者的機會,貢獻了超過181亿的資產管理(4)(5) | 代表非《國際財務報告準則》財務衡量標準。有關更多細節,請參閱本文件M節--非國際財務報告準則財務措施。 | ||||||||
管理層討論與分析永明人壽金融公司2024年12月31日7 財富與資產管理 | 8%-10% | 8% | 5% | ||||||||
萬上漲9,700美元:資產管理、加拿大和亞洲的手續費收入增加,但部分被加拿大不利的信貸經歷所抵消。 團體-健康與保護 | 下降11700美元萬:美國醫療止損的不利發病率體驗,美國牙科的較低結果,以及加拿大較差的發病率體驗,部分被美國集團福利和加拿大強勁的業務增長和較高的投資結果所抵消。 | 17.3% | 17.2% | ||||||||
個人--保護 增加13300美元萬:亞洲和加拿大的業務增長,以及加拿大和美國有利的死亡率體驗,部分被23年第二季度出售永明人壽英國導致的收益下降所抵消 | 40%-50% | 48% | 49% | ||||||||
(1)公司費用及其他
1,500美元萬淨虧損減少,這是由於融資成本下降,部分被支出增加所抵消,這主要是由於我們對亞洲業務的持續投資和亞洲的激勵性薪酬。
1,500美元萬淨虧損減少,這是由於融資成本下降,部分被支出增加所抵消,這主要是由於我們對亞洲業務的持續投資和亞洲的激勵性薪酬。
(2)2014年第一季度生效,反映了美國業務組從個人保護到集團健康和保護業務類型的費用分配方法的改進。
(3)2023年4月3日,我們完成了將加拿大SLF英國有限公司出售給菲尼克斯集團控股有限公司的交易(「出售永明人壽英國」)。根據協議,我們將通過一項再保險協議保留我們在支付年金業務中的經濟利益,該協議將於2003年第二季度生效,記錄在美國業務集團的有效管理中。欲了解更多信息,請參閱我們2024年年度合併財務報表的附註3。
(4)管理層討論與分析永明人壽金融公司2024年12月31日
(5)報告的淨收入爲304900美元萬減少了3,700美元萬或1%,原因是:
公司免稅投資收入較低,爲23400美元萬;
與越南銀行保險有關的無形資產減值費用18600万,反映監管和宏觀經濟因素變化導致的最新情況;
2014年第二季度記錄的重組費用爲13800美元萬(稅後10800美元萬),反映了根據我們的客戶影響戰略爲改善財務紀律和生產率而採取的行動,支持了我們潛在每股收益增長的中期財務目標。我們預計,到2026年,這些行動每年將節省約20000美元的萬(稅前);
上一年出售加拿大讚助商市場業務的收益
和永明人壽英國;以及
和永明人壽英國;以及
美國牙科中的非經常性撥備;部分抵消(1).
(1)SLC管理層估計的與收購相關的負債減少
主要反映房地產投資改善的市場相關影響
| 季度業績 | |||||
全年 | |||||||||||
| 美元-平均水平 | 2024 | 2023 | |||||||||
| 美元-期間結束 | |||||||||||
外匯換算在任何特定時期的相對影響是由外匯匯率的變動以及我們在海外業務產生的收益比例驅動的。總體而言,淨收入受益於加元疲軟,但受到加元走強的不利影響,因爲公司國際業務的淨收入換算回加元。相反,在虧損期間,加元的疲軟會增加外國司法管轄區的損失。我們通常表示外匯換算對淨收入的影響是按年計算的。(1) | 3,856 | 3,728 | |||||||||
外匯換算導致基礎淨收入增加3200萬美元,報告淨收入增加4700萬美元。 | 3,049 | 3,086 | |||||||||
| 我們報告的淨收入的有效所得稅稅率是使用所得稅前的總收入(虧損)來計算的,詳見我們的 | |||||||||||
2024年年度合併財務報表。我們的基礎淨收入的實際所得稅稅率是使用稅前基礎淨收入計算的,如本文件M節-非國際財務報告準則財務措施所述,以及相關的所得稅支出。(1) | 6.66 | 6.36 | |||||||||
管理層討論與分析永明人壽金融公司,2024年12月31日11 | 5.26 | 5.26 | |||||||||
| E.增長 | |||||||||||
1.銷售額和毛流量(1) | 17.2% | 17.8% | |||||||||
(百萬美元)(1) | 13.6% | 14.7% | |||||||||
| 財富銷售& | 2024 | 2023 | |||||||||
| 按業務類別劃分的資產管理毛流量 | |||||||||||
資產管理總流量(1) | 196,074 | 173,820 | |||||||||
加拿大財富銷售和資產管理總流量(1) | 2,737 | 2,942 | |||||||||
亞洲財富銷售和資產管理總資金流(1) | 2,983 | 2,491 | |||||||||
總財富銷售和資產管理總流量(1) | 1,542.3 | 1,399.6 | |||||||||
集團-健康與防護產品銷售(1) | 1,473 | 1,253 | |||||||||
| 按業務細分 | 2024 | 2023 | |||||||||
加拿大(2) | |||||||||||
| 美國 | 152% | 149% | |||||||||
亞洲(3) | 146% | 141% | |||||||||
集團銷售總額(1)(4) | 20.1% | 21.5% | |||||||||
| 個人保護銷售 | 40.63 | 36.51 | |||||||||
| 按業務細分 | 579 | 586 | |||||||||
| 加拿大 | 574 | 585 | |||||||||
(1)亞洲
(2)個人銷售總額
(3)CSM-新保險業務的影響(「新業務CSM」)
(4)代表非《國際財務報告準則》財務衡量標準。有關更多細節,請參閱本文件M節--非國際財務報告準則財務措施。
在按業務類別劃分的基本淨收入中,集團在亞洲的業務已計入個人保護。有關永明人壽業務組中的業務類型的更多信息,請參閱本文檔中的A部分-我們如何報告我們的業績。
| 財富銷售和資產管理毛流量總額同比增長223美元億或13%(197亿美元億 | ||||||||||||||
或11%
| ,不包括外匯換算)。 | 2024 | 2023 | ||||||
資產管理總流量增加1.63美元億(1): | ||||||||
| 或11% | 1,823 | 1,726 | ||||||
| 與上一年相比,受MFS和SLC管理層毛流量增加的推動。 | 1,196 | 1,313 | ||||||
| 加拿大財富銷售和資產管理毛流量增加31美元億或21%,這是由於個人財富的共同基金銷售增加以及集團退休服務的固定收益解決方案(「星展」)銷售增加,但個人財富的擔保產品銷售減少部分抵消了這一增長。 | 1,270 | 1,137 | ||||||
| 亞洲財富銷售和資產管理毛流量增加3美元億 | (433) | (448) | ||||||
或4%(1) | 3,856 | 3,728 | ||||||
主要來自互惠基金的印度銷售增加,部分被菲律賓貨幣市場基金銷售減少及香港強制性公積金(「強積金」)銷售減少所抵銷。 | (373) | (454) | ||||||
集團健康和防護產品的總銷售額下降了20500美元(萬),比上年減少了7%(萬爲24700美元 | 56 | 36 | ||||||
或8% | (490) | (224) | ||||||
| ,不包括外匯換算)。 | 3,049 | 3,086 | ||||||
加拿大集團的銷售額增加了7,500美元萬,增幅爲13%,主要受大型箱體銷售增加的推動。(1) | 17.2% | 17.8% | ||||||
美國集團銷售額下降33300美元萬(1) | 13.6% | 14.7% | ||||||
或15%(1): | ||||||||
| 反映了牙科和員工福利銷售額的下降,但部分被較高的醫療止損銷售額所抵消。牙科銷售反映了Medicaid和Medicare Advantage銷售額的下降,這主要是由前一年的大筆機構銷售推動的。 | 43 | 6 | ||||||
| 個人保護的總銷售額增加了49200美元(萬),比上年增加了20%(萬爲47000美元 | 30 | 324 | ||||||
| 或19% | (25) | (24) | ||||||
| ,不包括外匯換算)。 | (70) | (72) | ||||||
加拿大的個人銷售額下降了5,800美元萬或10%,反映了第三方銷售額的下降。(2) | (126) | (34) | ||||||
亞洲個人銷售額增長52800美元萬(3) | 91 | 34 | ||||||
(1)或28%
(2)由於香港銷售增加反映分銷能力擴大,以及印度銷售增加反映銀行保險及直接面向消費者銷售的增長,部分抵銷了中國及越南反映行業及市場情況的銷售下降所帶動的增長。
(3)新業務CSM代表該期間銷售活動帶來的增長。新保險業務的影響推動CSM的萬增加了147300美元,而上一年的萬爲125300美元,這是由於香港更高的個人保障銷售額和強勁的利潤率推動的。
這一變化排除了外匯換算的影響。有關這些非《國際財務報告準則》財務措施的更多信息,請參見
M--本文件中的非國際財務報告準則財務措施。 2024年12月12日至31日,永明人壽金融股份有限公司與管理層的討論和分析將於2024年12月31日舉行。
•獨立基金和第三方資產管理淨流出6,07億美元億包括:(數十億美元)
•隔離基金和第三方AUM的淨流量:(1) MFS
•SLC管理(1)加拿大、亞洲和其他(2).
•隔離基金和第三方AUM的淨流量合計與2023年12月31日相比,第三方資產管理規模增加了1,119美元億或10%,主要原因是:
(1)有利的市場走勢爲949美元億;以及
(2)外匯兌換910美元億;部分抵消
淨流出6,11億美元億;
客戶分發76美元億;以及
•其他業務活動減少54美元億。
•管理層的討論與分析永明人壽金融公司,2024年12月31日13
•F.合同服務邊際
•合同服務按金代表未來保險利潤的儲值來源,並有資格作爲許可用途的可用資本。CSM是保險合同負債的組成部分。下表顯示了CSM的變化,包括確認爲當期淨收入,以及來自新保險銷售活動的增長。(1)截至以下日期的全年
•截至以下日期的全年
•(百萬美元)(2);
•2024年12月31日(3)優先股和其他股權工具
•普通股股東權益(4)合同服務利潤率
•人均合計
財務槓桿率
1.股息
基礎股息支付率(5)每股普通股股息(美元)
2.普通股每股賬面價值(美元)
我們的LICAT比率是根據OSFI授權的指導方針-人壽保險資本充足率測試來計算的。
3.創新資本工具包括永明人壽可交換資本證券(「SLEECS」),見本文件J節-資本及流動性管理。
普通股股東權益等於股東權益總額減去優先股和其他權益工具。(6)財務槓桿率的計算包括分母中的CSM餘額(扣除稅收)。截至2024年12月31日(2023年12月31日96亿),CSM(稅後淨額)爲103美元億。(2)代表非《國際財務報告準則》財務衡量標準。有關更多細節,請參閱本文件M節--非國際財務報告準則財務措施。(4)1.壽險資本充足率測試
金融機構監理處制定了被稱爲加拿大人壽保險資本充足率測試的監管資本框架。LICAT使用基於風險的方法衡量保險公司的資本充足率,包括在保險公司面臨壓力期間有助於增強財務實力的要素,以及有助於投保人和債權人保護清盤的要素。
SLF Inc.是一家非經營性保險公司,受LICAT指導方針的約束。永明人壽,SLF Inc.的S主要經營人壽保險子公司,也受到LICAT指導方針的約束。
•截至2024年12月31日,SLF Inc.的S持股比率爲152%,比2023年12月31日增加了三個百分點,這是受到有機資本產生、扣除股東股息支付、ACMA和市場波動的推動,但部分被股票回購所抵消。
•永明人壽截至2024年12月31日的許可證比率爲146%,比2023年12月31日增加了5個百分點,這是由於有機資本產生的淨額,即向SLF Inc.支付股息、市場走勢和ACMA。
•兩個時期的永明人壽保險許可比率均遠高於OSFI 100%的監管比率和90%的監管最低比率。
•2024年12月16日至31日,永明人壽金融股份有限公司與管理層的討論和分析將於2024年12月31日舉行。
•2.資本
(1)我們的總資本包括次級債務和其他資本工具、CSM、參與帳戶的權益和總股東權益(包括普通股股東權益、優先股和其他權益工具)和非控股權益。截至2024年12月31日,我們的總資本爲459美元億,比2023年12月31日增加了35美元億。資本總額的增加包括報告淨收益304900万,CSM增加158000美元,計入其他全面收益(虧損)(「保監處」)的外匯換算134600美元萬的有利影響,以及發行2024-1系列附屬無擔保5.12%固定/浮動債券本金75000美元,詳情如下。這部分被支付SLF Inc.普通股股息187500万,回購和註銷普通股減少85500美元萬,以及贖回2019-1系列附屬無擔保固定/浮動債券本金75000美元萬所部分抵消,詳情如下。
(2)2024年,有機資本生成
(3)爲210400美元萬,衡量資本變化,扣除股息,高於法定要求,不包括市場和其他非經常性項目的影響。有機資本的產生是由基本淨利潤和新業務CSM的增長推動的。
(4)我們的資本和流動性狀況依然強勁,SLF Inc.的許可比率爲152%,財務槓桿率爲20.1%
(5)以及14億美元的現金和其他流動資產
(6)截至2024年12月31日,SLF Inc.
(2023年12月31日-16億美元)。
5.資本交易
2024年5月15日,SLF Inc.發行了75000美元的萬本金,2024-1系列附屬無擔保5.12%固定/浮動債券,2036年到期。相當於發行此類債券的淨收益的金額將用於爲2024年4月我們的可持續債券框架中定義的新的和/或現有的合格資產進行全部或部分融資或再融資。
2024年8月13日,SLF Inc.根據附在此類債券上的贖回條款,贖回了2019-1系列無擔保固定/浮動債券的全部未償還的75000美元萬本金。贖回資金來自現有的現金和其他流動資產。
正常程序發行人投標(1)2023年8月29日,SLF Inc.開始了正常的發行人投標,有效期至2024年8月28日(簡稱2023年NCIB)。 2024年8月26日,SLF Inc.宣佈,OSFI和多倫多證券交易所(多倫多證券交易所)已批准其先前宣佈的正常進程發行人報價的更新,以購買至多1500万的普通股(「2024年NCIB」)。2024年NCIB從2024年8月29日開始,一直持續到2025年8月28日,或SLF Inc.決定的較早日期,或SLF Inc.根據2024年NCIB完成普通股購買的日期。SLF公司根據2024年NCIB購買的任何普通股將被註銷或用於某些股權結算激勵安排。
6. 在兩次競標中購買並隨後註銷的股份如下:
季度業績
年初至今
骨料
| 購買的普通股 | (百萬) | 量 | ||||||||||||||||||
| Q4'24 | Q3'24 | Q2'24 | Q1'24 | 2024 | 2023 | |||||||||||||||
(百萬美元) | 1.399 | 1.364 | 1.368 | 1.348 | 1.370 | 1.350 | ||||||||||||||
購買的普通股 | 1.438 | 1.352 | 1.368 | 1.354 | 1.438 | 1.325 | ||||||||||||||
(百萬)
量
(1)(百萬美元)
購買的普通股
購買的普通股
(百萬)
| 量 | |||||
(百萬美元)
| 2023年NCIB(2024年8月28日到期) | 2024 | 2023 | ||||||
2024年NCIB 總計(1) | ||||||||
代表發行人迄今爲止正常投標有效期內購買並隨後註銷的普通股餘額。 | 169,867 | 151,068 | ||||||
不包括消費稅對股權淨回購的影響。加拿大政府2023年預算對2024年1月1日或之後發生的股權淨回購徵收2%的新消費稅,這項新立法於2024年6月頒佈。 | 18,144 | 15,039 | ||||||
| 代表非IFRS財務衡量標準。有關更多詳細信息,請參閱本文件M -非IFRS財務指標部分。 | 8,063 | 7,713 | ||||||
SLF Inc. (the最終母公司)及其全資控股公司。(1) | 196,074 | 173,820 | ||||||
管理層的討論與分析 Sun Life Financial Inc. 2024年12月31日 17 財務實力評級(1) | ||||||||
| 獨立評級機構對公司發行的證券進行信用評級,並對永明人壽等金融機構進行財務實力評級。 | 666 | 591 | ||||||
評級機構給予的財務實力評級旨在爲金融機構的信譽和財務實力提供獨立的看法。每家評級機構都爲壽險公司的評估和隨後的評級制定了自己的方法。 | 1,984 | 2,275 | ||||||
評級機構不會對SLF Inc.給予財務實力評級,但信用評級是對SLF Inc.及其子公司發行的證券進行的,在SLF Inc.的S AIF中以安全評級爲標題進行了描述。(2) | 87 | 76 | ||||||
下表彙總了永明人壽截至2025年1月31日和2024年1月31日的財務實力評級。(1) | 2,737 | 2,942 | ||||||
上午最佳 DBRS(1) | ||||||||
| 穆迪 | 551 | 609 | ||||||
| 標準普爾 | 2,432 | 1,882 | ||||||
2025年1月31日(1) | 2,983 | 2,491 | ||||||
A+(1) | 1,473 | 1,253 | ||||||
(1)AA
(2)AA3
AA(1)2024年1月31日(1)A+
•AA(1)AA3(1)AA
•評級機構對永明人壽財務實力評級的最新行動:
•2024年11月26日-穆迪確認財務實力評級,展望爲穩定。(1)2024年8月,桑尼·卡爾西宣佈桑尼·卡爾西爲SLC管理公司的總裁兼首席執行官,2024年6月,克里斯·賴特宣佈克里斯·賴特爲新月會資本集團有限公司(以下簡稱新月會)的總裁。(1)於2024年8月22日收購了紅外線剩餘的20%權益。自我們於2020年7月1日首次收購紅外線的多數股權以來,紅外線擴大了SLC Management的另類投資解決方案套件,同時通過我們的分銷網絡接觸到北美投資者,貢獻了超過181亿美元的億
BentallGreenOak在Pere上排名第四(1)全球最大的私人房地產公司百強排行榜,在過去五年中籌集了190美元的私人房地產資本億。(1)連續第五年被評爲養老金與投資獎之一
•在資金管理公司工作的最佳地點。
•榮獲保險投資者年度最佳保險投資策略獎,以表彰我們的首席投資官Randy Brown和永明人壽投資管理團隊令人難以置信的努力、創新和人才實力。(1)成立了SLC Global Insurance Group,這是一個專注於爲世界領先的保險公司提供定製投資解決方案的複雜需求的團隊。我們深厚的保險傳統與我們多樣化的投資能力相結合,爲客戶創造了高度差異化和量身定製的體驗。(1)推出Scotia私人房地產基金,通過我們與Scotiabank的戰略合作伙伴關係進行分銷。利用BGO深厚的房地產投資能力,這一新產品將爲投資者提供一個機會,通過投資於私人房地產資產來增強和分散他們的投資組合,這些資產提供有吸引力的、以收入爲重點的回報,同時對沖通脹。
AAM宣佈,由新月推出的非交易所交易、終身業務開發公司新月私人信貸收入公司(「CPCI」)將在iCapital Marketplace上提供。通過這次合作,iCapital(1)將使AAM能夠在該平台上訪問其全球財富經理和顧問網絡。(1)SLC固定收益公司今年的融資表現強勁,包括一項約40美元的億戰略多平台授權。
•BGO成功地爲其第四個歐洲增值戰略籌集了20歐元的億,其中基金IV是該系列中迄今募集的最大規模的資金。該基金主要專注於受益於需求結構性增長的行業,如冷藏、城市物流和數據中心。
•代表非《國際財務報告準則》財務衡量標準。有關更多細節,請參閱本文件M節--非國際財務報告準則財務措施。(1)基於ISS市場情報模擬基金。(1)私募股權房地產(「PERE」)。根據2024年Pere 100全球最大私人房地產公司排名。
養老金和投資,全球資金管理的新聞來源。
(1)ICapital爲全球另類投資市場提供動力,提供全套工具、端到端企業解決方案、數據管理和分發功能以及創新的操作系統。
2024年12月20日至31日,永明人壽金融股份有限公司與管理層的討論和分析將於2024年12月31日舉行。
2024年12月20日至31日,永明人壽金融股份有限公司與管理層的討論和分析將於2024年12月31日舉行。
戰略與展望
我們的戰略是通過MFS和SLC Management提供投資產品,爲我們的客戶提供積極資產管理以及固定收益和另類資產類別的長期價值。MFS主要在全球機構、美國零售和精選的非美國零售市場進行競爭。SLC Management主要在全球機構市場競爭,通過附屬公司經理提供廣泛而深入的固定收益和實物資產平台。SLC Management利用永明人壽在私人資產類別投資方面的長期專業知識,再加上SLC Management關聯經理的專業替代能力,向投資者提供定製的投資解決方案。此外,通過收購AAM的多數股權以及與Scotia Global Wealth Management的合作,SLC Management還向北美的零售HNW市場提供解決方案。
MFS:繼續提供卓越的投資業績,同時負責任地爲客戶配置資本
| MFS的積極管理戰略着眼於爲我們的客戶提供長期價值。我們的相對業績爲我們提供了強大的競爭地位: | 2024 | 2023 | ||||||
MFS處於有利地位,可以吸引所有客戶部門的資金流入,這些客戶部門正基於我們紀律嚴明的長期方法,尋求長期風險管理回報。我們正在讓客戶與MFS保持一致,專注於更長的投資視野,利用我們已被證明的能力,在市場週期中提供風險調整後的業績。(1) | ||||||||
| 爲了幫助我們的客戶在適當的風險參數下最大化其投資組合的財務回報,我們採用了一種投資方法,專注於具有持久、長期競爭優勢的發行人。這意味着在我們的基本投資過程中,我們考慮了我們認爲將對發行人的經濟價值產生重大影響的所有因素。這一方法的演變仍然是一個重點領域。 | 221,935 | 204,789 | ||||||
| 我們持續的戰略重點是建立機構固定收益產品和銷售能力,並擴大我們在美國以外的零售計劃,使我們能夠滿足客戶獨特的本地需求。 | 148,786 | 128,452 | ||||||
MFS努力保持活躍基金經理前四分之一的利潤率,同時保持我們爲客戶提供長期價值的承諾。(1) | ||||||||
我們的員工是我們最大的投資,我們相信團隊合作的力量,這使得維持和提升我們的包容性文化成爲首要任務。 | 648,515 | 567,657 | ||||||
SLC Management:通過提供廣泛的另類資產類別和固定收益策略,幫助投資者實現其投資目標 | 568,437 | 537,424 | ||||||
我們處於有利地位,可以利用我們目標市場的主要趨勢:(1) | 1,216,952 | 1,105,081 | ||||||
| 機構投資者鞏固投資經理關係。 | (45,333) | (38,717) | ||||||
改善風險資產的利率環境,各國央行紛紛減息。(1) | 1,542,340 | 1,399,605 | ||||||
(1)房地產估值可能正在觸底,寫字樓行業除外,這應該會刺激越來越多的活動。
隨着從公共市場向私人市場的長期轉變,私人信貸持續增長,以及保險公司需求的增長。
(i)能源和數據中心需求將推動基礎設施房地產需求的長期持續增長。
(ii)零售替代方案是替代方案的下一個大增長領域,預計未來十年AUM將增加兩倍
(iii)我們的戰略是繼續提供卓越的投資業績,擴大和深化我們的分銷關係,建立我們的產品陣容,同時留住我們的頂尖人才。我們爲我們的客戶提供一套極具吸引力的投資能力,以滿足他們的需求,包括:
(iv)領先的公共和私人固定收益能力,涵蓋投資級和替代信貸
(v)股票和債務投資方面的全球房地產專業知識,以及
(vi)全球基礎設施能力。
觀
| MFS | 2024 | 2023 | ||||||
儘管由於數萬億美元的COVID刺激資金的持久影響,全球經濟衰退的可能性似乎很低,但企業仍面臨着收入放緩帶來的更高投入成本壓力。與此同時,估值意味着利潤將繼續增長。這是在市場週期後期觀察到的一種常見模式,當利潤令人失望時,潛在的非常動盪的金融市場可能會出現這種模式。這可能會爲主動型基金經理創造更大的機會,讓他們超越那些尚未出現的基準指數。MFS採用一種涉及長期方法的投資理念,並着眼於整個商業週期。我們的規模、久經考驗的長期業績記錄和廣泛的產品組合,加上我們的投資理念,使我們處於有利地位,能夠在一個市場週期內實現強勁的業績。我們的費用結構利用了基於資產、銷售額或盈利能力的重大可變成本,因此,我們的大部分費用基礎都根據市場動態進行調整。此外,我們將繼續勤奮地使用可自由支配的支出,同時投資於有助於業務長期增長的戰略舉措。 | ||||||||
SLC管理 | (79.4) | (38.9) | ||||||
| 我們預計,到2025年,私人市場活動將繼續反彈。寫字樓以外的房地產估值似乎處於或接近底部,預計房地產活動將會增加。美國央行已經啓動了減息週期,人們的共識是聯儲局將繼續進一步減息,但他們更有可能採取更謹慎的方式。在全球經濟保持相對強勁的情況下,減息通常預計將有利於房地產估值,還應有助於刺激更多的併購活動,從而有利於私人信貸。無論減息的方向如何,我們預計將看到對收益率導向型固定收益和另類資產類別的持續需求,這些類別提供了投資組合多元化、潛在的通脹對沖以及投資總體風險敞口的減少。我們相信,憑藉我們世界級的投資能力平台、推動產品和分銷機會的免費業務以及我們利用全球資源的能力,我們處於有利地位,能夠滿足這一需求。此外,SLC管理層繼續確保我們的投資者和客戶擁有他們需要和需要的信息,以適當評估具有潛在財務影響的廣泛市場趨勢帶來的重大風險和機會。收購AAM的多數股權以及與Scotia Global Wealth Management的合作爲SLC Management提供了進一步的動力,以發展和擴大我們在北美的零售HNW業務。我們爲客戶使用的某些投資功能與我們在管理永明人壽一般帳戶時使用的功能相同;這促進了共同投資機會,從而與客戶的利益保持一致,並使SLC Management能夠快速將產品推向市場。 | 16.6 | 12.5 | ||||||
| 貝恩公司--避免破產:如何駕馭私募市場浪潮(2024年8月出版)。 | 2.1 | (0.5) | ||||||
管理層的討論與分析永明人壽金融公司,2024年12月31日21 | (60.7) | (26.9) | ||||||
業務類型和業務單位
(i)業務類型
(ii)業務單元
(iii)描述
(iv)市場地位
(v)資產管理
MFS
| ·積極管理散戶和機構投資者的資產,包括養老金計劃、主權財富基金、貨幣當局、捐贈基金和基金會。 | |||||
·零售產品通過金融顧問、經紀公司和其他專業人士進行分銷。
| ·機構產品由一支內部銷售隊伍分銷,並得到獨立顧問網絡的協助。 | ·606億美元的AUM | |||||||
| ·美國第九大零售基金管理公司 | SLC管理 | ·SLC Management通過一組附屬經理向客戶提供公共和私人信貸、固定收益、房地產和基礎設施解決方案,包括: | ||||||
| ·全球房地產投資管理公司BentallGreenOak的首席執行官。 | 11,786 | 10,865 | ||||||
·紅外線資本合夥公司,一家總部位於英國倫敦的全球基礎設施和房地產投資管理公司。(1) | 1,473 | 1,253 | ||||||
·新月資本集團,一家總部位於美國的全球另類信貸投資管理公司。(1) | 703 | 560 | ||||||
·SLC Fixed Income,一家北美機構資產管理公司,專門從事投資級公共和私人固定收益投資組合。(1) | (77) | 67 | ||||||
| ·Advisors Asset Management,Inc.,一家面向美國零售業的統包分銷公司。 | (1,135) | (919) | ||||||
·機構產品由一支內部銷售隊伍分銷,並得到獨立顧問網絡的協助。收購AAM的多數股權提供了進入美國零售分銷的渠道,並使SLC Management能夠滿足美國HNW投資者對替代資產日益增長的需求。SLC Management還與加拿大豐業銀行建立了戰略合作伙伴關係,通過Scotia Global Wealth Management向加拿大零售市場分銷替代投資能力。(1)(2) | 964 | 961 | ||||||
·2500億美元的AUM(1) | 124 | (38) | ||||||
據ISS Market Intelligence Simfund基於AUM報告的數據,截至2024年12月31日。(1) | 30 | 364 | ||||||
| 2024年12月22日至31日,永明人壽金融股份有限公司與管理層的討論和分析將於2024年12月31日舉行。 | 462 | (104) | ||||||
財務和業務結果(3) | — | (262) | ||||||
| 資產管理(百萬加元) | 1,580 | 921 | ||||||
基礎淨利潤(4) | 13,366 | 11,786 | ||||||
(1)補充:與市場相關的影響
(2)*管理層對MFS股份的所有權
(3)收購、整合和重組
(4)無形資產攤銷
其他
•報告的淨利潤-普通股股東
•管理資產(十億加元)
•總流量(十億加元)
•淨流量(十億加元)
•MFS
(百萬加元)
基礎淨利潤
添加:
管理層對MFS股份的所有權
報告的淨利潤-普通股股東 | |||||||||||
| 管理資產(十億加元) | 總流量(十億加元)(1)(2) | 淨流量(十億加元)(2)(3) | MFS(百萬美元) | ||||||||
| 基礎淨利潤 | (63) | 206 | 添加: 管理層對MFS股份的所有權 | ||||||||
| 報告的淨利潤-普通股股東 | (79) | (152) | MFS的稅前淨營業利潤率 平均淨資產(十億美元) | ||||||||
| 管理資產(十億美元) | (27) | (26) | 總流量(十億美元) | ||||||||
| 業務單元 | 2 | 62 | 描述 | ||||||||
| 市場地位 | 223 | (60) | 財富與資產管理 | ||||||||
團體退休服務 | 56 | 30 | |||||||||
(1)·在加拿大爲各種規模的僱主提供固定繳費養老金計劃和固定福利解決方案。
(2)·利用我們的工作場所優勢,向那些退出僱主贊助計劃的成員提供自願儲蓄計劃,包括就業後計劃。
(3)·Defined Benefit Solutions爲固定福利養老金計劃提供範圍更廣的創新去風險解決方案。
·銷售代表與養老金顧問和顧問組成的多渠道分銷網絡合作分銷產品。
·爲現任和前任計劃成員提供規劃和資產整合能力,以便從與單一提供商的簡化和無縫體驗中受益。
| ·排名第一 | |||||
| St | 2024 | 2023 | ||||||
在基於22年資本積累計劃總資產的固定繳款市場(1) | ||||||||
nd | 152% | 149% | ||||||
連續一年 | 146% | 141% | ||||||
排名1 | ||||||||
St | 6,179 | 6,178 | ||||||
在固定收益解決方案年金市場(2) | 200 | 200 | ||||||
| 個人財富 | 496 | 457 | ||||||
| ·爲個人提供建議,幫助他們及其家人利用一系列基於財富和保護的財富解決方案,實現終身財務保障。 | 76 | 161 | ||||||
| 所有業務的盈餘收益減少,主要反映已實現收益和淨利息收入減少。 | 2,239 | 2,239 | ||||||
萬公佈的淨收入爲121700美元,萬減少3,500美元,降幅爲3%,反映出ACMA的不利影響和上一年贊助市場業務的銷售收益,但被基本淨收入和市場相關影響的增加部分抵消。與市場相關的影響主要來自房地產體驗的改善和股票市場的影響。(3) | 23,318 | 21,343 | ||||||
增長(4) | 13,366 | 11,786 | ||||||
2024年與2023年l | 45,874 | 42,364 | ||||||
加拿大的銷售額包括:(4)(5) | 20.1% | 21.5% | ||||||
| 財富銷售及資產管理毛流量爲181美元億,增長21%,這是由於個人財富的共同基金銷售增加以及固定收益解決方案銷售增加,但個人財富的擔保產品銷售減少部分抵消了這一增長。 | ||||||||
集團健康與防護產品銷售額爲66600美元的萬增長了13%,這主要得益於大型手提箱銷售額的增長。(5) | 49% | 47% | ||||||
| 個人保護銷售額爲55100美元的萬是 | 3.240 | 3.000 | ||||||
下降10%,反映出第三方銷售額下降。 | 40.63 | 36.51 | ||||||
(1)截至2024年12月31日,包括GRS在內的財富業務的AUM爲1892亿,增加224美元億或13.4%,主要反映市場走勢。
(2)2024年12月28日至31日,永明人壽金融有限公司與管理層的討論和分析將於2024年12月31日在北京舉行。
(3)3.美國
(4)永明人壽美國公司是美國最大的員工和政府福利提供商之一,爲大約5,000名萬美國人提供服務。我們通過僱主、行業合作伙伴和政府計劃(如Medicaid、Medicare Advantage和兒童健康保險計劃(CHIP))提供牙科和視力、醫療止損、補充健康、殘疾和人壽保險福利。服務包括缺勤管理、牙科護理和醫療導航。此外,我們的美國業務管理着大約200,000份個人人壽保險和年金保單以及一批分批再保險。
(5)2024年亮點
我們正在發展我們的業務
太陽人壽美國客戶收入在2024年增長到82美元億,這得益於我們幫助客戶獲得他們需要的醫療保健和保險的戰略的成功執行。
員工福利在2024年實現了創紀錄的基本淨收入,收入同比增長8%,達到24美元億。
達到了成爲美國最大的牙科福利提供商的里程碑。
基於會員資格。美國牙科業務爲大約3,500名萬成員提供服務,其中許多成員位於美國各地服務不足的社區。
最大的醫療補助牙科福利提供商DentaQuest在2024年獲得了9份新的醫療補助合同,其中3份在加州,加州是美國最大的醫療補助市場。
2024年12月32日至31日,永明人壽金融股份有限公司與管理層的討論和分析將於2024年12月31日結束。
財務和業務結果
(百萬美元)
團體-健康與保護(1)個人--保護
基礎淨利潤(1)添加:與市場相關的影響(1)*ACMA(2)收購、整合和重組
*無形資產攤銷
其他
報告淨收益--普通股股東
基本淨資產收益率(%)
報告淨資產收益率(%)
集團福利稅後利潤率(%)
團體健康與防護S
麥酒 | 代表非《國際財務報告準則》財務衡量標準。有關詳細信息,請參閱本文件中的M節--非國際財務報告準則財務措施 | 有關永明人壽業務組中的業務類型的更多信息,請參閱本文檔中的A部分-我們如何報告我們的業績。(1) | ||||||||||||||||||
Q4'24 | 2024 | |||||||||||||||||||
自2013年第二季度起,在出售永明人壽英國業務後,英國支付年金流出業務從公司業務部門轉移到美國業務部門。欲了解更多信息,請參閱我們2024年年度合併財務報表的附註3。此外,從2003年第三季度起,第二輪再保險業務從公司業務部門轉移到美國業務部門。 我們的贊助和慈善活動攜手合作,確保我們影響成千上萬的人,幫助他們實現終身經濟保障,過上更健康的生活。每年,我們的整體慈善活動影響到亞洲90,000多人,包括我們的Hoop+Health計劃,該計劃幫助超過14,000名兒童和社區積極預防糖尿病。 | 我們致力於通過整個地區的金融知識倡議,幫助我們的客戶實現終身金融安全。在越南,我們發起了一系列金融知識教育活動,以提高金融規劃和保險的意識,並賦予個人金融知識,爲我們的客戶培養一個更加樂觀和安全的未來。 風險管理能力和財務實力(2) | 我們致力於爲股東提供價值,包括通過戰略投資建立和實現價值。爲了履行監管義務,我們在3月份出售了我們在Aditya Birla Sun Life AMC Limited(BSE:ABSLAMC.BO和NSE:ABSLAMC.NS)的6.3%股權,通過產生9,800美元的萬(稅後8,400美元萬)收益釋放了我們的投資價值。隨後,在5月份,我們額外出售了0.2%的所有權權益。自2021年首次公開募股以來,永明人壽已創造了超過45000美元的萬收益(稅後收益超過35000美元萬),同時在最近的一次出售後仍保留了上市實體30%的所有權。這突顯了ABSLAMC的價值,反映了其強勁的業績記錄,擁有包括固定收益、股票和替代產品在內的有吸引力的產品組合,以及在印度快速增長的零售業務。 這一變化排除了外匯換算的影響。有關這些非國際財務報告準則財務措施的更多信息,請參閱本文件中的M節--非國際財務報告準則財務措施。 | 值得信賴的品牌獎。 太陽環球露娜。(2) | SunWell高級護理、SunWell最高護理和SunWell基本護理。 根據與保險業監督在《授權保險公司登記冊》中確定的新綜合和長期業務的其他危重疾病保護計劃的比較,截至產品推出時,2024年4月25日。 | 2024年12月34日至31日,永明人壽金融有限公司發佈管理層的討論和分析報告。 戰略與展望(2) | |||||||||||||||
爲了實現我們雄心勃勃的增長目標並推動我們在所有市場的規模,我們將繼續利用新的機會。我們致力於打造卓越的分銷渠道,併爲客戶和顧問提供無縫的數字體驗,以實現客戶影響力。我們將繼續培育濃厚而獨特的文化,同時吸引、發展和賦能高素質人才。我們將在我們的業務中嵌入長期、可持續和有彈性的思維,讓客戶踏上終身財務安全和更健康生活的旅程。我們在亞洲的重點領域是: | — | — | 7.7 | 546 | 10.5 | 733 | ||||||||||||||
提供銀行保險、可持續發展代理、嵌入質量和優化分銷結構 | 3.0 | 249 | 3.8 | 309 | 3.8 | 309 | ||||||||||||||
通過多元化的高績效、注重質量的渠道組合來建立可持續的規模,這些渠道通過我們不斷擴大的生活、財富和健康解決方案提供全面的銷售建議,從而增強客戶的影響力。 | 3.0 | 249 | 11.5 | 855 | ||||||||||||||||
(1)繼續與現有的銀行保險合作伙伴有效合作,以釋放最近交易的潛力,並通過將我們的保險產品嵌入客戶的銀行行程、集成數字工具以及與合作伙伴互動來獲取規模。
(2)擴大代理規模,成爲顧問培養積極和可持續的代理人才的首選合作伙伴。
(1)強化品牌和差異化客戶價值主張,建立和深化高質量的客戶、顧問和員工關係
(2)提供卓越的數字服務,爲我們的客戶和合作夥伴提供簡單、相關和可靠的主張和體驗。
通過進一步投資於高知名度廣告,建立一個獨特的、值得信賴的品牌,從而提高知名度,並進一步在整個亞洲建立對永明人壽的考慮。
提供高質量的建議和相關的金融解決方案,使客戶能夠計劃和保護自己免受不利金融事件的影響,併爲自己的未來進行投資。
·根據總保費排名第一的保險公司
印度尼西亞
·通過代理機構、電信公司安排和銀行提供個人人壽和健康保險,包括與印度尼西亞第二大私營銀行CIMB Niaga的銀行保險合作伙伴關係。
日
| 排名保險公司 | 銀行保險銷售排名第11位 | 越南 | ·通過代理、企業銷售和數字分銷渠道和合作夥伴關係分銷個人保險和養老金,包括與TPBank的獨家銀行保險協議 | |||||||||||
| 和ACB | 日 | 在銀行保險銷售方面,9 | 日 | 排名保險公司 | ||||||||||
| 香港 | ·通過代理機構、與Dah Sing的銀行保險協議提供個人和團體人壽和健康保險 | 和經紀分銷,包括針對HNW客戶的人壽保險解決方案。 | 日 | 排名保險公司和1 | ||||||||||
St
• 經紀人銷售
•·管理着一批即將開始新銷售的國際財富投資產品。
•·國際高淨值人壽保險業務的領先者
•新加坡
·爲亞洲高淨值客戶提供個人人壽保險解決方案。
| ·2021年市場新進入者 | |||||
地區辦事處及其他
| 區域辦事處 | 2024 | 2023 | ||||||
·亞洲總部設在香港。(1) | ||||||||
| 菲律賓:包括與裕成集團-永明人壽Grepa Financial,Inc.的合資企業(49%)。 | 1,293 | 1,239 | ||||||
| 菲律賓投資基金協會,基於2024年10月結束的AUM。 | 1,453 | 1,376 | ||||||
| 美世強積金市場份額報告,2004年第三季度。 | 773 | 890 | ||||||
| 中國:與中國光大集團的合資公司:永明人壽光大人壽保險股份有限公司(24.99%)、永明人壽光大資產管理有限公司(24.74%)。 | 701 | 600 | ||||||
| 2023年,基於保險資產管理公司的總收入。 | (364) | (377) | ||||||
印度:與Aditya Birla Group的合資企業-Aditya Birla Sun Life Life Company Limited(49%)和Aditya Birla Sun Life Asset Management Company Limited(30%間接所有權)。(1) | 3,856 | 3,728 | ||||||
| 印度共同基金協會,基於截至2024年12月31日的季度的平均AUM。 | ||||||||
| 菲律賓保險委員會,基於加拿大永明人壽(菲律賓)今年第三季度至今的總保費收入。 | 1,528 | 1,067 | ||||||
| 印尼人壽保險協會行業報告,基於2004年第三季度至今的第一年保費。 | 1,217 | 1,252 | ||||||
| 天房商業銀行(「TPBank」)和亞洲商業股份制銀行(「ACB」)。 | 556 | 576 | ||||||
| 2024年11月根據行業參與者之間共享的數據計算的年化第一年保費。 | 429 | 511 | ||||||
| 大新銀行(『Dah Sing』) | (681) | (320) | ||||||
| 基本淨資產收益率(%) | 3,049 | 3,086 | ||||||
(1)報告淨資產收益率(%)
財富銷售和資產管理總流量
個人保護銷售
集團-健康與防護產品銷售
新業務CSM | ||||||||
代表非《國際財務報告準則》財務衡量標準。有關更多細節,請參閱本文件M節--非國際財務報告準則財務措施。有關永明人壽業務組中的業務類型的更多信息,請參閱本文檔中的A部分-我們如何報告我們的業績。
•在按業務類別劃分的基本淨收入中,集團在亞洲的業務已計入個人保護。(1)盈利能力 2024年與2023年 •萬的基本淨收入爲70100美元,增加了10100美元萬,增幅爲17%,主要原因是: | ||
財富與資產管理 •上漲3400萬美元:(1)更高的費用收入主要是由更高的AUM推動的。個人--保護增加9,400美元萬:良好的銷售勢頭和有效的業務增長,以及來自合資企業的更高貢獻,但主要反映銷量增長和對業務的持續投資的更高支出部分抵消了這一增長。(2)地區辦事處費用及其他 •淨虧損增加2700萬美元,主要是因爲整個地區對該業務的持續投資和更高的激勵性薪酬。 •報告淨收入42900美元萬減少8200萬美元或16%,這是由於與越南銀行保險有關的無形資產的減值費用反映了監管和宏觀經濟因素的變化、不利的ACMA影響以及第二支柱全球最低稅收調整 | ||
被基本淨收入的增加、部分出售ABSLAMC的收益以及與市場相關的影響部分抵消。與市場相關的影響主要來自房地產體驗的改善,部分被不利的利率影響所抵消。 •馬來西亞 •按當地貨幣計算,個人保險銷售額與上一年持平,因爲代理渠道銷售額的增加被電話銷售和銀行保險渠道銷售額的下降所抵消。(1). •截至2024年底,機構員工人數約爲1300人,比2023年減少了13%。(3)高淨值人士 •國際-(4)個人保護銷售額在當地貨幣基礎上下降了18%,這是由於前一年大型保護盒的銷售額較高。 •新加坡-- •個人保護銷售額在當地貨幣基礎上增長了88%,這是受大型案件銷售額上升的推動。 •2024年12月38日至31日,永明人壽金融股份有限公司與管理層的討論和分析將於2024年12月31日結束。 •5.企業(5)企業支持業務包括一定的費用、投資收益、資本等項目。公司業務涉及核心企業監督活動,如財務、風險和合規,以及企業能力,如戰略、營銷和慈善事業。公司支持包括在「公司費用和其他」業務類型中。 •財務和業務結果 •(百萬美元) | ||
(1)個人--保護
(2)公司費用及其他
(3)基礎淨利潤(損失)
(4)添加:與市場相關的影響
(5)TS
*ACMA
收購、整合和重組
其他
報告淨收益(虧損)-普通股 埃爾斯 •代表非《國際財務報告準則》財務衡量標準。有關更多細節,請參閱本文件M節--非國際財務報告準則財務措施。有關永明人壽業務組中的業務類型的更多信息,請參閱本文檔中的A部分-我們如何報告我們的業績。 •公司中的英國年金流出業務已被納入個人保護。自2013年第二季度起,在出售永明人壽英國業務後,英國年金分項業務從公司業務部門轉移到美國業務部門。欲了解更多信息,請參閱我們2024年年度合併財務報表的附註3。此外,從2003年第三季度起,第二輪再保險業務從公司業務部門轉移到美國業務部門。 •盈利能力 •2024年與2023年 •基本淨虧損爲36400美元萬,而前一年基本淨虧損爲37700美元萬,原因是融資成本下降,部分抵消了出售永明人壽英國導致的收益下降 | ||
以及來自剩餘資產的較低投資收益。 報告的淨虧損爲68100美元萬,而前一年報告的淨虧損爲32000美元萬,反映出免稅投資收入減少,重組費用10800美元萬,以及前一年出售永明人壽英國的收益 •2023年4月3日,我們完成了將加拿大SLF英國有限公司出售給菲尼克斯集團控股有限公司的交易(「出售永明人壽英國」)。根據協議,我們將通過一項再保險協議保留我們在支付年金業務中的經濟利益,該協議將於2003年第二季度生效,記錄在美國業務集團的有效管理中。欲了解更多信息,請參閱我們2024年年度合併財務報表的附註3。 •管理層的討論與分析永明人壽金融公司,2024年12月31日39 •一、投資 •本公司努力確保普通基金投資與業務目標保持一致,包括履行投保人義務和始終保持充足的流動性。我們在投資過程中考慮了廣泛的因素,包括確保有吸引力的風險和回報情況、按資產類別劃分的適當多元化、信貸敞口以及發行人和借款人的行業和財務狀況、相關證券的質量和價值、宏觀和微觀經濟發展和趨勢,包括特定行業的前景。董事會管治委員會(「管治委員會」)批准政策,爲我們的一般基金資產投資訂立審慎的標準和程序。這些政策包括對利率、信貸、股權市場、房地產市場、流動性、集中度、貨幣和衍生品風險的要求、限制和限制。定期監測這些政策的遵守情況,並每年向治理委員會報告。董事會治理委員會監督公司的投資計劃和投資業績,監督與一般基金投資組合管理有關的做法、程序和控制,並審查公司治理指導方針和程序。 •1.投資形象 •截至2024年12月31日,普通基金總投資資產爲1,898美元億,較2023年12月31日增加155億美元。增加的主要原因是一般業務活動和外匯轉換帶來的有利影響。我們的普通基金投資資產在投資類型、地域和行業方面都很多樣化,我們的大部分投資組合都投資於高質量的固定收益資產。(1). 下表列出了我們普通基金投資資產的構成。 •2024年12月31日 •2023年12月31日 •(百萬美元) | ||
賬面值 | ||
總賬面價值的百分比 賬面值 總賬面價值的百分比 現金、現金等價物和短期證券 | ||
(1)債務證券
股本證券
按揭和貸款
| 衍生資產 | 其他投資資產 | 投資物業 | 總投資資產 | ||||||||
| 列報的價值和比率是基於各自資產類別的公允價值。一般而言,投資資產的賬面價值等於其公允價值。對於支持保險合同的投資資產,在發生違約時,如果收回的金額不足以滿足資產擬支持的相關保險合同負債現金流,則信用風險可能大於資產的賬面價值。 | 2.債務證券 | 債務證券投資組合通過定期的購買和銷售計劃進行積極管理,旨在優化收益率、質量和流動性,同時確保其保持良好的多元化和與保險合同負債相匹配的期限。截至2024年12月31日,除加拿大、美國、英國和菲律賓等我們有業務運營的國家外,我們對任何一個國家的債務證券的敞口不超過總投資資產的1%。 2024年12月40日至31日,永明人壽金融股份有限公司與管理層的討論和分析將於2024年12月31日結束。 按發行人和行業劃分的債務證券 | 2024年12月31日 2023年12月31日(1) | ||||||||
| (百萬美元) | 總計 佔總數的百分比 總計 佔總數的百分比 債務證券發行或擔保者: 加拿大聯邦政府 加拿大省市政府 | 美國政府和機構 | |||||||||
(1)其他外國政府
政府發行或擔保債務證券總額
按行業分類的公司債務證券:
| Financials | 2024 | 2023 | ||||||
公用事業(1) | 1,293 | 1,239 | ||||||
| 工業指數 | (20) | (47) | ||||||
能源 | (22) | 12 | ||||||
通信服務(2)(3) | 255 | (114) | ||||||
| 房地產 | (24) | (23) | ||||||
保健 | 46 | — | ||||||
| 消費必需品 | 1,528 | 1,067 | ||||||
非必需消費品(1) | 1,121.3 | 1,015.9 | ||||||
信息技術(1) | 169.9 | 151.1 | ||||||
材料(1) | (62.8) | (26.4) | ||||||
公司債務證券總額 資產支持證券 | ||||||||
債務證券總額(1) | 1,117 | 1,044 | ||||||
我們按行業對債務證券進行分組是基於全球行業分類標準和標準普爾道瓊斯指數。按地區劃分的債務證券 | (22) | 12 | ||||||
| 下表列出了我們按地理位置劃分的債務證券的公允價值。 | 1,095 | 1,056 | ||||||
2024年12月31日(1) | 871.2 | 792.8 | ||||||
2023年12月31日(1) | 136.7 | 126.4 | ||||||
(百萬美元)(1) | (79.4) | (38.9) | ||||||
| FVTPL債務 | ||||||||
證券(1) | 817 | 773 | ||||||
FVOCI債務證券總計 | (17) | 9 | ||||||
| 佔總數的百分比 | 800 | 782 | ||||||
FVTPL債務(1) | 38.7% | 38.4% | ||||||
證券(1) | 621.6 | 572.9 | ||||||
FVOCI債務證券(1)(4) | 605.9 | 598.6 | ||||||
總計(1) | 99.8 | 93.7 | ||||||
總計(1) | (57.8) | (28.8) | ||||||
| 佔總數的百分比 | 65.1 | 79.5 | ||||||
| FVTPL債務 | ||||||||
證券(1) | 176 | 195 | ||||||
| FVOCI債務證券 | (20) | (47) | ||||||
總計(2)(3) | 255 | (114) | ||||||
佔總數的百分比 | (24) | (23) | ||||||
按信用評級劃分的債務證券: | 46 | — | ||||||
AAA級 | 433 | 11 | ||||||
AA(1) | 285 | 290 | ||||||
BBB(1)(5) | 23.0% | 24.2% | ||||||
BB及更低(1)(5) | 21.1% | 21.8% | ||||||
債務證券總額(1) | 250.1 | 223.1 | ||||||
3.股票(1) | 33.2 | 24.6 | ||||||
截至2024年12月31日,股票投資組合多元化,約67%的投資組合投資於交易所交易基金(2023年12月31日-62%)。交易所交易基金持有的資產主要爲ISHARES COR S & P 500 UCITS ETF和Tracker Fund of Hong Kong Ltd。截至2024年12月31日按發行人地區劃分的股票公允價值載於下表。(1) | 16.6 | 12.5 | ||||||
按發行人地理分佈的股票(1) | 192.7 | 176.9 | ||||||
2024年12月31日(1) | 29.4 | 24.6 | ||||||
2023年12月31日(1) | 14.7 | 14.2 | ||||||
(百萬美元)(1) | 15.9 | 49.8 | ||||||
公平變動股價股票(1) | 23.9 | 13.1 | ||||||
FVOCI股票(1) | 22.5 | 22.7 | ||||||
(1)總計
(2)佔總數的百分比
(3)公平變動股價股票
(4)FVOCI股票總計佔總數的百分比
(5)股票證券:
加拿大
美國
歐洲
亞洲
•其他股本證券總額 截至2024年12月31日,不包括交易所交易基金和共同基金,沒有發行人超過股票組合的1%。
•4.抵押貸款和貸款我們的抵押貸款組合幾乎全部由第一抵押貸款組成,我們的貸款組合由私募貸款組成。 (1)按地理劃分的抵押貸款和貸款(2) 按地理位置劃分的抵押貸款和貸款的公允價值如下表所示。
2024年12月31日(3)2023年12月31日
(百萬美元)
抵押貸款
貸款
總計, 抵押貸款
•貸款
•總計
•加拿大
美國,歐洲
•亞洲
其他
抵押貸款和貸款總額, 佔總投資資產的百分比
•抵押貸款的地理位置基於房產的位置,貸款的地理位置基於債權人母公司的國家。
•截至2024年12月31日,扣除損失撥備後,我們的受損抵押貸款和貸款爲3000万美元(2023年12月31日700万美元)。
42 2024年12月31日 Sun Life Financial Inc. 管理層的討論與分析
42 2024年12月31日 Sun Life Financial Inc. 管理層的討論與分析
按揭貸款組合, 截至2024年12月31日,我們持有144亿美元的抵押貸款(2023年12月31日141亿美元)。我們的抵押貸款組合完全由商業抵押貸款組成,如下表所示。
•2024年12月31日
•2023年12月31日
(百萬美元)
已投保
未投保(2).
(1)總計
(2)已投保
(3)未投保
總計
抵押貸款:
零售 | ||||||||
辦公室
多戶住宅工業 •其他(1)抵押貸款總額 •佔總按揭的百分比 •我們的抵押貸款組合完全由商業抵押貸款組成,包括零售、寫字樓、多戶和工業物業。截至2024年12月31日,我們31%的商業抵押貸款組合由多戶住宅抵押貸款組成;沒有單戶住宅抵押貸款。截至2024年12月31日(2023年12月31日-52%),我們的未投保商業投資組合的加權平均貸款與價值比率約爲54%。雖然我們一般在發行時將最高按揭成數限制在75%,但如果按揭由加拿大按揭及房屋公司(「CMHC」)承保,我們可能會在加拿大投資於按揭成數較高的按揭。我們未投保的商業投資組合的估計加權平均償債覆蓋率爲1.77倍。在加拿大商業抵押貸款組合中價值35美元的多戶住宅抵押貸款中,93%由億承保。 •下表按信用質量指標彙總了我們的抵押貸款: | ||
(百萬美元)2024年12月31日 •佔總數的% •抵押貸款 •2023年12月31日 •佔總數的% | ||
抵押貸款按信用評級分類的抵押貸款: •投保 •AAA級 •AA | ||
BBBBB及更低 •受損 •抵押貸款總額 •貸款組合 | ||
截至2024年12月31日,我們持有432亿美元的貸款(2023年12月31日405亿美元)。私募貸款根據貸款類型、行業細分和借款人信用質量提供多元化。私募貸款組合包括向大型和中型市場企業借款人提供的高級有擔保和無擔保貸款、由各種資產擔保的證券化租賃/貸款義務以及電力和基礎設施等行業的項目融資貸款。 •下表中的信用風險評級是根據本MD & A中K-風險管理-9-風險類別-信用風險管理治理和控制標題下描述的內部評級流程確定的。截至2024年12月31日,我們的貸款組合總額中有95%爲投資級(2023年12月31日-95%)。 •(百萬美元) •2024年12月31日 | ||
(1)佔貸款總額的百分比
2023年12月31日
佔貸款總額的百分比
按信用評級分類的貸款:
AAA級
AABBB •BB及更低 •受損 •貸款總額 | ||
管理層的討論與分析 Sun Life Financial Inc. 2024年12月31日 43下表按行業總結了我們的貸款: •(百萬美元) •2024年12月31日佔貸款總額的百分比). •2023年12月31日 •佔貸款總額的百分比 | ||
按行業分類的貸款:企業發放貸款 •加拿大省市政府 •美國政府和機構 •出於會計目的,在合格對沖關係中指定的衍生品包括外匯協議和股權遠期。我們在現金流對沖關係中指定了某些外匯協議,以管理與FVOCI資產相關的外匯波動。此外,我們在現金流對沖關係中指定了某些股權遠期,用於某些基於股票的薪酬計劃下的預期獎勵支付。 | ||
信貸等值金額作爲加拿大保險業的監管機構,OSFI提供了量化衍生品使用的指導方針。信貸等值金額(「CEA」)是用以估計潛在信貸風險的一項量度,其厘定方法爲具有正公允價值的衍生合約的重置成本加上代表未來潛在信貸風險的金額。 •2024年12月31日永明人壽金融公司與管理層的討論和分析將於2024年12月31日在北京舉行。 •風險加權信貸等值金額是用於確定爲某些加拿大監管目的支持衍生品交易所需的資本額的一種衡量標準。它是通過根據衍生品的性質和交易對手的信譽對信用等值金額進行加權確定的。 | ||
2024年12月31日 •2023年12月31日 •(百萬美元) •信用等值金額(「CEA」) | ||
風險 | ||
加權CEA(1)信用等值金額(「CEA」)(2)風險(3)加權CEA | ||
(1)外匯合約
(2)利率合約
(3)股權和其他合同
總計
提出的金額是扣除收到的抵押品後的淨額。
| 按標的金融工具信用評級劃分的信用違約互換 | 辦公室 | 工業 | 零售 | ||||||||
多戶 | 住宅 | 其他 總計 按地理位置劃分的總數百分比 加拿大 美國 | 總計按類型劃分的總數的百分比2023年12月31日(百萬美元)辦公室(1) • 工業零售多戶(2) | ||||||||
| 住宅 | 其他 總計(3)按地理位置劃分的總數百分比 加拿大 | • 2美國總計(2)按類型劃分的總數的百分比7.損失準備和信貸損失準備總損失津貼餘額爲8,800美元萬(2) | |||||||||
| 截至2024年12月31日(2023年12月31日 -8,900美元萬),信貸損失準備金增加400美元萬 | 截至2024年12月31日的年度(截至2023年12月31日的年度增加1,400美元萬)。 | 欲了解更多信息,請參閱我們2024年年度合併財務報表的附註6。 管理層的討論與分析永明人壽金融公司,2024年12月31日45 J.資本和流動性管理 作爲一家保險公司,資本和流動性管理是我們業務的核心。我們確保有足夠的資本來保護我們的投保人、客戶和債權人,同時爲了我們的股東的利益管理資本充足性和我們業務的分配。此外,我們通過確保有足夠的流動資產來支付我們預期的付款義務和資金需求,從而保持了強大的財務靈活性。我們投資於各種類型的資產,以期將它們與不同期限的負債相匹配。 | 隨着各國政府和監管機構努力制定適當的金融監管水平,以確保資本、流動性和風險管理做法足以抵禦嚴重的經濟衰退,我們運營的監管環境預計將發生變化。1.資本我們有一個資本風險政策,旨在保持強大的資本狀況,並提供必要的靈活性,以利用增長機會,支持與我們的業務相關的風險,並優化股東回報。我們的資本風險政策還旨在爲資本充足率風險提供適當的風險管理水平,資本充足率風險的定義是資本不足以或將不足以抵禦不利的經濟狀況、保持財務實力或允許公司及其子公司利用擴張機會的風險。我們的資本基礎的結構是超過最低監管和內部資本目標,並保持良好的信用和財務實力評級,同時保持資本效率結構。資本的管理既是在綜合基礎上根據考慮與業務相關的所有風險的原則進行的,也是在業務集團層面上根據適用於我們經營的司法管轄區的原則進行的。我們海外子公司的資本根據當地法律以與其各自的風險狀況相稱的方式進行管理。(4) | ||||||||
| 永明人壽,包括其所有業務集團,每年都會參與資本規劃過程,向董事會(「董事會」)提交資本配置選項、資本籌集和股息建議。定期進行資本審查,以考慮在各種商業、利率和股票市場情景下的潛在影響。這些資本審查的相關部分,包括股息建議,每季度提交風險委員會。董事會負責批准我們的年度資本計劃和季度股東股息。 | 公司的資本風險政策確立了管理資本管理的政策、操作指南和程序。資本風險政策由風險委員會每年檢討,任何更改均獲董事會批准。我們的公司資本和風險管理職能部門負責資本風險政策的制定和實施。 | 公司的資本基礎主要由普通股股東權益組成。其他資本來源包括優先股和其他股權工具、非控股權益、參與帳戶的股權、CSM、SLF公司和永明人壽發行的次級債券,以及符合監管資本資格的某些其他資本證券。出於加拿大監管的目的,我們的資本還包括永明人壽資本信託發行的創新資本工具。 下表總結了過去兩年我們的資本來源和資本狀況。我們2024年年度合併財務報表的附註12、13、14和20包括有關我們資本的更多細節。(百萬美元). | • 1次級債創新資本工具股權優先股和其他股權工具(2) | ||||||||
(1)普通股股東權益
(2)參與帳戶的權益
(3)非控股權益權益
(4)權益總額
合同服務利潤率
總資本
| 財務槓桿率 | 2024 | 2023 | ||||||
創新資本工具由永明人壽資本信託發行的SLEECS組成,扣除相關交易成本後列報。就加拿大監管而言,SLEECS有資格成爲資本。然而,根據《國際財務報告準則》,它們在我們的綜合財務報表中被報告爲高級債券。(1) | 441 | 432 | ||||||
普通股股東權益等於股東權益總額減去優先股和其他權益工具。(1) | 591 | 550 | ||||||
財務槓桿率的計算包括分母中的CSM餘額(扣除稅收)。截至2024年12月31日(2023年12月31日96亿),CSM(稅後淨額)爲103美元億。(1) | 421 | 394 | ||||||
代表非《國際財務報告準則》財務衡量標準。見本文件M節--非《國際財務報告準則》財務措施。(1) | 1,453 | 1,376 | ||||||
我們的總資本包括次級債務和其他資本工具、CSM、參與的投保人權益、非控股權益和總股東權益,其中包括普通股股東權益、優先股和其他權益工具。 | (177) | (243) | ||||||
| 截至2024年12月31日(2023年12月31日-213億美元),普通股股東權益爲233億美元,2024年增加20億美元,主要原因是普通股股東的淨收入和其他全面收入,部分被股息以及普通股回購和註銷的減少所抵消。 | (34) | 59 | ||||||
| 系列5 | — | 76 | ||||||
| 隨時 | (25) | (16) | ||||||
永久s | 1,217 | 1,252 | ||||||
系列8 R(1) | 22.4% | 21.4% | ||||||
2025年6月30日(1) | 18.8% | 19.4% | ||||||
永久(1) | 18,144 | 15,039 | ||||||
系列9 QR(1) | 666 | 591 | ||||||
浮動(1) | 551 | 609 | ||||||
(1)2025年6月30日
永久
系列10 R
2026年9月30日
•永久系列11 QR 浮動
•2026年9月30日永久
•系列2021-1 - LRCN2026年6月30日 公司有權選擇但無義務以面值贖回證券的最早日期。這些證券的贖回須經監管機構批准。
•我們正密切留意加拿大的監管及市場發展,因爲這涉及參考加元拆息(「CDOR」)的遺留次級債務證券,如有需要,我們或會在日後採取適當行動,以反映取代CDOR的情況。
在最早的贖回日期及之後的每五年,股息率將重置爲等於5年期加拿大政府債券收益率加上爲每個系列指定的利差的年利率。A類股的指定價差爲:系列8R-1.41%和系列10R-2.17%。在最早的贖回日期及之後的每五年,持有人將有權選擇將其股票轉換爲比其現有系列高一個數字的系列。
系列9QR股票的持有者將有權獲得相當於當時3個月期加拿大政府國庫券收益率加1.41%的年利率的季度浮動利率非累積股息。9QR系列股票的持有者將有權根據他們的選擇,在2025年6月30日和此後每五年的6月30日將其9QR系列股票轉換爲8R系列股票。
11QR系列股票的持有者將有權獲得相當於當時3個月期加拿大政府國庫券收益率加2.17%的年利率的季度浮動利率非累積股息。11QR系列股票的持有者將有權在2026年9月30日和此後每五年的9月30日將其11QR系列股票轉換爲10R系列股票。
可於贖回日期及其後每五年按面值全部或部分贖回,或於任何其他日期贖回,每股25.50美元。
•2021-1系列債券的固定息率爲3.60%,每半年派息一次,直至2026年6月30日。2026年6月30日,以及此後每五年至2076年6月30日,2021-1系列債券的利率將重置爲等於招股說明書中定義的五年期加拿大政府收益率加2.604%的利率。在2021-1系列票據到期時未能支付利息或本金的情況下,每個票據持有人的追索權將限於該持有者在有限追索權信託資產中的比例份額。有關LRCN的更多信息,請參見2024年年度合併財務報表附註14.B。
•管理層的討論與分析永明人壽金融公司,2024年12月31日47
•下表顯示了SLF公司過去兩年發行的普通股和股票期權數量。 已發行普通股數量
(in數百萬)
年初餘額
已行使的股票期權
普通股回購和註銷 | ||||||||
年底餘額
未償還股票期權數量 •(in數百萬) •年初餘額 •已發行期權(1)行使、沒收或到期的期權 •年底餘額 | ||
根據我們的加拿大股息再投資和股票購買計劃(「DIP」),加拿大居民的普通股和優先股股東可以選擇將他們的股息自動再投資於SLF Inc.的普通股,也可以通過我們的DIP用現金購買普通股。對於股息再投資,我們可以選擇以成交量加權平均交易價格最高5%的折扣價從財政部發行SLF Inc.的普通股,或直接代表公開市場參與者通過多倫多證券交易所和加拿大另類交易平台(統稱爲「交易所」)按市場價格購買普通股。參與者通過可選現金購買獲得的SLF公司普通股也可以從國庫發行或通過SLF公司的S期權交易所購買,在這兩種情況下都不打折。從2016年3月31日應支付的股息開始,在另行通知之前,根據該計劃購買的普通股是在公開市場購買的。由於普通股是在公開市場購買的,不是從國庫發行的,因此沒有適用的折扣。 •SLF公司向某些員工授予股票期權。這些期權是按SLF Inc.S普通股在授予日在多倫多證交所的收盤價授予的。 •截至2025年1月31日,SLF Inc.擁有572,857,568股普通股,3,049,926股收購SLF Inc.普通股的期權,以及52,200,000股A類流通股。 •2.資本充足率(2)OSFI表示,它將審查LICAT指南的有效性,並對其進行更新,以跟上壽險業的發展以及不斷演變的風險衡量和管理做法。 •SLF Inc. •SLF Inc.是一家非經營性保險公司,截至2024年12月31日受OSFI的LICAT指導方針約束。根據這一指導方針,SLF Inc.以與其風險狀況和控制環境相適應的方式管理資本,SLF Inc.受S監管的子公司遵守其經營所在司法管轄區實施的資本充足率要求。SLF Inc.‘S的綜合資本狀況高於其內部目標。截至2024年12月31日,SLF Inc.的S許可證比率爲152%。有關更多信息,請參閱 •G--本文件中的財務實力。 | ||
永明人壽保險 •永明人壽,SLF Inc.在加拿大的主要經營壽險子公司S,於2024年12月31日須遵守OSFI的LICAT指引。截至2024年12月31日,永明人壽的資本比率爲146%,遠高於OSFI 100%的監管比率和90%的監管最低比率。 •LICAT準則使用基於風險的方法來衡量特定的壽險公司風險,並彙總結果以計算壽險公司支持這些風險所需的監管資本金額。其中某些風險成分,連同可用資本,對本文件K-風險管理一節中概述的股票市場和利率的變化非常敏感。有關更多信息,請參閱本文件中的G節--財務實力。 •2024年12月48日至31日,永明人壽金融有限公司發佈管理層的討論和分析報告。(3)下表顯示了SLF Inc.的S 2024年和2023年利潤率的組成部分。 •SLF Inc.LICAT比率 | ||
(1)(百萬美元)
(2)資本資源
(3)調整後留存收益和繳款盈餘(包括合同服務毛利)
調整後累計其他綜合收益
普通股和優先股
創新資本工具和次級債務(1)更少的人:
商譽
非壽險投資及其他(2).
可用資金
剩餘免稅額及合資格存款
總資本資源 •資本要求 •信用風險、市場風險和保險風險 •減去:多樣化和其他信用 •隔離基金擔保風險 •操作風險 •基本償付能力緩衝 | ||
LICAT比率 •外國人壽保險公司 •SLF Inc.的外國子公司和外國業務必須遵守其運營所在司法管轄區的當地資本或償付能力要求。在2024年至2023年期間,我們的業務將資本水平保持在高於當地最低監管要求的水平。有關我們海外子公司和海外業務的資本和監管要求的更多信息,請參見SLF Inc.的S,AIF的監管事項。 •截至2024年12月31日,我們與特拉華州和密歇根州的關聯再保險公司達成了兩項內部再保險安排,涉及我們在美國發行的具有無失效保證福利的封閉個人萬能人壽保險產品。特拉華州再保險結構成立於2013年,爲2000年1月至2006年2月期間發佈的某些萬能人壽保險的超額美國法定準備金提供資金。超過IFRS對特拉華州再保險公司要求的美國法定準備金要求的融資得到SLF Inc.擔保的支持。密歇根州再保險結構成立於2007年,適用於2006年3月至2008年12月期間發佈的某些保單。該實體於2020年從佛蒙特州重新馴化到密歇根州。根據密歇根州的再保險結構,相關的美國超額法定準備金要求同樣得到SLF Inc.擔保的支持。 | ||
3.股東分紅 •SLF Inc.的宣佈、金額和股息支付須經董事會批准,並取決於我們的運營結果、我們報告的淨收入、財務狀況、現金需求和合同限制。資本管理活動,以及監管考慮因素和宏觀經濟因素,包括我們開展業務的司法管轄區的經濟前景,也與其他因素一起被考慮。董事會按季檢討股息水平。 •定期和適當的股息支付和增長水平爲普通股股東提供了穩定的回報來源。 •我們的目標是基於基礎每股收益,基礎股息支付率在40%至50%之間。 | ||
(1)於2024年期間,我們按基本每股盈利基準向普通股股東派發股息的比率爲49%,按公佈每股盈利計算的派息比率爲62%。
(2)2024年宣佈的普通股股東股息總額爲每股3.24美元,而2023年爲3.00美元。
管理層討論與分析永明人壽金融公司,2024年12月31日49
宣派之股息 | ||
每股金額 普通股 A類優先股 系列3 | ||
系列4
系列5
系列8 R | 系列9 QR | 系列10 R | 系列11 QR | ||||||||
| 在最早的贖回日期及之後的每五年,股息率將重置爲等於5年期加拿大政府債券收益率加上爲每個系列指定的收益率的年利率。A類股的指定收益率爲:系列8R-1.41%,系列10R-2.17%。在最早的贖回日期及之後的每五年,持有人將有權選擇將其股票轉換爲比其現有系列高一個數字的系列。 | 股息率於2020年6月30日重置爲固定年度股息率1.825%,直至2025年6月30日最早贖回日期。 | 9QR系列股票的持有者有權獲得相當於當時3個月期加拿大政府國庫券收益率加1.41%的年利率的季度浮動利率非累積股息。9QR系列股票的持有者將有權根據他們的選擇,在2025年6月30日和此後每五年的6月30日將他們的9QR系列股票轉換爲8R系列股票。 股息率於2021年9月30日重置爲固定年度股息率2.967,直至最早贖回日期2026年9月30日。 11QR系列股票的持有者有權獲得相當於當時3個月期加拿大政府國庫券收益率加2.17%的年利率的季度浮動利率非累積股息。11QR系列股票的持有者將有權在2026年9月30日和此後每五年的9月30日將其11QR系列股票轉換爲10R系列股票。 4.資金的主要來源和用途(1). | 我們的主要資金來源是經營活動提供的現金,包括保費、投資管理費和淨投資收入。這些資金主要用於支付保單福利、向投保人分紅、索賠、佣金、運營費用、利息支出和股東分紅。經營活動產生的超額現金流通常用於投資,以支持未來的付款需求。我們還不時通過借貸和發行證券籌集資金,爲增長、收購或其他需求提供資金。(2) 截至2024年12月31日,我們的淨現金、現金等價物和短期證券總額爲137億美元。除了提供短期資金承諾外,現金、現金等價物和短期證券還包括支持短期付款義務的數額。(3) | ||||||||
淨現金、現金等價物和短期證券增加5億美元。下表概述了我們的主要現金來源和用途。 | •(百萬美元) •期初現金和現金等價物淨額(4). •現金流由(用於): •經營活動 | •投資活動(5) 融資活動(6) 因匯率波動而產生的變化(7) | |||||||||
現金及現金等值物增加(減少) | 現金及現金等價物淨額,期末 | 短期證券,期末 | |||||||||
(1)現金淨額、現金等價物和短期證券,期末
(2)2024年12月50-31日永明人壽金融有限公司與管理層的討論和分析將於2024年12月31日在北京舉行。
(3)5.流動性
(4)我們一般維持整體資產流動資金狀況,超過在規定的不利負債需求情況下爲保險合約負債提供資金的要求。爲了進一步增強我們的流動性,我們積極管理和監測我們的:
(5)資本水平
(6)資產水平
(7)匹配位置
投資多元化與信用質量
現金預測和與既定目標對應的實際金額
| 在我們運營的司法管轄區,我們受到各種法規的約束。S的子公司支付股息和轉移資金的能力在某些司法管轄區受到監管,在某些情況下可能需要獲得當地監管機構的批准並滿足特定條件。通過有效的現金管理和資本規劃,SLF Inc.確保其子公司整體和獨立獲得適當的資金,並保持充足的流動性,以履行個別和整體的債務。 | 2024 | 2023 | ||||||
SLF Inc.(終極母公司)及其全資控股公司擁有14億美元的現金和其他流動資產(1) | 445 | 568 | ||||||
截至2024年12月31日。有關詳細信息,請參閱本文件G節--財務實力和M--非國際財務報告準則財務措施。(1)(2) | 121 | 95 | ||||||
我們爲一般企業目的維持各種信貸安排,詳見下表。除非另有說明,否則所有金額均以加元計算。(1) | 566 | 663 | ||||||
(百萬美元)s | (84) | (25) | ||||||
| 2024年12月31日 | 105 | (48) | ||||||
2023年12月31日(3) | (60) | (87) | ||||||
| 信貸安排 | (64) | (63) | ||||||
| 量 | (52) | — | ||||||
已利用s | 411 | 440 | ||||||
屆滿(1) | 12.0% | 14.2% | ||||||
量(1) | 8.7% | 9.4% | ||||||
已利用(1)(4) | 8.3% | 10.0% | ||||||
屆滿已承諾(1) | 1,434 | 1,680 | ||||||
(1)美國. 美國
(2)美國
(3)美國
(4)已承諾
美國
美國
美國
•美國(1) 已承諾 未提交 美國
•美國(1) n/a 美國(2)美國
n/a
未提交
n/a
n/a
未提交
(1)美國
(2)美國
n/a
美國
美國 | ||||||||
n/a
與我們承諾的信貸安排有關的協議包含投資級公司在償付能力、信用評級和財務實力方面的典型契諾,截至2024年12月31日,所有這些都得到了滿足。這些契約包括但不限於,SLF Inc.維持至少120億美元的總股本,截至每個財季的最後一天進行測試。截至2024年12月31日,SLF Inc.的S總股本爲261億美元。 •我們不遵守承諾信貸安排下的條款,在某些條款的寬限期內,將導致違約事件。這可能需要我們償還任何未償還的借款,或在貸款項下將信用證變現。SLF Inc.(或其任何子公司)未能支付超過2.5億美元的到期債務,也將導致上述承諾信貸安排下的違約事件。(1)根據我們的歷史現金流和流動資金管理流程,我們相信,我們經營活動的現金流將繼續爲我們提供足夠的流動資金,以償還債務和支付到期的其他費用。 •這是一項非國際財務報告準則的財務衡量標準。見本文件M節--非《國際財務報告準則》財務措施。(2)管理層的討論與分析永明人壽金融公司,2024年12月31日51 •K.風險管理(3)1.風險管理框架 | ||
本公司有一個經董事會批准的既定風險管理框架(「風險框架」),該框架列出了我們風險計劃的組成部分,並解釋了它們如何在開展業務活動時共同運作。向客戶提供產品和服務時出現的風險,符合我們幫助客戶實現終身財務安全和更健康生活的宗旨,在這些協議和計劃中進行管理。有效的風險管理對公司的整體盈利能力、有競爭力的市場定位、組織彈性和長期財務生存能力至關重要。雖然不一定能消除或確定所有風險,但風險框架致力於確保適當地管理業務風險,以隨着時間的推移實現公司的業務目標,並且預計不會超過預先設定的承擔風險的界限。風險框架、公司戰略和業務目標都是相互一致的,風險管理協議和計劃嵌入每個業務部門。 •2024年12月52日至31日,永明人壽金融有限公司發佈管理層的討論和分析報告。 •2.風險治理和責任追究 •我們的風險框架規定了承擔風險、治理和控制的責任和權力範圍。下面總結了這些治理要求。 •董事會 | ||
董事會及其委員會負責確保對整個企業的所有風險進行治理,並對確保風險管理框架、政策、計劃和做法到位負有主要責任。通過批准我們的風險框架、風險偏好政策、資本風險政策以及資本和流動性管理框架,並提供對風險管理計劃的持續監督,董事會監督關鍵風險得到適當識別和管理。業務和戰略風險通過業務和戰略計劃的審查和批准進行監督,董事會定期討論與這些計劃的設計或實施相關的關鍵主題、問題和風險。 •風險委員會是董事會的一個常設委員會,其主要職能是協助董事會監督整個企業的當前和新出現的風險,以及風險管理職能,以確保管理層制定了旨在識別和有效管理公司面臨的重大風險的計劃、政策、流程和控制措施,並擁有足夠的資本來支撐這些風險。它審查和批准所有風險管理框架和政策,並審查這些框架和政策的遵守情況。此外,如董事會已將風險監督授權予董事會其他委員會(「董事會委員會」),則風險委員會爲董事會提供對所有董事會委員會的風險管理監督的綜合看法。風險委員會定期監察本公司的風險狀況,以確保其符合議定的風險承受能力及本公司的資本狀況超過監管資本要求,並監察及建議董事會批准分配予業務的具體風險限額及年度資本計劃。風險委員會亦監督本公司管理控制下的附屬公司及合營公司的風險管理活動,以及透過其他合營公司對本公司構成的風險。(4)董事會治理委員會負責協助董事會監督(I)制定有效的公司治理準則和程序,包括針對董事會及其委員會以及董事繼任計劃和招聘的有效性的準則和程序;(Ii)公司的投資計劃和投資業績,包括與普通基金投資組合管理有關的投資做法、程序和控制;(Iii)可持續事務,包括公司的可持續發展政策、可持續發展戰略(包括制定氣候過渡計劃)和可持續發展報告;合規和合規管理方案,包括遵守法律和法規要求,識別和管理合規風險,以及制定政策和程序以維持道德行爲。該委員會還擔任永明人壽的行爲審查委員會和永明人壽某些受聯邦監管的子公司的行爲審查委員會。(5)管理層討論與分析永明人壽金融公司,2024年12月31日53 •我們根據內部評估和監管指導開發和測試一系列場景。新出現的風險是確定壓力測試情景的輸入之一。 •敏感度測試 | ||
定期進行,並在假設任何其他風險因素沒有變化的情況下,衡量潛在風險因素變化對收益、監管資本和流動性的影響。敏感性測試是針對不同壓力水平和不同聚集水平的單個風險和合並風險敞口進行的。 •場景測試 | ||
(1)涉及一些風險因素的變化,以評估這些風險因素的影響和相互作用。這些場景包括集成場景測試、反向場景測試和關鍵假設敏感性測試。
(2)財務狀況測試(「FCT」)
(3),由加拿大精算師學會規定,用於滿足加拿大保險公司法和OSFI法規的要求。通過對選定的不利情景進行壓力測試,FCT的主要目標是確定對我們財務狀況的可能威脅,並採取糾正措施來緩解這些威脅。
(4)風險管理
(5)風險管理決策是通過評估業務活動的評估風險是否與我們的風險偏好一致並滿足風險調整後回報的目標來形成的。
風險監控
監測過程包括董事會的監督,這是通過本文件風險治理和問責部分所述的董事會委員會和高級管理委員會行使的。
管理層的討論與分析永明人壽金融公司,2024年12月31日55
風險報告 •至少每季度,高級管理委員會、董事會委員會和董事會審查報告總結我們對董事會批准的風險偏好的風險狀況,包括我們主要風險的敞口、風險趨勢的任何變化、對風險的前瞻性看法和新出現的風險。這些委員會還審查報告中提出的風險管理戰略的有效性。董事會和董事會委員會定期審查和批准風險管理框架和風險管理政策的任何重大變化,並審查這些框架和政策的遵守情況。 •7.三道防線 •公司的風險治理通過採用三道防線(「LOD」)模式來分配責任和職能責任,以確保適當的監督。這種責任劃分有助於建立一個強有力的控制框架,促進對所有冒險活動的透明和獨立的挑戰,並鼓勵所有職能部門進行自我審查,以促進我們業務中風險管理的持續改進。 | ||
的 •第一個詳細等級 •由業務部門管理層代表,他們擁有業務固有的風險,並負有識別、衡量、管理、監測和報告這些風險的主要責任。與LOD風險相關的首批責任包括: •識別關鍵風險和新出現的風險; •下降1.0%個百分點 | ||
提高1.0%個百分點 •上調2.5%個百分點 •表示截至2024年12月31日和2023年12月31日所有股票敞口的各自變化。由於積極管理、基本風險和其他因素的影響,已實現的敏感性可能與預期大不相同。敏感性包括以2%的間隔(股市10%的變化)和5%的間隔(股市25%的變化)對套期保值計劃進行再平衡的影響。 •市場風險敏感性包括我們截至2024年12月31日和2023年12月31日生效的對沖計劃的估計影響,幷包括在該日期之前實施的新業務和產品變更。 •淨收入、CSM和保監局敏感性以2,500美元萬爲增量進行了四捨五入。敏感性不包括市場對我們在中國和印度的合資企業收入的影響。 | |||||
市場風險保監局的敏感性不包括固定福利義務和計劃資產變化的影響。 | ||
LICAT敏感性說明了截至2024年12月31日和2023年12月31日對SLF Inc.的影響。LICAT比率以0.5%的增量四捨五入。 管理層討論與分析永明人壽金融公司,2024年12月31日61 | ||
利率敏感度
下表列出了截至2024年12月31日和2023年12月31日利率的某些瞬時變化對我們的淨收入、CSM、OCI和SLF Inc.的S利卡特比率的估計即時影響或敏感度。
| (除非另有說明,否則爲百萬美元) | 截至2024年12月31日 截至2023年12月31日 | 利率的變化 | 減息50個點子 | ||||||||
加息50個點子 | 減息50個點子 加息50個點子(1) | 對淨利潤的潛在影響 | LICAT敏感性說明了截至2024年12月31日和2023年12月31日對SLF Inc.的影響。敏感性反映了截至2024年12月31日的最糟糕情景,並假設情景轉換不會在本季度發生。LICAT比率以0.5%的增量四捨五入。(2) | ||||||||
| 2024年12月62日至31日,永明人壽金融有限公司發佈管理層的討論和分析報告。 | (除非另有說明,否則爲百萬美元) | • 3截至2024年12月31日截至2023年12月31日掉期價差的變化減息20個點子(3) | |||||||||
加息20個點子 減息20個點子(4) | 加息20個點子 | • 14對淨利潤的潛在影響(稅後)(5) | |||||||||
掉期利差敏感度假設在整個期限結構中指示的利差也有平行的變化。根據到期日、地理位置、資產類別和衍生工具類型、基礎利率變動和評級的不同期限,已實現利差變化可能會導致已實現的敏感性與上面提供的顯著不同。(6) | 淨收入、客戶滿意度和保險敏感性以2,500美元萬爲增量進行了四捨五入。敏感性不包括市場對我們在中國和印度的合資企業收入的影響。 | • 6房地產敏感度下表列出了截至2024年12月31日和2023年12月31日,我們的淨收入、保監局和CSM對我們房地產投資價值的某些瞬時變化的估計即時影響或敏感度。(7) | |||||||||
| (除非另有說明,否則爲百萬美元) | 截至2024年12月31日 截至2023年12月31日 | 房地產價值的變化 | 在單一生命或聯合先死的基礎上,我們在加拿大的保留限額爲4,000美元萬,在加拿大以外的保留限額爲4,000美元萬。(8) | ||||||||
| 對於生存人壽保險,我們在加拿大的全球保留上限爲5,000美元萬,在加拿大以外的地區爲5,000美元萬。 | 在某些市場和司法管轄區,適用低於最高限額的保留水平。 | • 12大多數業務部門的許多產品都使用再保險,對於已定義的保險組合,再保險是自動進行的,對於具有某些特徵的個人風險,則是在臨時基礎上進行的。管理層討論與分析永明人壽金融公司,2024年12月31日67 長壽風險(9) | |||||||||
| 壽命風險是指死亡率改善率相對於產品定價和估價中使用的假設發生不利變化而產生的潛在損失。隨着社會經濟條件的改善和醫學進步的繼續,這種風險可能會隨着時間的推移慢慢顯現出來。例如,由於顯著延長預期壽命的醫學突破,它也可能更快地顯現出來。 | 長壽風險影響到福利或成本基於生存可能性的合同,因此,保險預期壽命高於預期的改善可能會增加這些福利的最終成本(例如,年金、養老金、純捐贈、一些單獨基金和特定類型的健康合同),從而需要加強投保人的負債,從而導致淨收入和資本的減少。(10)爲了改善對長壽風險的管理,我們監測了可能導致預期死亡率改善的領域的研究。壓力測試技術用於衡量和監測極端死亡率改善對保護和財富產品總投資組合的影響。(10). | • 5產品設計與定價風險產品設計和定價風險是指產品沒有達到預期的性能,導致不利的財務後果的風險。這一風險可能源於已實現的體驗與產品定價中使用的假設的偏差。風險因素包括以下方面的不確定性:未來投資收益率投保人行爲(11) | |||||||||
| 死亡率和發病率經驗 | 銷售水平(12)業務組合 | • 7費用稅 雖然我們的一些產品允許我們在保單或合同有效期內增加保費或調整其他費用和積分,但這些保單或合同的條款可能不允許進行足夠的調整以保持預期的盈利能力。這可能會對我們的盈利能力和資本狀況產生不利影響。提供複雜功能、選項或保證的產品需要越來越複雜的定價模型、方法或假設,這導致了額外的不確定性。(13) | |||||||||
具體的投資多樣化要求已經到位,例如定義了資產類別、地理位置和行業的投資限額。 建立了基於風險的信貸組合、交易對手和行業風險敞口限制。(4) | 已確定對證券投資強制使用信用質量評級,並定期對其進行審查。這些新的固定收益投資的內部評級決定和對現有評級決定的持續審查由公司風險管理獨立裁決。 | • 12·開發和維護可能使用衍生品的對沖計劃。市場狀況決定了衍生產品保護的可得性和成本。進行全面的盡職調查程序和持續的信用分析。(14) | |||||||||
監管償付能力要求包括基於風險的資本要求,並受到定期監測。(6) | 制定了全面的遵守情況監測做法和程序,包括根據預先確定的投資限額進行報告。 | • 7爲我們的各種保險業務承保的某些風險購買再保險。再保險並不免除我們對投保人的直接責任,因此,我們對我們的再保險人承擔信用風險。再保險風險敞口受到監控,以確保沒有一家再保險公司代表不適當的信用風險水平。壓力測試技術,如FCT,被用來衡量大規模和持續的不利信貸發展的影響。(15) | |||||||||
保險合同負債是根據國際財務報告準則確定的。(16) | 內部資本目標是在企業一級建立的,以涵蓋所有風險,並高於最低監管和監督水平。實際資本水平受到監控,以確保它們超過內部目標。我們信用風險管理的核心原則包括資產多元化、基礎研究和現金流分析、主動和持續的風險監控、主動管理和相對價值評估,所有這些原則都旨在優化風險調整後的回報,並適當考慮資本和稅收的影響。我們主要通過使用內部開發的記分卡和評級方法對固定收益投資進行評級,這些方法結合了估計的違約概率和違約造成的損失,以確定預期損失和信用風險評級。這一評級採用與外部評級機構使用的評級標準大體一致的22點評級,並基於對借款人或發行人的信用質量和特定工具的特徵的詳細審查。違約概率評估基於借款人或發行人層面的分析,其中包括對行業風險、業務戰略、競爭力、管理實力和其他財務信息的評估。違約評估的損失是基於工具層面的分析,該分析考慮了擔保、契約、流動性和其他結構性特徵的影響。這些記分卡爲隨機風險值模型提供輸入,並用於對投資組合進行壓力測試,從而洞察我們投資組合中信用風險的分佈和特徵。根據我們的政策,在正常情況下,我們的評級不能高於某些國家認可的統計評級機構(「NRSRO」)提供的最高評級。某些資產,包括我們的主權債務,根據NRSRO提供的評級給予評級,評級的優先順序爲標準普爾、穆迪、惠譽和DBRS Limited。 | • 4有關信用風險的其他信息可在我們2024年年度合併財務報表的附註6中找到。四、業務和戰略風險風險描述業務和戰略風險是指由於無法充分確定、規劃或實施適當的戰略以實現戰略和業務目標或適應客戶行爲、外部業務、經濟、地緣政治、監管或環境和社會格局的變化,或當戰略中的假設未按預期實現而造成損失的風險。(17) | |||||||||
業務和戰略風險管理治理和控制 我們採用了廣泛的業務和戰略風險管理實踐和控制,概述如下: | 制定了業務和戰略風險治理做法,包括獨立監測、審查和向高級管理層、董事會和董事會委員會報告。 業務和戰略風險通過我們的戰略和業務規劃流程進行管理,並對這些計劃的實施進行控制。我們的執行團隊以及董事會和/或董事會委員會會審查這些計劃,並討論關鍵主題、問題和新出現的風險。 | 我們的業務和戰略計劃須經董事會批准,董事會還會定期審查針對關鍵業務計劃目標的實施進度。 | |||||||||
| 全面的政策,包括風險框架、風險偏好政策、產品設計和定價政策、合併和收購政策、變更管理風險-戰略執行政策、資本和流動性管理框架和資本風險政策。 | 我們的公司戰略和業務目標是在風險框架和風險偏好政策規定的範圍內制定的。我們的業務戰略和計劃旨在與我們的風險偏好、我們的資本狀況和我們的財務業績目標保持一致。 | 我們的風險偏好會定期進行評估,同時考慮到我們運營所處的經濟和監管環境。 | |||||||||
| 合併、收購、戰略投資和資產剝離交易受董事會批准的合併和收購風險管理政策管轄,重大交易需經董事會批准。 | 壓力測試技術,如FCT,被用來衡量大規模和持續的不利情景的影響。 | 2024年12月70日至31日,永明人壽金融有限公司發佈管理層的討論和分析報告。 | |||||||||
(1)識別、監控和報告關鍵和新出現的風險,包括可能對我們的財務、運營或聲譽產生重大影響的新出現的監管變化。
(2)內部資本目標是在企業一級建立的,以涵蓋所有風險,並高於最低監管和監督水平。實際資本水平受到監控,以確保它們超過內部目標。在資本違規的情況下,有一個明確界定的升級流程。
(3)我們定期審查和調整我們的業務戰略和計劃,以考慮到我們運營所處的外部商業、經濟、地緣政治和監管環境的變化。我們的業務戰略和計劃旨在與我們的風險偏好、我們的資本狀況和我們的財務業績目標保持一致。我們會定期重新評估我們的風險偏好,同時考慮到我們所處的經濟、監管和競爭環境。
(4)具體的業務和戰略風險將在下面進一步詳細討論。
(5)地緣政治風險
(6)地緣政治風險是與國家之間的衝突或緊張局勢以及具有全球或國際層面的事件或趨勢相關的廣泛風險,這些事件或趨勢增加了公司運營的風險。我們在不同的地區開展業務,我們的業務和金融業務容易受到地區和全球經濟、地緣政治和監管變化的影響。地緣政治風險可能導致全球資本和能源市場的波動性增加,在某些地區開展業務的難度增加,定向網絡攻擊的威脅增加,並有可能帶來聲譽風險。美國和加拿大之間的最新行動,以及一場曠日持久的貿易戰的可能性,以及長時間實施關稅的可能性,可能會對加拿大和美國的經濟造成嚴重破壞,影響市場、GDP增長、匯率、通脹和就業,並對客戶和投資產生相關影響。
(7)經濟風險
(8)我們可能會受到經濟和資本市場狀況的影響,以及由於全球市場日益聯繫在一起而造成的全球經濟衝擊。全球利率、匯率、市場波動、房價、消費者支出、儲蓄和債務、商業投資和通脹等因素的變化,都會影響我們所處的商業和經濟環境。
(9)經濟風險也可能與環境和社會風險等其他風險因素交織在一起。這些因素的影響包括持續低增長的可能性、持續的低利率、通脹上升、利率和股票市場波動加劇,以及相對較低但波動較大的信貸利差繼續存在。任何這些事件對經濟環境的影響都可能與我們的假設和預期不符,這可能會對我們的財務業績和實施我們業務戰略的能力產生不利影響。經濟環境、法律、法規或政策變化或其他政府行動帶來的市場相關影響可能會繼續對我們的收益、監管資本要求、盈利能力、流動性以及我們實施業務戰略和計劃的能力造成壓力。低利率和波動性增加給我們帶來了許多挑戰,包括對沖成本增加、投資收益率下降、投保人的不利行爲以及新業務盈利水平下降。宏觀經濟不確定性和波動性的其他影響可能會導致其他金融和非金融影響,包括商譽減值、我們股價下跌以及對我們的信用和財務實力評級的影響。
(10)執行風險
(11)我們的業務戰略、計劃和財務績效取決於旨在支持我們業務增長的組織和戰略計劃的成功執行。我們有效管理和優先執行這些舉措、識別和快速適應新機遇以及完善戰略以應對不斷變化的經濟、監管和競爭環境的能力直接影響我們執行戰略的能力。確定和實施正確的舉措對於實現我們的業務計劃目標至關重要。
(12)我們業務戰略和計劃的成功執行會影響許多因素,包括:
(13)我們可能無法或無法發現所有重大負債和/或隨後的資產減值,儘管我們已進行了廣泛的盡職調查,以及
(14)賣方向買方提供的慣常賠償可能不能收回或不足以完全抵消因收購業務而產生的損失,以及買方在觸發賠償條款時可能面臨的賣方信用風險。
(15)我們實現任何交易預期的經濟、財務和戰略利益的能力取決於幾個因素,包括:
(16)轉讓業務的有效分離和/或整合,相關業務的重組和/或重組,以及保留關鍵人員以有效執行這些交易,以及
(17)將被收購的業務與我們現有的業務成功整合,並協調組織文化中的任何差異,這可能需要投入大量的管理資源,並分散管理層對我們日常業務的注意力。
爲了降低這些風險,我們制定了管理併購交易的評估、執行和整合的程序。定期向董事會、委員會和高級管理團隊提供與這些交易有關的執行和整合風險的最新情況,以及爲應對此類風險而制定的任何緩解措施。
競爭環境
| 來自保險公司、銀行、資產管理公司、共同基金公司、財務規劃師和其他服務提供商(包括新進入者和非傳統金融服務公司)的競爭非常激烈,可能會對我們在某些國家的業務產生不利影響。 | 2024 | 2023 | ||||||
金融服務業的全球整合趨勢導致競爭對手擁有相當大的市場份額,並建立了分銷關係和品牌。這些較大的公司有能力在基礎活動上投入大量資金,以實現持續的盈利增長和卓越的客戶服務,如品牌資產、產品開發、技術、風險管理和分銷能力。(1) | 89 | 55 | ||||||
我們從事的業務競爭激烈,我們銷售產品的能力取決於許多因素,包括規模、價格和收益率、分銷渠道、數字能力、財務實力評級、產品線範圍以及產品和服務質量、品牌實力、投資業績、歷史股息水平以及向分銷商和客戶提供增值服務的能力。在某些市場上,我們的一些競爭對手可能在這些因素中的一個或多個方面優於我們。我們的競爭對手有很大的潛力通過有針對性的戰略來破壞我們的業務,以減少我們的市場份額,其中可能包括瞄準我們的關鍵人物或銀行保險合作伙伴和其他分銷商,或者積極爲他們的產品定價。我們實現業務計劃和戰略的能力在很大程度上取決於我們預測和快速應對這些競爭壓力的能力。(1)(2) | 681 | 587 | ||||||
科技正在推動金融服務行業的快速變化,並使新進入者能夠與我們的競爭對手競爭或向我們的競爭對手提供服務,以增強他們在保險、財富和資產管理市場某些領域的競爭能力。機器人流程自動化、人工智能、區塊鏈和先進分析等新技術的出現,可能會對金融服務行業以及企業與利益相關者的互動方式產生影響。我們現有的競爭對手或新進入者可能會利用這些或其他新技術在不同領域提供服務,如定製定價、主動接觸客戶和有針對性的營銷,以加強他們的客戶關係和影響客戶行爲。不斷變化的技術和創新帶來的破壞風險可能會影響我們的分銷模式,因爲與保險技術和機器人顧問等金融服務和產品的分銷相關的新的、低成本的基於數字的商業模式出現了。隨着數字用戶數量的增加,這些風險正在迅速演變,很難預測和主動應對,可能會對我們的盈利能力和財務狀況產生不利影響。(1) | (69) | (42) | ||||||
競爭對手可能會提供更多或更低成本的產品選擇,這可能需要我們以更快的速度進行適應,在我們的一些業務中造成利潤率壓力,並影響我們的盈利能力和市場份額。在資產管理領域,投資者傾向於費用較低的被動投資產品,如指數和其他類型的交易所交易基金(ETF),這可能會影響我們在主動管理的產品中吸引和留住客戶的能力。在許多產品細分領域,產品開發和產品生命週期縮短,導致產品功能方面的競爭更加激烈。這增加了產品開發和管理成本,縮短了收回資本支出的時間框架。監管和合規成本通常也會隨着我們產品組合的範圍和複雜性的增加而上升。(1) | 701 | 600 | ||||||
2024年12月31日永明人壽金融股份有限公司與管理層的討論和分析將於2024年12月31日在北京舉行。我們的許多保險產品,特別是集團部門提供的產品,每年都會續簽。鑑於續訂活動的頻率相對較高,這項業務可能特別容易受到競爭市場壓力的不利持續性的影響。 | (76) | (153) | ||||||
由於報告收益的差異以及這些報告和監管資本要求,多個司法管轄區不同的報告和監管資本要求的會計基礎可能會導致我們與一些競爭對手相比處於劣勢。 | (54) | 39 | ||||||
投資業績 | 66 | (18) | ||||||
投資業績風險是指我們未能實現投資組合的預期回報目標,或我們的資產管理業務未能設計或執行投資策略,以實現這些業務提供的產品和管理帳戶的競爭回報的可能性。未能實現投資目標可能會對我們的收入和盈利能力產生不利影響,因爲增長前景放緩,並對投保人或客戶行爲產生不利影響。 | (194) | (8) | ||||||
對於我們的保險業務來說,我們投資組合的表現在一定程度上取決於利率、利差、信貸經驗、股票價格、房地產價值、整體經濟表現、這些投資組合中特定債務人的表現以及其他我們無法控制的因素的水平和變化。這些變化在任何時期都會對我們的淨投資收益產生重大影響。 | (14) | 51 | ||||||
在我們的資產管理業務中,投資組合管理風險是指投資策略沒有以審慎的方式執行,導致委託顯著無法實現其投資目標,實質上達不到其目標收益和相關的基準收益率。不正確地執行投資策略可能會導致潛在的法律或監管擔憂以及聲譽損害,我們可能會失去現有的和潛在的客戶。 | 429 | 511 | ||||||
如果我們的客戶、股東團體或其他主要利益相關者認爲我們的環境和社會實踐不足,我們的業務可能會受到負面影響。不遵守現有或潛在客戶的政策(或不滿足他們的最低要求)可能會取消我們競標、賺取或保留業務的機會。如果某些指數發現我們的做法達不到它們的標準,而我們被剔除爲指數成分股,那麼我們進入資本市場的機會可能也會減少。(1) | 12.7% | 11.0% | ||||||
五、操作風險(1) | 7.8% | 9.4% | ||||||
風險描述(1) | 8,063 | 7,713 | ||||||
運營風險是由於內部流程、人員和系統不充分或失敗或外部事件造成的(財務和非財務)損失的風險。操作風險存在於我們所有的業務活動中,包括如下所述的廣泛風險。操作風險嵌入到用於管理其他風險的實踐中,因此,如果不能有效地管理,操作風險可能會影響我們管理其他關鍵風險的能力。(1) | 2,432 | 1,882 | ||||||
2024年12月31日永明人壽金融股份有限公司與管理層的討論和分析將於2024年12月31日舉行。(1)(2) | 87 | 76 | ||||||
操作風險管理、治理和控制(1) | 918 | 681 | ||||||
(1)我們採用了廣泛的操作風險管理做法和控制措施,概述如下:
(2)業務風險治理做法已經到位,包括獨立監測和審查,並向高級管理層和董事會委員會報告。
已經在操作風險中設定了風險偏好限制。
制定了全面的操作風險管理框架、政策、指導方針和做法。
我們的治理實踐、公司價值觀、行爲準則和全公司範圍的風險管理方法爲降低運營風險奠定了基礎。
•我們的行爲準則爲強大的道德文化奠定了基調,我們定期審查和更新行爲準則,以確保其繼續滿足監管機構和其他利益相關者的期望。我們的所有董事和員工必須每年重申他們對行爲準則的理解和遵守行爲準則的承諾。我們已經爲人才獲取、獎勵和發展計劃建立了適當的內部控制和制度,以吸引、培養和留住頂尖人才,並制定了強有力的繼任計劃和薪酬計劃,我們還爲員工提供持續的培訓。 我們對員工敬業度進行定期監測,以確保我們創造和維護一個歡迎所有員工並能夠有效做出貢獻的工作環境。
•壓力測試技術,如FCT,被用來衡量大規模和持續的不利情景的影響。通過我們的公司保險計劃,我們通過購買保險範圍來減輕我們的部分操作風險敞口,該保險範圍旨在爲犯罪活動、財產損失或損壞和責任暴露等事件造成的意外重大損失提供保險,或滿足法律要求和合同義務。
•內部資本目標是在企業一級建立的,以涵蓋所有風險,並高於最低監管和監督水平。實際資本水平受到監控,以確保它們超過內部目標。具體的操作風險和我們的風險管理策略將在下文中進一步詳細討論。
信息安全和隱私風險(1)信息和技術幾乎用於我們業務和運營的方方面面。作爲我們客戶戰略的一部分,我們繼續加強我們業務的數字方面,以支持和啓用更個人化、更主動和更具預測性的新業務模式和流程。
我們與某些第三方或受這些第三方僱傭的其他方的關係中斷,他們的聲譽或信譽受損,他們未能以商定的方式或根據適用的法律法規提供合同服務,
或者,在中斷情況下及時且經濟高效地過渡到替代第三方的能力可能會對我們的業務目標產生重大不利影響,或使我們面臨監管罰款和/或聲譽損害。
爲了管理這些風險,我們制定了符合OSFI和其他當地法規要求的全公司範圍的政策和指南,並列出了我們識別、評估、管理、監控和報告第三方風險的要求。我們的計劃包括第三方風險評估和基於風險的盡職調查方法。與第三方有關的關鍵要素和風險以書面協議的形式記錄下來,該公司以與第三方關係的規模、風險、範圍和複雜性相稱的方式監測其第三方的業績。
業務中斷風險
•爲了開展業務,我們的業務依賴於一系列資源的可用性,包括訓練有素的員工、實際位置、獲得技術和第三方。(2)我們的一個或多個關鍵業務流程或系統的持續故障可能會對我們的業務、運營和員工造成實質性的不利影響。這些故障可能是由於一系列風險導致我們的流程和系統中斷造成的,這些風險包括公用事業停電、火災、洪水、嚴重風暴、網絡攻擊、恐怖主義和其他人爲攻擊、自然災害和其他事件。我們經歷了由於我們所在地區的熱帶風暴和洪水等天氣事件以及地震和大流行風險而造成的破壞事件和影響的增加。
•環境風險的變化也可能導致業務中斷。上文在環境和社會風險標題下強調了相關影響。此外,由於我們的一些業務流程由第三方執行,並且我們的一些系統與第三方系統對接或依賴於第三方系統,如果這些第三方運營或系統降級和/或出現故障,我們可能會遇到服務中斷。(2)爲了降低這些風險,我們實施了業務連續性管理計劃,以定期測試和促進關鍵業務運營的恢復。該計劃包括業務連續性、危機管理和災難恢復規劃,幷包括對這些計劃的定期測試。
我們的政策、指導方針和運營程序建立了一致的流程,以管理對關鍵業務功能和運營的影響,並在發生重大中斷時支持有效和高效的恢復。除了定期更新和測試關鍵業務運營的業務連續性計劃外,我們還每年爲所有員工進行強制性的業務連續性意識培訓,並擁有旨在最大限度地減少停機時間並在發生重大中斷時加快恢復時間的異地備份設施和故障轉移功能。
模型風險
我們使用複雜的模型支持許多業務功能,包括產品開發和定價、資本管理、估值、財務報告、規劃、對沖、資產負債管理、風險管理和高級分析(如人工智能、預測建模和決策算法)。模型風險是指由於模型輸出不準確或對模型輸出的使用或解釋不正確而造成的財務損失、不適當或糟糕的業務決策、聲譽受損或其他不利影響的風險。
模型風險可能來自許多來源,包括
模型風險可能來自許多來源,包括
(1)不恰當的方法,
(2)假設或參數,
不正確使用源數據,
不正確使用源數據,
不準確或不及時的源數據,
錯誤的應用程序或操作員錯誤,
不斷增加的產品複雜性,以及
監管預期。
•如果模型的方法和假設沒有得到適當的設置或良好的控制,或者模型中出現數據或實施錯誤,這可能會對我們的業績和財務狀況造成負面影響。 - 3年至4年
4年至5年
4年至5年
•5年以上 - 總計
保險合同資產:
保險合同資產:
•1年內 - 1年至2年
2年至3年
2年至3年
3年至4年
•4年至5年
•5年以上
•總計
再保險合同承擔的負債:
•1年內 - 1年至2年
2年至3年
2年至3年
•3年至4年 - 4年至5年
5年以上
總計
5年以上
總計
•3年 - 5年
完畢
完畢
5年
•總計投資合同負債
•高級債券和無擔保融資次級債
債券回購協議
應付賬款和應計費用
租賃負債 | ||||||||
抵押貸款證券化的有擔保借款
| 借入資金 | 2024 | 2023 | ||||||
信貸融資(1)(2) | — | 29 | ||||||
總負債(1) | (364) | (406) | ||||||
合同承諾:(1) | (364) | (377) | ||||||
合同貸款、股票和抵押貸款合同承諾總額 | 16 | 33 | ||||||
| 2023年12月31日 | 4 | 3 | ||||||
| (百萬美元) | (102) | 21 | ||||||
| 在 | (235) | — | ||||||
1年1年至 | (681) | (320) | ||||||
(1)3年
(2)3年
5年
完畢
5年(1) 總計
投資合同負債(1).
(1)高級債券和無擔保融資
次級債
| 債券回購協議 | |||||
應付賬款和應計費用
租賃負債
抵押貸款證券化的有擔保借款
借入資金(1):
| 信貸融資 | 總負債 | |||||||||||||
| 合同承諾: | 評級下調 | 利率的變動 | 公司債券和資產支持證券的信用利差變化 | 收入較低 | ||||||||||
| 無法及時進入資本市場 | 13,873 | 7% | 13,173 | 8% | ||||||||||
| 此外,全球其他監管機構正在考慮的監管變化可能會對SLF公司及其保險子公司的資本產生不利影響。 | 81,955 | 43% | 75,493 | 43% | ||||||||||
| 信用和財務實力評級 | 9,974 | 5% | 7,138 | 4% | ||||||||||
| 財務實力評級代表評級機構對保險公司履行保單義務的能力的意見。信用評級是指評級機構對發行人及時滿足債務、優先股和一級混合資本義務條款的能力的看法,是公司整體融資狀況和獲得外部資本的能力的重要因素。評級機構下調SLF Inc.及其子公司發行的證券的信用評級,或下調SLF Inc.S保險公司子公司的財務實力評級,可能會對我們的財務狀況和經營業績產生不利影響。 | 57,619 | 31% | 54,600 | 31% | ||||||||||
| 保險公司的財務實力評級是營銷其產品以及吸引和留住代理人和分銷商的關鍵競爭因素。如果我們的信用或財務實力評級被下調,我們的財務狀況、競爭地位和經營業績可能會在許多方面受到負面影響,包括: | 1,971 | 1% | 2,183 | 1% | ||||||||||
減少保險產品、年金和投資產品的新銷售; | 15,135 | 8% | 12,018 | 7% | ||||||||||
| 要求我們降低產品和服務的價格以保持競爭力; | 9,290 | 5% | 9,723 | 6% | ||||||||||
| 更高水平的自首和撤退; | 189,817 | 100% | 174,328 | 100% | ||||||||||
(1)再保險成本較高;
增加我們的資本成本,限制我們進入資本市場的機會,從而降低我們的財務靈活性;
降低我們進行正常過程衍生產品或對沖交易的能力,並增加與此類交易相關的成本;以及
對我們與我們的顧問和我們產品的第三方分銷商的關係造成不利影響。
2024年12月31日永明人壽金融有限公司與管理層的討論和分析將於2024年12月31日在北京舉行。
| 此外,如果我們的信用或財務實力評級下調至低於某些衍生產品協議、再保險協議和其他協議規定的門檻,可能會導致該等協議的交易對手有權終止該等協議或要求我們以抵押品或信用證的形式爲該等協議提供支持。 | 評級機構使用的方法和標準的變化也可能導致評級下調,而不能反映總體經濟狀況或我們的財務狀況的變化。 | |||||||||||||
| 有關我們評級的其他信息在AIF的安全評級標題下提供。 | 加拿大 | 美國 | 資產 | 管理 | ||||||||||
| 亞洲 | ||||||||||||||
| 企業 | 7,537 | 9 | % | 6,010 | 8 | % | ||||||||
| 總計 | 15,655 | 20 | % | 14,251 | 20 | % | ||||||||
| 總計 | 1,135 | 1 | % | 1,370 | 2 | % | ||||||||
| 保險業務收入 | 4,209 | 5 | % | 3,802 | 5 | % | ||||||||
| 投資收益(損失) | 28,536 | 35 | % | 25,433 | 35 | % | ||||||||
費收入(1) | ||||||||||||||
| 收入 | 11,552 | 14 | % | 11,060 | 16 | % | ||||||||
| 保險服務費 | 7,622 | 9 | % | 7,059 | 9 | % | ||||||||
| 再保險合同持有淨(收益)費用 | 5,375 | 7 | % | 5,489 | 7 | % | ||||||||
| 保險融資(收入)已發行保險合同的費用 | 3,704 | 5 | % | 3,272 | 4 | % | ||||||||
| 再保險財務(收入)費用 | 3,020 | 4 | % | 3,149 | 4 | % | ||||||||
(減)投資合同負債增加 | 2,305 | 3 | % | 2,525 | 3 | % | ||||||||
| 其他收入 | 2,007 | 2 | % | 2,038 | 3 | % | ||||||||
| 利息支出 | 1,557 | 2 | % | 1,805 | 2 | % | ||||||||
| 營運開支及佣金 | 1,758 | 2 | % | 1,726 | 2 | % | ||||||||
| 2024年12月31日永明人壽金融股份有限公司與管理層的討論和分析將於2024年12月31日在北京舉行。 | 1,092 | 1 | % | 904 | 1 | % | ||||||||
| FVTPL資產價值以及資產和負債的外幣變動,進而可能影響不同時期收入的可比性。FVTPL資產的公允價值變動在很大程度上是由利率、信貸利差和股權回報等市場相關因素推動的。支持保險合同負債的債務和權益證券一般被指定或歸類爲FVTPL,這些資產的公允價值變動在我們的綜合經營報表的投資淨收益中記錄。支持保險合同負債的FVTPL資產的公允價值變化在很大程度上被不包括獨立基金持有人帳戶的負債的相應變化所抵消。 | 1,021 | 1 | % | 1,102 | 1 | % | ||||||||
| 手續費收入包括分銷費用、基金管理和其他基於資產的費用,主要來自資產管理部門。手續費收入還包括主要在加拿大和美國部門賺取的行政服務和其他費用。僅來自行政服務(「ASO」)的保費和存款等價物以及本公司通過獨立基金、共同基金和管理基金等投資合同收到的存款不包括在收入中;但是,本公司確實從這些合同中獲得手續費收入,這筆收入包括在收入中。手續費收入以及ASO溢價和存款等價物是我們業務的重要組成部分,因此,收入並不完全代表各自期間發生的銷售和其他活動。 | 41,013 | 50 | % | 40,129 | 52 | % | ||||||||
| (百萬美元) | 12,406 | 15 | % | 9,931 | 13 | % | ||||||||
| 保險業務收入 | 81,955 | 100 | % | 75,493 | 100 | % | ||||||||
(1) 年金
人壽保險
醫療保險
| 保險總收入 | 淨投資收益(虧損) | |||||||||||||||||||||||||
| 費用收入 | 總收入 2024年與2023年 | 總收入減少21亿美元,反映淨投資收入減少,主要來自投資資產的公允價值變化,部分被較高的保險收入所抵消。外匯翻譯營收增加3美元億。按業務集團劃分,收入反映了加拿大、美國和亞洲淨投資收入的下降,但主要是加拿大、美國和亞洲保險收入的增加部分抵消了這一影響。 | 保險收入增加了13亿,主要是由於加拿大、美國和亞洲的保險收入增加。 | 淨投資收入減少42亿美元,主要是由於反映利率影響的投資資產的公允價值變化。 | 手續費收入增加了7美元億,這是由於MFS、SLC Management以及我們其他財富和資產管理業務的手續費收入增加所致。 三、費用 | (百萬美元) | 費用 | 保險服務費 | ||||||||||||||||||
| 再保險合同持有淨(收益)費用 | ||||||||||||||||||||||||||
| 保險融資(收入)已發行保險合同的費用 | 34,472 | 3,614 | 38,086 | 46% | 30,180 | 4,339 | 34,519 | 46% | ||||||||||||||||||
| 再保險財務(收入)費用 | 20,986 | 6,486 | 27,472 | 34% | 20,111 | 6,266 | 26,377 | 35% | ||||||||||||||||||
| (減)投資合同負債增加 | 4,145 | 1,664 | 5,809 | 7% | 3,892 | 1,470 | 5,362 | 7% | ||||||||||||||||||
| 其他收入 | 6,891 | 950 | 7,841 | 10% | 5,440 | 900 | 6,340 | 8% | ||||||||||||||||||
| 利息支出 | 1,612 | 1,135 | 2,747 | 3% | 1,557 | 1,338 | 2,895 | 4% | ||||||||||||||||||
| 營運開支及佣金 | 68,106 | 13,849 | 81,955 | 100% | 61,180 | 14,313 | 75,493 | 100% | ||||||||||||||||||
總支出
2024年的總支出爲343美元億,與上年相比減少了26美元億,這主要是由於保險合同的保險財務支出下降,部分被保險服務支出增加所抵消。
2024年保險服務費用爲196美元億,與前一年相比增加了12美元億,這主要是由美國和加拿大的增長推動的。
再保險合同持有的淨收入爲1亿美元,而上一年的淨支出爲1美元億,這主要是由加拿大推動的。
再保險合同持有的淨收入爲1亿美元,而上一年的淨支出爲1美元億,這主要是由加拿大推動的。
2024年,來自51美元億的保險合同的保險融資支出減少了45美元億,這主要是由加拿大、美國和亞洲推動的。
2024年萬的其他收入爲16300美元,主要是由於提前終止了資產管理公司的一項分銷協議,而上一年與出售永明人壽英國公司和出售加拿大讚助市場業務有關的其他收入爲16900美元萬。欲了解更多信息,請參閱我們的2024年年度合併財務報表附註3。
| 2024年7美元億的利息支出比前一年增加了1美元億,這主要是由加拿大推動的。 | 管理層討論與分析永明人壽金融公司,2024年12月31日85 | |||||||||||||||||||||||||
| 與前一年相比,2024年88美元的億的運營費用和佣金增加了8美元億,這主要是由於所有業務的費用增加,以及8500萬美元的不利外匯轉換。有關更多信息,請參閱我們2024年年度合併財務報表的附註17。 | 四、稅費 所得稅 | 2024年,我們的所得稅支出爲10.4億美元,而報告的稅前淨收益爲43.39億美元,這導致有效所得稅稅率爲24.0%(2023年-4.61億美元,39.3億美元,11.7%)。 | 報告的ROE | 歸因於報告和基礎淨利潤的值得注意的項目 | 死亡率 發病率 | 失效和其他保單持有人行爲 | 費用 | 信用 | ||||||||||||||||||
| 其他 | ||||||||||||||||||||||||||
| 代表非IFRS財務衡量標準。有關更多詳細信息,請參閱本文件M -非IFRS財務指標部分。有關Sun Life業務集團中業務類型的更多信息,請參閱本文檔中的A部分-我們如何報告我們的業績。 | 13,381 | 4,410 | 17,791 | 22 | % | 10,654 | 4,572 | 15,226 | 20 | % | ||||||||||||||||
| 信用包括按公平值計入損益的資產的評級變化,以及按公平值計入其他全面收益的資產的預期信貸損失影響。 | 10,804 | 1,749 | 12,553 | 15 | % | 9,632 | 1,453 | 11,085 | 15 | % | ||||||||||||||||
| A | 26,910 | 4,520 | 31,430 | 38 | % | 23,523 | 4,653 | 28,176 | 37 | % | ||||||||||||||||
| 其他值得注意的項目記錄在盈利驅動因素分析的淨保險服務結果和淨投資結果中。有關更多詳細信息,請參閱本文件M -非IFRS財務指標部分。 | 16,392 | 2,988 | 19,380 | 24 | % | 16,872 | 3,210 | 20,082 | 27 | % | ||||||||||||||||
| 季度比較-24年第四季度與23年第四季度 | 619 | 182 | 801 | 1 | % | 499 | 425 | 924 | 1 | % | ||||||||||||||||
| 基礎淨利潤 | 68,106 | 13,849 | 81,955 | 100 | % | 61,180 | 14,313 | 75,493 | 100 | % | ||||||||||||||||
96500万美元
減少1800万美元或2%,原因是:
財富與資產管理
| 起來 | 4700万 | |||||||||||||||||||||||||
| 資產管理公司、加拿大和亞洲的費用收入增加,部分被加拿大淨投資業績下降所抵消。 | 團體-健康與保護 | 向下 | 9,900美元萬 | 美國醫療止損的不良發病率體驗和加拿大的不良發病率體驗被加拿大的業務增長部分抵消。 | 個人--保護 | 起來 | 5,500美元萬 | 改善亞洲和加拿大的保護體驗,並從亞洲的合資企業獲得更高的貢獻。 | ||||||||||||||||||
| 公司費用及其他 | ||||||||||||||||||||||||||
| 淨虧損增加2,100萬美元,主要反映支出增加,主要來自對我們亞洲業務的持續投資和亞洲的激勵性薪酬。 | 3,821 | — | 3,821 | 38 | % | 3,081 | — | 3,081 | 43 | % | ||||||||||||||||
| 報告的淨收入爲23700美元,萬減少了51200美元,萬減少了68%,主要原因是: | 2,600 | 74 | 2,674 | 27 | % | 2,185 | 68 | 2,253 | 32 | % | ||||||||||||||||
| 公司免稅投資收入較低,爲23400美元萬; | 373 | — | 373 | 4 | % | 153 | — | 153 | 2 | % | ||||||||||||||||
| 與越南銀行保險有關的無形資產減值費用18600万,反映監管和宏觀經濟因素變化導致的最新情況;以及 | 3,079 | — | 3,079 | 31 | % | 1,645 | — | 1,645 | 23 | % | ||||||||||||||||
| 美國牙科中的非經常性撥備;部分抵消 | 27 | — | 27 | — | % | 6 | — | 6 | — | % | ||||||||||||||||
| 主要反映房地產體驗改善的市場相關影響 | 9,900 | 74 | 9,974 | 100 | % | 7,070 | 68 | 7,138 | 100 | % | ||||||||||||||||
外匯換算導致基礎淨收入增加1,600萬美元,報告淨收入增加1,700萬美元。
有關可歸因於報告和基礎淨收入項目的重要項目的更多信息,請參閱本文件的D節--盈利能力;本文件的M節--非國際財務報告準則財務計量--關於報告的淨收入和基礎淨收入之間的對賬。有關永明人壽經營部門/業務組中的業務類型的更多信息,請參閱本文檔中的A部分--我們如何報告我們的業績。
2014年第一季度生效,反映了美國業務組從個人保護到集團健康和保護業務類型的費用分配方法的改進。
房地產經驗反映了房地產投資的實際價值與管理層支持保險合同負債的較長期預期回報之間的差異(「房地產經驗」)。
管理層的討論與分析永明人壽金融公司,2024年12月31日87(1)
| 2004年第四季度有效所得稅率 | 萬上漲900万美元:由更高的AUM推動的業務增長和更高的手續費收入在很大程度上被較低的淨投資業績所抵消,包括不利的信貸體驗。 | |||||||||||||||||||
| 團體-健康與保護 | 下降600美元萬:業務增長和投資增加的結果被反映較高索賠量和較長索賠持續時間的不太有利的發病率經驗所抵消。 | 個人--保護 | 上漲1,300美元萬:較低的索賠和較高的投資結果推動了有利的死亡率體驗。 | 所有業務的盈餘收益減少,主要反映淨利息收入減少。 | 公佈的淨收入爲25300美元,萬減少了9,500美元,萬減少了27%,反映了市場相關和ACMA的影響。與市場相關的影響主要來自不利的利率影響,部分被房地產體驗的改善所抵消。 | 我們報告的淨收入的有效所得稅稅率是使用所得稅前的總收入(虧損)計算的,詳見我們2024年年度合併財務報表的附註19。我們的基礎淨收入的實際所得稅稅率是使用稅前基礎淨收入計算的,如本文件M節-非國際財務報告準則財務措施所述,以及相關的所得稅支出。 | ||||||||||||||
| 代表非《國際財務報告準則》財務衡量標準。有關更多細節,請參閱本文件M節--非國際財務報告準則財務措施。 | 9,402 | 12,560 | 21,962 | 9,377 | 12,924 | 22,301 | ||||||||||||||
| 2024年12月88日至31日,永明人壽金融有限公司發佈管理層的討論和分析報告。 | 4,828 | 18,856 | 23,684 | 4,609 | 17,086 | 21,695 | ||||||||||||||
| 美國 | 208 | 8,488 | 8,696 | 159 | 7,420 | 7,579 | ||||||||||||||
| 11500美元的基本淨收入萬減少了7,200美元萬,降幅爲39%,主要原因是: | — | 680 | 680 | — | 550 | 550 | ||||||||||||||
| 團體-健康與保護 | — | 2,597 | 2,597 | — | 2,475 | 2,475 | ||||||||||||||
| 下跌7,100美元萬: | 14,438 | 43,181 | 57,619 | 14,145 | 40,455 | 54,600 | ||||||||||||||
| 由索賠嚴重程度驅動的醫療止損中的不良發病率體驗。 | 8% | 23% | 31% | 8% | 23% | 31% | ||||||||||||||
(1)個人--保護
向下
US$100万:
與上一年保持一致。
報告的淨虧損爲100美元萬,而上一年報告的淨收益爲7,700美元萬,反映了基本淨收入的減少和牙科的非經常性撥備,但被ACMA的影響部分抵消。不利的利率影響大多被房地產體驗的改善所抵消。
| 企業 | 基礎淨利潤(損失)總額 | |||||||||||||||||||
| 添加:市場相關影響(稅前) | ACMA(稅前) | 其他調整(稅前) | 上述項目的稅收費用(福利) | 按分部劃分的報告淨利潤(虧損)-普通股股東 | 資產管理 | 加拿大 | ||||||||||||||
| 美國 | ||||||||||||||||||||
| 亞洲 | — | 2,567 | 2,567 | — | 2,558 | 2,558 | ||||||||||||||
| 企業 | — | 2,633 | 2,633 | — | 2,754 | 2,754 | ||||||||||||||
| 報告的淨利潤(虧損)總額-普通股股東 | 3,205 | 1,294 | 4,499 | 3,583 | 1,256 | 4,839 | ||||||||||||||
| 代表非IFRS財務衡量標準。有關更多詳細信息,請參閱本文件M -非IFRS財務指標部分。 | — | 3,683 | 3,683 | — | 2,954 | 2,954 | ||||||||||||||
| 2024年第三季度 | 425 | 631 | 1,056 | 440 | 600 | 1,040 | ||||||||||||||
| 基礎淨利潤101600万美元 | 3,630 | 10,808 | 14,438 | 4,023 | 10,122 | 14,145 | ||||||||||||||
| 增加8600万美元或9%,原因是: | 25% | 75% | 100% | 28% | 72% | 100% | ||||||||||||||
財富與資產管理
起來
| 1700万美元:資產管理、亞洲和加拿大的手續費收入較高,部分被加拿大不利的信貸經驗所抵消。 | 團體-健康與保護 | 起來 6,000美元萬: | 美國集團福利和加拿大業務的強勁增長,加拿大更高的收費收入,以及美國集團生活死亡率體驗的改善,部分被美國牙科結果的下降所抵消。 | 個人--保護 起來 | ||||||||||
| 9,000美元萬:亞洲和加拿大的業務增長部分被亞洲不利的死亡率經歷所抵消。 | ||||||||||||||
| 公司費用及其他 | 3,630 | 25 | % | 4,023 | 28 | % | ||||||||
| 與上一年持平。 | — | — | % | 7 | — | % | ||||||||
| 萬公佈的淨收入爲134800美元,萬增加了47700美元,增幅爲55%,這是由於SLC管理層估計的與收購相關的負債減少和基本淨收入增加所致。有利的股市影響和改善的房地產體驗被利率影響所抵消。 | 2,229 | 15 | % | 1,990 | 14 | % | ||||||||
| A | 5,007 | 36 | % | 5,158 | 37 | % | ||||||||
| 2024年12月31日永明人壽金融股份有限公司與管理層的討論和分析將於2024年12月31日在北京舉行。 | 3,084 | 21 | % | 2,425 | 17 | % | ||||||||
| 2024年第二季度 | 464 | 3 | % | 530 | 4 | % | ||||||||
| 基本淨收入爲100000美元萬 | 24 | — | % | 12 | — | % | ||||||||
| 萬增長8,000美元或9%,受以下因素推動: | 14,438 | 100 | % | 14,145 | 100 | % | ||||||||
財富與資產管理
起來
3,600美元萬:資產管理、加拿大和亞洲的手續費收入增加,但部分被資產管理費用的增加所抵消。
| 團體-健康與保護 | 向下 | 5,500美元萬: | 財富與資產管理 | 起來 | ||||||||||
| 3,800美元萬 | ||||||||||||||
| 由成交量增長和收益率增加推動的更高投資收入,以及與資產管理費相關的更高收益。 | 165 | — | % | 180 | — | % | ||||||||
| 團體-健康與保護 | 6,328 | 15 | % | 5,815 | 14 | % | ||||||||
| A | 16,236 | 37 | % | 16,507 | 42 | % | ||||||||
| 起來 | 18,457 | 43 | % | 15,896 | 39 | % | ||||||||
| 400美元萬 | 1,600 | 4 | % | 1,950 | 5 | % | ||||||||
| 美國所有業務的強勁收入增長和加拿大更好的殘疾體驗在很大程度上被美國的健康和保護經驗以及加拿大較低的費用相關收益所抵消。 | 395 | 1 | % | 107 | — | % | ||||||||
| 個人--保護 | 43,181 | 100 | % | 40,455 | 100 | % | ||||||||
向下
$800万
| 由於出售永明人壽英國而導致的收益下降,以及在美國的淨投資減少,部分被反映出過去一年在亞洲的良好銷售勢頭的業務增長所抵消。 | 公司費用及其他 | 淨虧損增加5300萬美元,其中包括更高的債務融資成本。 | 業務量增長、對業務的持續投資和更高的激勵性薪酬推動了各種業務類型的更高支出。 | 公佈的淨收入爲87100美元萬增加了76000美元萬,主要是由於有利的市場相關影響,主要反映了利率被房地產經驗部分抵消,與出售永明人壽英國有關的17000美元萬費用 | ||||||||||
以及SLC管理層與收購相關的負債增加較多 | ||||||||||||||
| 在上一年,以及ACMA的影響;部分被管理層對MFS股票所有權的公允價值變化所抵消。 | 35,780 | 83 | % | 33,189 | 83 | % | ||||||||
| 管理層討論與分析永明人壽金融公司,2024年12月31日91 | 4,206 | 10 | % | 4,179 | 10 | % | ||||||||
| 2023年第二季度 | 2,314 | 5 | % | 2,173 | 5 | % | ||||||||
| 普通股東報告的DOE | 826 | 2 | % | 855 | 2 | % | ||||||||
調整: | 55 | — | % | 59 | — | % | ||||||||
| 報道 | 43,181 | 100 | % | 40,455 | 100 | % | ||||||||
(per IFRS)
Par
淨
淨保險服務結果
淨投資結果
ACMA
| 費用收入: | 資產管理 | 其他費用收入 | ||||||
| 費收入 | (106) | 872 | ||||||
| 其他費用 | 74,954 | 70,421 | ||||||
稅前收入(1) | 1,347 | 1,594 | ||||||
所得稅(費用)福利(1) | 30 | 34 | ||||||
(1)淨收入總額
分配給參與者和NCI
股息及分派
基礎淨利潤
報告的淨利潤-普通股股東
(百萬美元)
的交易活動情況
基礎能源部
非基礎調整
| 普通股東報告的DOE | 調整: | |||||||||||||
| 報道 | (per IFRS)(1) | Par 淨(1) | 淨保險服務結果(1) | 淨投資結果 ACMA(1) | ||||||||||
| 費用收入: | 1,271 | 28 | 1,488 | 32 | ||||||||||
| 資產管理 | 24 | 1 | 58 | 1 | ||||||||||
| 其他費用收入 | 52 | 1 | 48 | 1 | ||||||||||
| 費收入 | 1,347 | 30 | 1,594 | 34 | ||||||||||
(1) 其他費用
稅前收入
收購、整合和重組(美元)
無形資產攤銷(美元)
| 其他(美元) | 報告每股收益(稀釋後)(美元) | |||||||||||||
| 鑑於我們業務的性質,我們的結果對長期利率和非平行收益率曲線變動(例如,平坦化、反轉、陡化等)很敏感。 | 金額與我們的SLC管理附屬公司BentallGreenOak、紅外線資本合夥公司、新月資本集團LP和Advisors Asset Management,Inc.的收購成本有關,其中包括2024年取消其他金融負債1300萬美元(2023年至8600萬美元)的折扣。 | 主要反映了2024年(2023年)購買萬管理附屬公司剩餘所有權權益的期權的未來估計付款減少了33400美元,增加了4200萬美元。欲了解更多信息,請參閱我們2024年年度合併財務報表的附註5。 | 包括與2022年6月1日收購的DentaQuest相關的整合成本。 | 包括2003年第一季度出售加拿大讚助市場業務獲得的6,500美元萬收益,以及2003年第二季度出售永明人壽英國業務獲得的1,900美元萬收益。 | ||||||||||
| 爲了履行監管義務,在二四年第一季度,我們出售了我們在ABSLAMC的6.3%的所有權權益,產生了8,400美元的萬收益。作爲這項交易的結果,我們在ABSLAMC的所有權權益從36.5%降至30.2%,總收益爲13600美元萬。隨後在二零一四年第二季度,我們額外出售了0.2%的所有權權益。 | ||||||||||||||
| A | 552 | 7 | 491 | 5 | ||||||||||
| 2014年第二季度包括公司業務部10800美元的萬重組費用。 | 499 | 13 | 540 | 15 | ||||||||||
| 包括與越南銀行保險相關的無形資產減值費用18600万,反映了24年第四季度監管和宏觀經濟因素變化導致的最新情況。 | 1,051 | 20 | 1,031 | 20 | ||||||||||
| 2023年12月27日,百慕大頒佈了《2023年企業所得稅法》,自2025年1月1日起徵收15%的所得稅(「百慕大企業所得稅變化」)。頒佈的立法提供了經濟轉型調整,使一個實體的稅制起點更緊密地與其在2023年適用公司所得稅之前的經濟狀況保持一致。這一經濟轉型調整的好處在2023年得到確認。因此,2023年報告的淨收入增加了5,100美元萬,反映在其他調整中。 | 432 | (10) | — | — | ||||||||||
| 包括在2014年第一季度提前終止資產管理公司的分銷協議。 | 1,483 | 10 | 1,031 | 20 | ||||||||||
包括在24年第2季度進行第二支柱全球最低稅率調整。有關更多信息,請參閱本文件中2024年年度合併財務報表的附註19和D節-盈利能力。
在24年第4季度的美國牙科中包括一項非經常性條款。
包括對公司業務部在2014年第四季度較低的免稅投資收入23400美元萬的調整。
管理層討論與分析永明人壽金融公司,2024年12月31日95
| 下表顯示了基本淨收入調整的稅前金額: | |||||||||||||||||||||||
| (百萬美元) | 基本淨收入(稅後) | 基本淨收入調整(稅前): | 補充:與市場相關的影響 | 假設變更和管理行動 其他調整 | 基本淨收入調整總額(稅前) | 新增:與基本淨收入調整相關的稅項 | 報告淨收益-普通股股東(稅後) | ||||||||||||||||
| 在本文件中,ACMA報告的淨收入影響不包括可歸因於參與投保人的金額,幷包括非負債影響。相比之下,2024年年度合併財務報表附註10.B.v顯示了方法和假設變化對稅前淨收入的影響,CSM影響包括可歸因於參與投保人的金額。 | 1,476 | 3,496 | 933 | 1,469 | 448 | 7,822 | 84% | ||||||||||||||||
| 與基本淨收入調整相關的稅收可能不同於反映基於公司國際業務的業務組合的預期有效稅率範圍和其他與稅務相關的調整。 | 347 | 965 | 118 | 36 | 2 | 1,468 | 16% | ||||||||||||||||
| 3.非《國際財務報告準則》的額外財務措施 | 1,823 | 4,461 | 1,051 | 1,505 | 450 | 9,290 | 100% | ||||||||||||||||
| 管理層還使用以下非《國際財務報告準則》財務計量: | 20% | 48% | 11% | 16% | 5% | 100% | |||||||||||||||||
| 美國集團福利的稅後利潤率。 | |||||||||||||||||||||||
| 這一比率表示美國集團的基本淨收入佔淨保費的百分比。它有助於解釋我們不同時期的業績,並衡量盈利能力。這一比率的計算方法是將基礎淨收益(虧損)除以往績四個季度的淨保費。沒有可直接比較的國際財務報告準則衡量標準。 | 管理下的資產(在SLC管理中)。 | AUA代表永明人壽爲其提供管理服務的客戶資產。在資產管理中,AUA包括由SLC Management的附屬公司Advisors Asset Management,Inc.分配的資產。沒有直接可比的IFRS衡量標準。 | 管理下的資產。 | AUM是一種非IFRS財務衡量標準,它顯示了我們公司在資產管理、財富和保險方面的資產規模。在《國際財務報告準則》下沒有標準化的財務衡量標準。除了最直接可比的IFRS指標,即我們財務狀況表上的普通基金和單獨基金的餘額,AUM還包括第三方AUM和合並調整。「合併調整」是單獨列報的,合併調整適用於AUM總額的所有組成部分。 奧姆還沒有賺到手續費。 | 這一衡量標準代表了承諾的未投資資本部分,該部分目前未賺取管理費。金額取決於每個基金的具體條款和條件。沒有可直接比較的國際財務報告準則衡量標準。 | 2024年12月31日永明人壽金融有限公司與管理層的討論和分析將於2024年12月31日在北京舉行。 | CSM運動分析 | ||||||||||||||||
| 包括以下詳述的某些非國際財務報告準則財務計量,並按淨額列示某些計量,以反映業務的管理方式,而不是綜合財務報表中的總基數。例子包括i)已發出保險合約的影響按扣除再保險後的淨額列示;ii)新業務的影響按購入費用損益淨額列示;及iii)某些方法的改變按假設變動的影響列報,而綜合財務報表的列報則爲合同修訂。 | 1,558 | 3,318 | 921 | 1,468 | 668 | 7,933 | 82% | ||||||||||||||||
| 有機CSM運動 | 476 | 1,046 | 232 | 34 | 2 | 1,790 | 18% | ||||||||||||||||
| 包括新保險業務的影響、資產回報和鎖定利率的預期變動、保險經驗損益以及爲所提供服務確認的CSM。 | 2,034 | 4,364 | 1,153 | 1,502 | 670 | 9,723 | 100% | ||||||||||||||||
| 新保險業務對CSM的影響 | 21% | 45% | 12% | 15% | 7% | 100% | |||||||||||||||||
,也被稱爲「新業務CSM」,代表該期間銷售活動的增長,包括個人保護銷售(不包括合資企業),以及加拿大的固定收益解決方案和獨立基金財富銷售。新業務CSM是在扣除收購費用損益後列報的。
資產收益率和鎖定利率的預期變動(1)適用於可變費用法(「VFA」)和一般計量法(「GMA」)合同。對於VFA合同,CSM變動分析的這一部分由兩個因素組成:(I)基礎資產的預期回報和(Ii)財務擔保的衡量。實際結果和預期結果之間的差異被報告爲市場的影響。對於GMA合同,CSM的這一組成部分包括按鎖定利率增加的CSM餘額,鎖定利率是指與鎖定貼現率相關的期限結構,在出售保險合同或過渡到IFRS 17時設定。平均鎖定利率隨着有效業務和按當前費率增加的新業務的時間推移而增加。 市場和其他因素的影響(1)包括VFA合同的實際變動和預期變動之間的差額:(1)基礎資產的回報和(2)財務擔保的計量。還包括從有機CSM運動中排除的其他金額。
(1)保險經驗損益
表示保險經驗的本期影響,導致調整CSM的未來現金流發生變化。
| 假設變更的影響 | |||||
表示調整CSM的實現現金流變化對未來期間的影響。
CSM市場敏感性。
CSM市場敏感性是非《國際財務報告準則》的財務計量,在《國際財務報告準則》下沒有直接可比的計量,因此不可能將這些數額與最直接可比較的國際財務報告準則計量進行覈對。
部署。
這一衡量標準代表了在此期間投資的資本額,包括適用的槓桿。部署還包括在基礎設施交易中承諾投資於特定資產的資本。沒有可直接比較的國際財務報告準則衡量標準。
收益的驅動力。
98 2024年12月31日 Sun Life Financial Inc. 管理層的討論與分析
下表提供了計算MFS稅前淨營業利潤率的對賬:
| MFS | 2024 | 2023 | ||||||
| (US數百萬美元) | 6,179 | 6,178 | ||||||
收入(1) | 200 | 200 | ||||||
| 費用收入(根據IFRS) | ||||||||
| 減:佣金 | 2,239 | 2,239 | ||||||
減:其他(2) | 23,318 | 21,343 | ||||||
| 經調整收入 | 496 | 457 | ||||||
| 費用 | 76 | 161 | ||||||
| 費用(根據IFRS) | 26,129 | 24,200 | ||||||
淨投資(收入)/損失(根據IFRS)(3) | 13,366 | 11,786 | ||||||
減:管理層對MFS股份的所有權(扣除NCI) | 45,874 | 42,364 | ||||||
薪酬相關股權計劃調整(3)(4) | 20.1 | % | 21.5 | % | ||||
(1) 委員會
(2) 其他
(3)調整後費用
(4)稅前淨營業利潤率
其他包括會計基礎差異,例如子諮詢費用和產品津貼。
不包括非控股權益。有關管理層持有MFS股票的更多信息,請參閱基本淨利潤和基本每股收益標題。
亞洲
企業
| 總計 | 基礎淨利潤(損失) | 添加:市場相關影響(稅前)(1) | ACMA(稅前) | 其他調整(稅前) | ||||||||||
| 稅收費用(福利) | ||||||||||||||
| 報告的淨利潤(虧損)-普通股股東 | 6.30% | 基礎淨利潤(損失) | 2028 | 150 | ||||||||||
| 添加:市場相關影響(稅前) | ||||||||||||||
ACMA(稅前)(2) | 5.40% | 其他調整(稅前) | 2042 | 400 | ||||||||||
| 稅收費用(福利) | 2.58% | 報告的淨利潤(虧損)-普通股股東 | 2032 | 1,000 | ||||||||||
| (百萬美元) | 2.06% | 資產 | 2035 | 750 | ||||||||||
| 管理 | 2.46% | 加拿大 | 2031 | 500 | ||||||||||
| 美國 | 2.80% | 管理 | 2033 | 1,000 | ||||||||||
| MFS | 3.15% | SLC | 2036 | 500 | ||||||||||
| 管理 | 4.78% | 基礎淨利潤(損失) | 2034 | 650 | ||||||||||
| 添加:市場相關影響(稅前) | 5.50% | 其他調整(稅前) | 2035 | 500 | ||||||||||
稅收費用(福利) | 5.12% | 報告的淨利潤(虧損)-普通股股東 | 2036 | 750 | ||||||||||
| (百萬美元) | ||||||||||||||
| MFS | 7.093% | SLC | 管理 | 200 | ||||||||||
| MFS | ||||||||||||||
| SLC | 4.45% | 管理 | 基礎淨利潤(損失) | 250 | ||||||||||
| 添加:市場相關影響(稅前) | 4.45% | 其他調整(稅前) | 稅收費用(福利) | 300 | ||||||||||
| ACMA(稅前) | 4.50% | 其他調整(稅前) | 稅收費用(福利) | 250 | ||||||||||
報告的淨利潤(虧損)-普通股股東(3) | 1.825% | 基本淨收入與報告淨收入對帳-美國集團福利-稅前美元 | 下表列出了不包括在我們報告的美國集團福利淨收益(虧損)中的金額,該金額用於計算美國集團福利過去四個季度的稅後利潤率。 | 155 | ||||||||||
(百萬美元)(4) | 美國集團福利的基本淨收入(虧損) | 添加:市場相關影響(稅前)(6) | ACMA(稅前) | 125 | ||||||||||
其他調整(稅前)(3) | 2.967% | 稅收費用(福利) | 報告的淨利潤(虧損)-普通股股東 | 171 | ||||||||||
管理層討論與分析永明人壽金融公司,2024年12月31日101(5) | N.會計和控制事項 | 我們在本年度採用了經修訂的國際財務報告準則,這對我們的合併財務報表沒有實質性影響。有關更多信息,請參閱我們2024年年度合併財務報表中的附註2。(6) | 1.關鍵會計政策和估算 | 29 | ||||||||||
我們的重要會計和精算政策在附註中介紹(7) | 3.60% | 我們的S一號和六號 | 2081 | 1,000 | ||||||||||
(1)2024年年度
(2)合併財務報表。管理層必須做出涉及假設的判斷
(3)以及估計,其中一些可能與這些政策下固有的不確定事項有關。下面描述的估計被認爲對了解我們的財務業績特別重要。作爲我們財務控制和報告的一部分,涉及假設和估計的判斷由獨立核數師和其他獨立顧問定期審查。在確定我們的財務結果時,要求估計的會計政策是一致的。
(4)1.保險合同摘要及方法和假設
(5)摘要
(6)我們銷售各種保險合同,包括銷售給個人和團體的多種形式的人壽保險、健康保險和危重疾病保險、年金和帶擔保的獨立基金產品。我們持有再保險合同,根據內部指導方針轉移死亡率和其他風險。
(7)具有直接參與功能的保險合同是代表投保人管理投資的產品,投資回報減去可變費用後與他們獲得的保險利益一起傳遞給投保人。具有直接參與特徵的保險合同使用VFA進行衡量,包括獨立基金、單位掛鉤合同、可變萬能人壽合同和大多數參與保險合同。再保險合同(無論是已發行的還是持有的)不能使用VFA來衡量。
沒有直接參與特徵的保險合同有資格使用PAA,如果承保期爲一年或更短,或者如果應用PAA的結果預計不會與在合同有效期內的每個報告期應用GMA的結果有實質性差異。有資格使用PAA的保險合同包括大多數團體人壽和健康合同以及持有的相關再保險合同。
其他保險合同是使用GMA來衡量的。這包括大多數個人人壽保險和健康保險合同和年金以及持有的相關再保險合同。
| 綜合財務狀況表列示已發出的保險合約和作爲資產及負債持有的再保險合約,視乎投資組合是處於資產或負債狀況而定。 | ||||||||
| 有關已發行和持有的保險合約,以及獨立基金持有人帳戶的保險合約責任的更多資料,請參閱 | 2024 | 2023 | ||||||
| 2024年年度 | 584.6 | 586.4 | ||||||
| 合併財務報表。 | 0.8 | 1.0 | ||||||
| 方法和假設 | (11.5) | (2.8) | ||||||
| 一般信息 | 573.9 | 584.6 | ||||||
| 一組保險合同的總和是FCF的總和,它是未來現金流的現值加上 | ||||||||
| 非財務風險,對於使用GMA或VFA衡量的組,則爲CSM。在衡量未來現金流的現值時,必須假設死亡率和發病率、過失和其他投保人行爲(「投保人行爲」)、費用和產品生命週期內的其他因素,以及市場對我們產品財務風險成本的普遍看法。其中許多假設與預計在未來多年發生的事件有關。假設需要重要的判斷和定期審查,並在適當的情況下進行修訂。 | 2024 | 2023 | ||||||
| RA是我們對未來現金流估計中與非財務風險相關的不確定性所要求的補償。這一補償是通過將利潤率應用於估計未來現金流時使用的非財務假設的現金流貼現來衡量的。 | 3.4 | 3.6 | ||||||
| CSM代表將在提供保險合同服務時確認的未賺取利潤。 | 0.5 | 0.8 | ||||||
| 定期審查保險合同計量中使用的方法和假設,並接受外部精算同行審查。 | (0.8) | (1.0) | ||||||
| 未來現金流的現值 | 3.1 | 3.4 | ||||||
根據《國際財務報告準則》和加拿大公認的精算慣例,對未來現金流量現值中的非金融風險變量的假設應是對預期結果的當前中性估計。假設的選擇考慮了當前情況、我們自己的經驗或來自行業的過去經驗數據、過去與預期未來經驗的關係、反選擇、假設(包括金融風險變量的假設)之間的關係,以及其他相關因素。
對未來現金流量現值中的財務風險變量的假設是基於當前可觀察到的市場價格,並根據我們產品中隱含的財務風險與相應可觀察市場工具中的財務風險之間的差異進行了調整。在沒有相關市場工具的情況下,我們根據國際財務報告準則和加拿大公認的精算慣例,使用可獲得的最佳信息。
2024年12月31日永明人壽金融股份有限公司與管理層的討論和分析將於2024年12月31日在北京舉行。
死亡率
死亡率是指特定人群的死亡率。死亡率假設通常基於過去五到十年的經驗。我們的經驗與行業經驗或再保險公司的經驗相結合,而我們自己的經驗不足以在統計上有效。人壽保險和年金合同的假設死亡率包括基於最近人口死亡率趨勢和我們對未來趨勢的展望而對未來死亡率改善的假設。
發病率
發病率是指不健康或殘疾的比率以及從這些比率中恢復過來的比率。我們的大部分殘疾保險是以團體爲基礎進行銷售的。我們在加拿大和亞洲以個人爲基礎提供危重疾病保單,在加拿大以個人爲基礎提供長期護理,在美國以團體爲基礎提供醫療止損保險。在加拿大,團體發病率假設基於我們五年的平均經驗,並進行了修改,以反映恢復率的任何新趨勢。對於加拿大和亞洲的加拿大長期護理和危重疾病保險,假設是與我們的再保險公司合作開發的,主要基於他們的經驗。在美國,我們的經驗被用於醫療止損和傷殘假設,並考慮了行業或再保險公司的經驗。
投保人行爲
投保人行爲
過失或投降
投保人可選擇不繼續支付保費或放棄其保單以換取現金退還價值,從而使其保單在合同承保期結束前失效。對人壽保險失效或退保經驗的假設通常基於我們五年的平均經驗。違約率或退保率因計劃、爭議年齡、保費支付方式、保單期限和金融風險變量而異。
保費支付模式
對於萬能人壽合同,有必要設定保費支付模式的假設。由行業或精算專業準備的研究被用於我們的經驗不足以在統計上有效的產品。保費支付模式通常因計劃、年齡、保費支付方法、保單期限和金融風險變量而異。
費用
未來可直接用於履行我們的保險合同的費用包括收取保費、索賠裁決和處理、精算計算、準備和郵寄保單報表以及相關管理費用。未來的費用假設主要基於我們最近使用內部費用分配方法的經驗。未來支出中假定的通脹增長是基於長期預期。
| 直接歸屬於保險合同組合的收購費用包括銷售、承銷和發行保險合同的成本。對於使用GMA或VFA計量的新保險合同,實際或估計的直接應占購置費用在合同的初始計量中確認。如果使用估計,當保險合同組對新合同關閉時,估計和實際購置費用之間的差額將調整CSM。 | 2024 | 2023 | ||||||
| 當前貼現率 | ||||||||
當前貼現率用於在確定未來現金流的現值時對未來現金流的估計進行貼現。當前的貼現率反映了貨幣的時間價值、現金流的特徵以及保險合同的流動性特徵。 | 26,164 | 24,076 | ||||||
| 現金流的當前貼現率不隨基礎項目的回報而變化 | 2,430 | 771 | ||||||
| 根據任何標的項目的回報完全不變的現金流按反映現金流的時間和貨幣以及保險合同的流動性特徵的利率進行貼現。 | 10,431 | 10,566 | ||||||
| 現金流的時序通過構建貼現曲線來反映,因此每個現金流都按照現金流的時序進行貼現。在構建貼現曲線時,一部分基於市場信息(可觀測期間),超過該期間後,估計貼現率(不可觀測期間)。可觀察期因貨幣而異,是關於無風險利率的信息深度和流動性的時期。在不可觀察期間,無風險利率是在最後一個可觀察點和70年的最終無風險利率之間進行內插的。最終無風險比率是根據《國際財務報告準則》和加拿大公認的精算慣例,使用歷史平均值估算的。 | 6,318 | 6,348 | ||||||
現金流的幣種通過對不同幣種使用不同的貼現曲線來反映。 | ||||||||
| 流動性是通過在無風險貼現率中加上符合保險合同流動性特徵的流動性溢價來反映的。可觀察期內的流動性溢價是基於具有類似流動性特徵的資產的流動性溢價,該溢價是從當前市場收益率的內在利差減去預期和意外的信貸損失後估計的。預期和意外信貸損失的扣除額是使用評級機構的歷史數據和當前市場狀況估計的,並因資產類型、質量和期限而異。不可觀察期間的流動資金溢價是根據國際財務報告準則和加拿大公認的精算慣例,在上一次可觀察到的流動資金溢價和特定於流動或非流動性合約的最終流動資金溢價(在70年)之間插入的。見中的注10.A | 4,788 | 4,620 | ||||||
| 2024年年度 | 11,283 | 10,668 | ||||||
| 綜合財務報表提供更多細節,提供貼現曲線的加權平均摘要,用於顯示所有主要產品的價值現金流,這些產品不會根據標的項目的回報而變化。 | 29,272 | 26,473 | ||||||
| 現金流的當前貼現率隨基礎項目的回報而變化 | 6,838 | 6,165 | ||||||
現金流的貼現率與標的項目的回報率直接相關,反映了這種可變性。對於將標的項目的回報傳遞給投保人的現金流部分,貼現率是這樣的:現金流的現值等於標的項目傳遞給投保人的部分。對於與基礎項目(如財務擔保)不同但不是直接變化的現金流,可能有必要進行情景測試。如果是這樣的話,情景預測中使用的貼現率是特定於情景的,並基於情景中預測的無風險利率加上與被衡量合約的流動性特徵一致的流動性溢價。 | 36,110 | 32,638 | ||||||
| 管理層討論與分析永明人壽金融公司,2024年12月31日103 | ||||||||
| 場景測試 | 26,196 | 24,068 | ||||||
| 當現金流和財務風險變量之間的關係是非線性的,或者現金流之間存在複雜的相互依存關係時,可能需要進行情景測試。在財務風險變量的情景測試中,預測每個情景路徑的未來現金流,並按情景特定的貼現率進行貼現,從而得出每個情景的未來現金流的現值。預計現金流的撥備是具體情況價值的平均值。對非金融風險變量的假設是與情景一致的最佳估計假設。 | 5,497 | 4,984 | ||||||
| 情景與當前市場環境是一致的。我們的經濟情景生成器校準過程生成金融風險變量(例如,無風險利率、債券基金回報、股票回報)的綜合隨機情景,其參數經過校準,以複製市場上可見的金融工具的可觀察市場價格。當被計量的保險合同是非流動性的,但情景被校準的金融工具是流動性的時,就會進行調整。 | 706 | 719 | ||||||
| 非金融風險的風險調整 | 2,332 | 2,139 | ||||||
| 已發行保險合同的風險評估是我們因承擔非金融風險產生的現金流的數額和時間的不確定性而要求的補償。這一數額是按對非財務假設適用邊際的估計未來現金流量與未作此調整的估計未來現金流量之間的差額的現值計算的。利潤率一般在5%至20%之間,這取決於確定假設的不確定性。不確定性的程度以及所選擇的按金因假設、業務範圍和其他因素而異。通常會導致選擇範圍較高的利潤率的考慮因素如下: | 23,737 | 21,942 | ||||||
| 我們經驗的統計可信度太低,不能作爲選擇假設的主要數據來源; | 152 | % | 149 | % | ||||
未來的經歷很難估計;
風險隊列缺乏同質性;
操作風險對評估假設的能力產生不利影響;或
過去的經歷可能不能代表未來的經歷,而這種經歷可能會惡化。
利潤率隨着時間的推移通常是穩定的,只是爲了反映假設中不確定性水平的變化而進行修訂。我們的利潤率往往處於中檔。
所持再保險合約的風險承保額代表轉移至再保險人的風險金額。這是指沒有再保險的標的保險合約的註冊協議與有再保險的標的保險合約的註冊協議之間的差額。所持再保險合約的風險承保人增加所持再保險合約的資產或減少所持再保險合約的負債。
保險合同的RA總體上相當於大約85%-90%的置信度。
合同服務利潤率
CSM的初始和後續計量在我們2024年年度合併財務報表的附註1中描述。下面提供了有關CSM測量的某些組成部分的其他詳細信息。
利息累加
對於使用GMA衡量的保險合同,鎖定貼現率用於在CSM上計入利息。一組保險合同的鎖定貼現率是初始確認該組合同時當前貼現率的加權平均。
| 對於使用VFA計量的保險合同,不存在利息增值。相反,CSM是根據我們在標的項目公允價值中所佔份額的變化進行調整的。 | 2024 | 2023 | 2022 | ||||||||
| 與未來服務有關的財務狀況變化 | 3.24 | 3.00 | 2.76 | ||||||||
| 對於使用GMA衡量的保險合同,鎖定貼現率被用來衡量與未來服務有關的FCF的變化。與未來服務有關的財務狀況變化反映了非財務假設的變化,但不反映與財務風險有關的假設的變化。 | |||||||||||
| 對於使用VFA衡量的保險合同,當前貼現率被用來衡量與未來服務有關的FCF的變化。與未來服務有關的財務狀況變化既反映了非財務假設的變化,也反映了與財務風險有關的假設的變化。 | 1.112500 | 1.112500 | 1.112500 | ||||||||
| 與未來服務有關的FCF變化包括(僅對剩餘保險的責任): | 1.112500 | 1.112500 | 1.112500 | ||||||||
| 與投資部分付款有關的所有變動(包括本期付款); | 1.125000 | 1.125000 | 1.125000 | ||||||||
用於推算未來現金流現值的假設的變化--僅限於使用GMA計量的保險合同的非財務假設;(1)(2) | 0.456250 | 0.456250 | 0.456250 | ||||||||
本期索賠產生的未來現金流量的變化;以及(3) | 1.550162 | 1.504236 | 0.701122 | ||||||||
對於使用GMA衡量的保險合同,與一些萬能人壽和可調整產品的可自由支配現金流相關的變化。可自由支配現金流是指保證支付給投保人之外的現金流,並被描述爲賺取利率(在某些萬能人壽合同的情況下)的利差,以及關於可調整保單可調整保單變更標準的政策。(1)(4) | 0.741750 | 0.741750 | 0.741750 | ||||||||
CSM因提供的服務而獲得認可(5) | 1.740682 | 1.694235 | 0.891122 | ||||||||
(1)在每個期間確認爲保險收入的CSM金額,以反映該期間爲一組合同提供的保險合同服務,由以下因素確定:
(2)根據保險合同服務的數量,確定集團內的總承保單位(對於本期和未來期間的服務);
(3)在期末將CSM平均分配給當前期間的每個覆蓋單位並預期在未來提供(即,覆蓋單位將所提供的服務「單位化」);然後
(4)2024年12月31日永明人壽金融有限公司與管理層的討論和分析將於2024年12月31日在北京舉行。
(5)在保險收入中確認在該期間分配給承保單位的金額。
預計在未來期間提供的服務的總覆蓋率單位是預計覆蓋率單位的現值。現值是通過使用GMA衡量的集團的鎖定貼現率和使用VFA衡量的集團的當前貼現率來衡量的。
集團的承保單位是根據所提供的保險合同服務的性質確定的。保險合同服務包括提供保險範圍的服務,對於某些合同,還包括投資回報或與投資有關的服務。它不包括與履行索賠裁決等職能有關的服務。如果向一組保險合同提供一種以上的服務,則承保單位反映所提供的主要服務。
對於使用VFA計量的保險合同,承保單位是基於投保人的帳戶價值或投保人在標的項目公允價值中的份額。對於使用GMA衡量的保險合同,承保單位是基於人壽保險和健康保險合同的預期索賠金額(不包括任何投資部分),以及年金合同在一段時間內應支付的金額。
對於持有的再保險合同,確認的CSM金額反映了在此期間接受的服務。
| 對保險方法和假設的敏感性 | 2024 | 2023 | ||||||
| 除了本文件K部分-風險管理和2024年AIF的風險因素部分所述的保險風險因素和風險管理治理和控制外,我們還注意到,在採用IFRS 17和9時,下表包括合同服務利潤率對保險和其他非財務假設風險的敏感性。 | 11,170 | 9,372 | ||||||
| 下表列出了根據截至2024年12月31日的起點和業務組合,計算保險合同負債時使用的保險和其他非財務假設的某些瞬時變化對CSM和淨收入的估計即時影響或敏感度 | ||||||||
| 和 | 2,532 | 5,612 | ||||||
| 2023年12月31日。這些敏感性是針對每個風險因素單獨計算的,通常假設所有其他風險變量保持不變。這些估計是說明性的,最佳估計假設、CSM餘額和業務組合的不同起點將導致不同的估計敏感性。這些敏感性代表了公司對最佳估計假設變化的估計,這些假設很可能基於公司和/或行業在2024年12月31日和2023年12月31日的歷史經驗和行業標準和最佳實踐。 | (337) | (559) | ||||||
| 對CSM的影響可歸因於根據GMA和VFA衡量的保險合同。對於根據GMA衡量的保險合同,影響以鎖定的貼現率流經CSM。對於根據VFA衡量的保險合同,影響按當前貼現率流經CSM。 | (3,882) | (3,086) | ||||||
| 對淨收入的影響可歸因於根據GMA和VFA衡量的保險合同的敏感度不能被CSM吸收的任何部分,根據PAA衡量的對保險合同的全部影響,以及根據GMA衡量的保險合同的鎖定貼現率和當前貼現率之間的影響差異。如果目前的貼現率高於鎖定利率,這通常會對根據GMA衡量的合同淨收入產生有利影響。 | 471 | (169) | ||||||
| (百萬美元) | (1,216) | 1,798 | ||||||
| 截至2024年12月31日 | 9,954 | 11,170 | ||||||
| 截至2023年12月31日 | 3,744 | 2,003 | ||||||
| 敏感度 | 13,698 | 13,173 | ||||||
對CSM的潛在影響(稅前)
對……的潛在影響
淨收益/權益(稅後)
•對……的潛在影響
•CSM(稅前)
•對……的潛在影響
•現金、現金等價物和短期證券被歸類爲爲滿足短期現金需求而持有的交易,並由於其短期性質或由於它們經常被重新定價爲當前市場匯率而在FVTPL入賬。
•獨立基金持有人帳戶的投資按公允價值計入,公允價值變動計入獨立基金的已實現淨收益和未實現收益(虧損),不計入我們的綜合經營報表。獨立基金持有人戶口的投資公允價值乃根據活躍市場的未經調整報價或投資經理提供的獨立估值資料厘定。獨立基金持有人帳戶投資內的直接投資的公允價值,例如短期證券和政府及公司債務證券,是根據上文各資產類別章節所述的估值方法及投入厘定。抵押貸款證券化的有擔保借款的公允價值是基於上述資產擔保證券的方法和假設。
投資合同的公允價值通過使用預期貼現現金流量法計量。對於單位掛鉤合同,公允價值等於當前單位基金價值,如果需要,再加上公允價值基礎上的額外非單位負債額。對於非單位掛鉤合同,公允價值等於合同現金流量的現值。由於合同的性質,投資合同負債的公允價值接近其賬面價值。
2024年12月31日永明人壽金融有限公司與管理層的討論和分析將於2024年12月31日在北京舉行。(1)這些債務的公允價值以標的證券的公允價值爲基礎,其中可能包括債務證券或股權證券。用於確定公允價值的方法是基於活躍市場上的報價市場價格。
我們CLO中相關資產的公允價值主要是根據可觀察的市場投入來確定的,例如活躍市場中類似資產的報價和其他可觀察的市場數據。
| 我們CLO內相關負債的公允價值是通過使用適用於具有類似收益率、信用質量、期限特徵和結構性信貸保護的金融工具的當前市場利率對預期未來合同現金流進行貼現來確定的。估值技術最大限度地利用了可觀察到的投入,納入了可比證券的價格和其他市場情報。 | 確定投資合同負債公允價值的方法和假設載於2024年年度綜合財務報表附註10.A。 | 我們根據用於計量公允價值的估值技術的投入的優先順序,將按公允價值列賬的資產和負債分類爲三級公允價值等級,如下: | ||||||||||||||||||||||||||||||
| 第1級:公允價值以活躍市場中相同資產或負債的未調整報價爲基礎。被歸類爲第1級的資產和負債類型通常包括現金和現金等價物、某些美國政府和機構證券、交易所交易股票證券以及爲獨立基金持有人的帳戶持有的某些獨立基金和共同基金單位。 | 第2級:公允價值基於活躍市場交易的類似資產或負債的報價,或使用重大可觀察投入的估值技術的價格,或主要來自可觀察市場數據或通過相關性或其他方法得到證實的投入。歸類爲2級的資產和負債類型通常包括加拿大聯邦、省和市政府、其他外國政府和公司債務證券、某些資產支持證券、場外衍生品以及爲獨立基金持有人的帳戶持有的某些獨立和共同基金單位。 | 第3級:公允價值是以估值技術爲基礎的,這些技術需要一種或多種不是基於可觀察到的市場投入的重要投入。這些不可觀察到的輸入反映了我們對市場參與者在爲資產或負債定價時將使用的假設的預期。被歸類爲第三級的資產和負債類型通常包括某些公司債券、某些其他投資資產和投資財產。 | 隨着定價輸入變得或多或少可觀察到,資產在層次結構中的各個級別之間轉移。收入和保險金的總損益是在期初假設轉入或轉出第三級的情況下計算的。對於在報告期內轉入第三級的金融工具,該期間公允價值的全部變動包括在我們的2024年年度合併財務報表附註5的第三級對賬時間表中。對於報告期內轉出3級的情況,本公司2024年年度合併財務報表附註5中的3級對賬時間表不包括該期間的公允價值變動。當用於爲金融工具定價的投入缺乏可觀察到的市場數據,因此在報告日期不再符合第一級或第二級標準時,就會發生轉移到第三級的情況。當定價投入變得更加透明,並在報告日期滿足第一級或第二級標準時,就會發生第三級以外的轉移。 | 在截至2024年12月31日的一年中,流入和流出3級金融資產的資金分別爲6.24億美元和10.58億美元(2023年12月31日-分別爲3.9億美元和9.18億美元)。截至2024年12月31日(2023年12月31日 | 有關投資的公允價值計量的其他信息可在我們的2024年度合併財務報表附註5中找到。 | 商譽 | ||||||||||||||||||||||||||
| 商譽是指收購成本超過被收購企業可確認的有形和無形資產淨值的公允價值。商譽按原始成本減去其後產生的任何減值列賬。若發生可能導致現金產生單位(「CGU」)的可收回金額低於其賬面價值的事件或情況,商譽每年或更頻繁地被評估減值。CGU是可識別的最小資產組,其產生的現金流入在很大程度上獨立於其他資產組的現金流入。商譽餘額將分配給預計將從業務合併的協同效應中受益的個別或集團CGU。商譽減值是通過將一個或一組CGU的賬面價值與其可收回金額進行比較來量化的,後者是公允價值減去銷售成本和使用價值兩者中的較高者。減值損失立即確認,不能在未來期間沖銷。 | 於2024年確認的商譽並無減值費用。截至2024年12月31日,我們的商譽賬面價值爲945600美元萬。有關商譽的更多信息可在我們2024年年度合併財務報表的附註9中找到。 | $ | 500 | 無形資產 | $ | 11 | 2028 | 無形資產包括有限年限無形資產和無限年限無形資產。有限壽命無形資產以直線方式或使用生產單位法在有用的經濟壽命內攤銷:一)分配、實地部隊的銷售潛力、客戶關係和資產管理合同--3年至40年;二)內部生成的軟件--3年至10年。攤銷是通過運營費用計入的。有限年限無形資產的使用年限每年審查一次,並根據需要進行攤銷調整。無限期壽命無形資產不攤銷,如果事件或情況變化表明資產可能減值,則每年或更頻繁地評估減值。減值是通過比較無限期終身無形資產的賬面價值與其可收回金額來評估的。可收回金額是資產的公允價值減去出售成本和其使用價值兩者中較高的一個。如果無限期終身無形資產的賬面價值超過其可收回金額,這些資產被視爲減值,減值費用在我們的綜合經營報表中確認。無形資產的可收回金額是使用不同的估值模式厘定的,這些模式要求管理層作出某些判斷和假設,而這些判斷和假設可能會影響對可收回金額的估計。 | $ | 400 | 2.2024年通過的新修訂的國際財務報告準則 | $ | 11 | 2025 | ||||||||||||||||||
| 2022年9月,國際會計準則理事會發布了對《國際財務報告準則第16號》的修正案 | 租賃 | $ | 1,400 | 爲銷售和回租交易添加後續計量要求 | $ | 1,126 | 2025 | 符合《國際財務報告準則》第15號的要求 | $ | 1,710 | 與客戶簽訂合同的收入 | $ | 1,384 | 2024 | ||||||||||||||||||
| 作爲銷售入賬。修正案要求出賣人-承租人隨後以不確認與其保留的使用權有關的任何收益或損失的方式計量因回租而產生的租賃負債。這項修正案於2024年1月1日生效,並未對我們的合併財務報表產生實質性影響。 | $ | 500 | $ | 500 | 2025 | $ | 500 | $ | 500 | 2025 | ||||||||||||||||||||||
| 2.b將於2025年或以後採用的新的和修訂的國際財務報告準則 | 2024年4月,國際會計準則理事會發布了國際財務報告準則第18號 | $ | 100 | 財務報表中的列報和披露 | $ | — | (《國際財務報告準則第18號》)取代了《國際會計準則1 | 財務報表的列報 | $ | 100 | 。國際財務報告準則第18號對損益表的列報、管理層定義的業績衡量的披露以及財務報表和附註中財務信息的彙總和細分原則提出了新的要求。國際財務報告準則第18號將在2027年1月1日或之後的年度報告期內生效。國際財務報告準則第18號將追溯適用。我們目前正在評估《國際財務報告準則第18號》將對我們的合併財務報表產生的影響。 | $ | — | 2024年5月,國際會計準則理事會發布了對國際財務報告準則第9號的修正案 | ||||||||||||||||||
| 及國際財務報告準則第7 | $ | 179 | $ | 103 | 金融工具:披露 | $ | 229 | $ | 95 | 。修正案澄清了對通過電子轉賬結算的金融負債的取消確認,並引入了一項會計政策選擇,即如果滿足特定標準,則在結算日期之前取消確認通過電子轉賬結算的金融負債。修正案還澄清了具有環境、社會和公司治理以及類似特徵的金融資產的分類,並要求對某些金融工具進行額外披露。這些修正案將在2026年1月1日或之後開始的年度報告期內生效。這些修訂將追溯到適用範圍。我們目前正在評估這些修訂對我們的綜合財務報表的影響。 | ||||||||||||||||||||||
| 3.披露控制和程序 | 本公司已建立披露控制及程序,旨在提供合理保證,確保所有相關信息均已及時收集及報告予高級管理層,包括本公司執行副總裁兼首席執行官總裁、執行副總裁總裁兼首席財務官(「首席財務官」),以及執行副總裁兼首席法務官兼公共事務總監總裁,以便就公開披露作出適當決定。 | $ | 25 | 根據加拿大證券監管機構和美國證券交易委員會採納的規則,截至2024年12月31日,在包括首席執行官和首席財務官在內的公司管理層的監督和參與下,對我們的披露控制程序和程序的有效性進行了評估。根據我們的評估,首席執行官和首席財務官得出結論,截至2024年12月31日,這些披露控制和程序的設計和運營是有效的。 | $ | 1 | -當現金流出承諾到期時,我們可能無法爲所有現金流出承擔提供資金;以及 | 其他風險 | $ | 25 | -我們經營所在司法管轄區的會計標準的變化;與我們的國際業務相關的風險,包括我們的合資企業;影響我們的資本狀況或籌集資本能力的市場狀況;財務實力或信用評級的下調;以及稅務問題,包括計算稅收時使用的估計和判斷。 | $ | 3 | 除法律要求外,公司沒有義務更新或修改其前瞻性陳述,以反映本文件發佈之日後的事件或情況,或反映意外事件的發生。 | ||||||||||||||||||
管理層討論與分析永明人壽金融公司,2024年12月31日111
<img src=「https://www.sec.gov/akam/13/pixel_7edab372?a=dD0zNjk0MDAyODhlMDk0YzQxOTY4MjJiZDNkODNlNWQwODY3ODRmZWFjJmpzPW9mZg==」Style=「可見性:隱藏;位置:絕對;左側:-999px;頂部:-999px;」/>
Based on our historical cash flows and liquidity management processes, we believe that the cash flows from our operating activities will continue to provide sufficient liquidity for us to satisfy debt service obligations and to pay other expenses as they fall due.
(1)This is a non-IFRS financial measure. See section M - Non-IFRS Financial Measures in this document.
MANAGEMENT'S DISCUSSION & ANALYSIS Sun Life Financial Inc. December 31, 2024 51
| K. Risk Management | |||||
1. Risk Management Framework
The Company has an established Risk Management Framework ("Risk Framework") approved by the Board that sets out the components of our risk programs and explains how they operate together in conducting business activities. The risks that arise when providing products and services to Clients, which are in line with our Purpose to help our Clients achieve lifetime financial security and live healthier lives, are managed within these protocols and programs. Effective risk management is critical to the overall profitability, competitive market positioning, organizational resilience and long-term financial viability of the Company. While all risks cannot necessarily be eliminated or known with certainty, the Risk Framework seeks to ensure that risks to a business undertaking are appropriately managed to achieve the Company's business objectives over time and are not expected to exceed the pre-established boundaries for risk taking. The Risk Framework, corporate strategy and business objectives are all aligned to each other, and the risk management protocols and programs are embedded within every business segment.

52 December 31, 2024 Sun Life Financial Inc. MANAGEMENT'S DISCUSSION & ANALYSIS
2. Risk Governance and Accountabilities
Our Risk Framework sets out lines of responsibility and authority for risk-taking, governance and control. These governance requirements are summarized below.
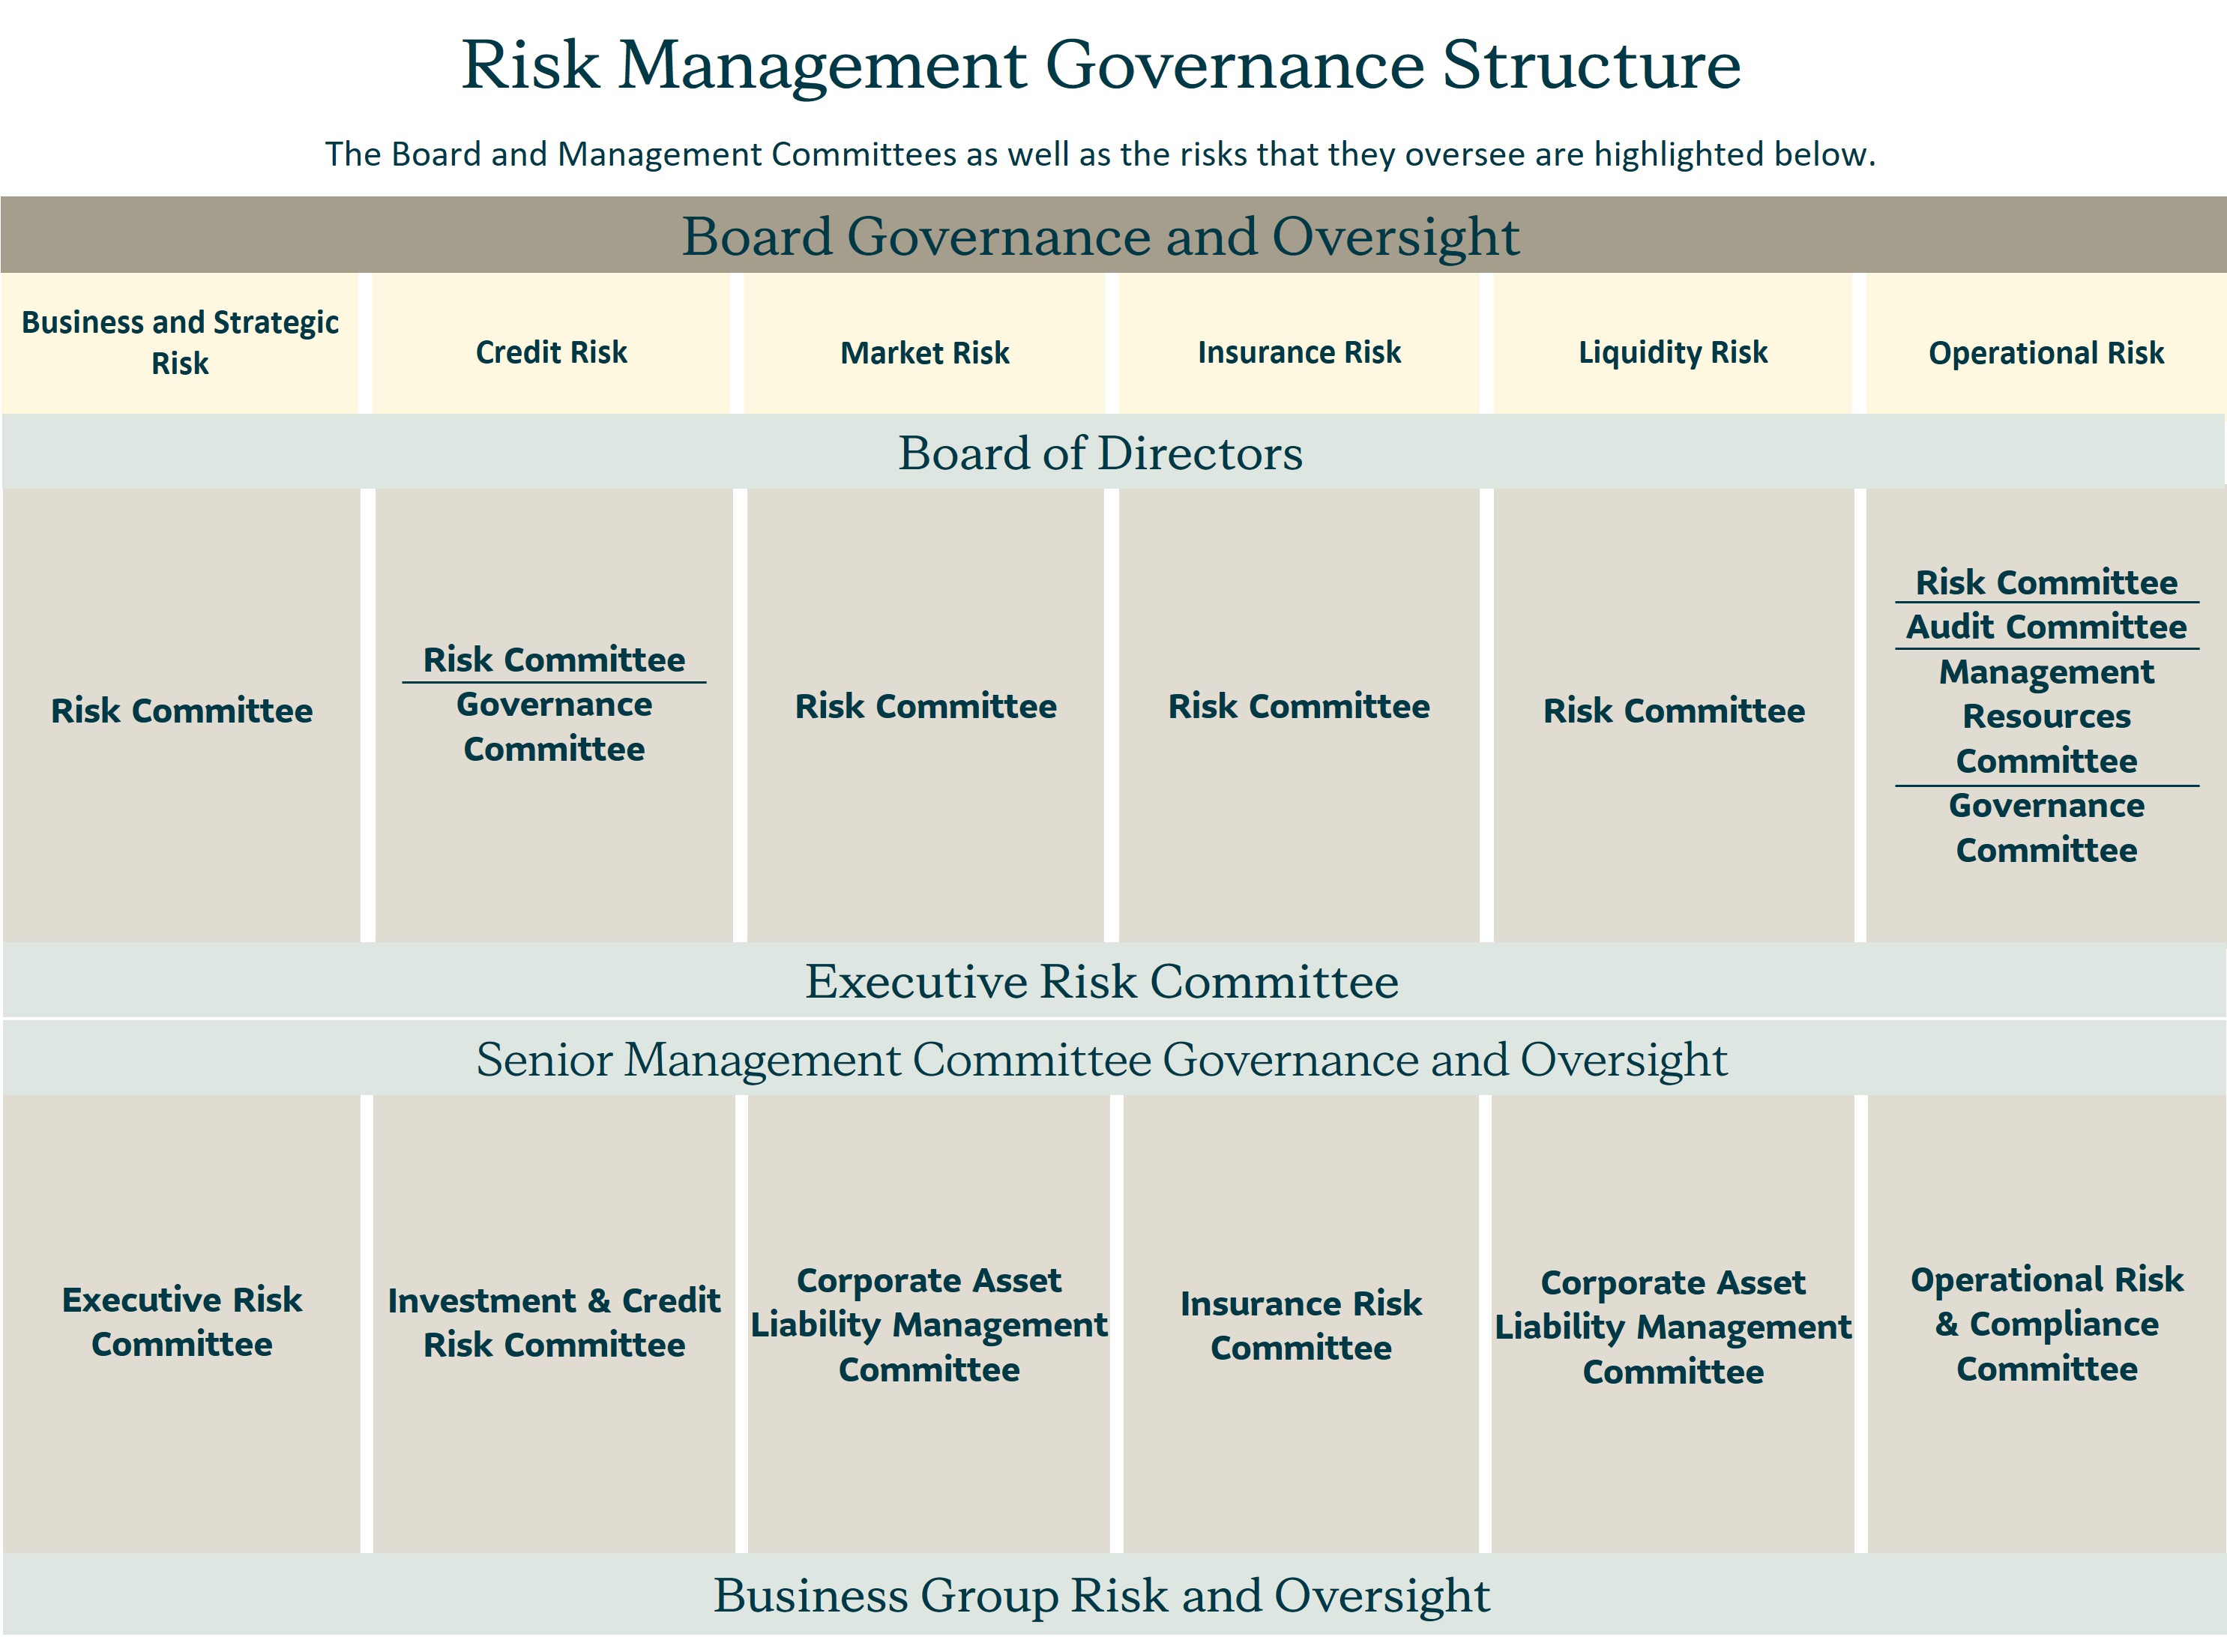
Board of Directors
The Board and its committees are responsible for ensuring the governance of all risks across the enterprise and have primary responsibility for ensuring risk management frameworks, policies, programs and practices are in place. By approving our Risk Framework, Risk Appetite Policy, Capital Risk Policy and Capital and Liquidity Management Framework and providing ongoing oversight of the risk management programs, the Board monitors that key risks are appropriately identified and managed. Business and strategic risk is overseen through review and approval of the Business and Strategic Plans, and the Board regularly discusses key themes, issues and risks arising in connection with the design or implementation of these plans.
The Risk Committee is a standing committee of the Board whose primary functions are to assist the Board with oversight of current and emerging risks enterprise-wide, and of the Risk Management function to ensure that management has in place programs, policies, processes and controls designed to identify and effectively manage the significant risks to which the Company is exposed and has sufficient capital to underpin those risks. It reviews and approves all risk management frameworks and policies and reviews compliance with those frameworks and policies. In addition, where the Board has delegated risk oversight to other committees of the Board ("Board Committees"), the Risk Committee provides the Board with an integrated view of oversight of risk management across all Board committees. The Risk Committee regularly monitors the Company's risk profile to ensure it is within the agreed risk appetite and that the Company's capital position exceeds regulatory capital requirements, and monitors and recommends to the Board for approval, the specific risk limits allocated to the businesses and the annual Capital Plan. The Risk Committee also oversees risk management activities of our subsidiaries and joint ventures under the Company's management control and risks posed to the Company through its other joint ventures.
The Governance Committee of the Board is responsible for assisting the Board in overseeing (i) the development of effective corporate governance guidelines and processes, including those addressing the effectiveness of the Board and its committees and director succession planning and recruitment; (ii) the Company's Investment Plan and investment performance, including investment practices, procedures and controls related to the management of the general fund investment portfolio; (iii) sustainability matters including the Company's Sustainability Policy, Sustainability Strategy (including the development of a Climate Transition Plan) and Sustainability Report; and (iv) compliance and compliance management programs, including compliance with legal and regulatory requirements, the identification and management of compliance risk, and the development of policies and processes to sustain ethical behaviour. The Committee also serves as the conduct review committee of Sun Life and the conduct review committee for certain subsidiaries of Sun Life that are federally regulated
MANAGEMENT'S DISCUSSION & ANALYSIS Sun Life Financial Inc. December 31, 2024 53
financial institutions in accordance with applicable provisions of the Insurance Companies Act (Canada) and Trust and Loan Companies Act (Canada).
The Audit Committee of the Board is responsible for assisting the Board in (i) overseeing the integrity of financial statements, disclosures and related information provided to shareholders and other stakeholders, as well as regulatory, tax and litigation matters; (ii) overseeing the compliance with financial regulatory requirements, adequacy and effectiveness of the internal controls implemented and maintained by management; (iii) reviewing and approving the annual internal audit plan, and reviewing the Chief Auditor’s quarterly reports on the effectiveness of the Company’s internal controls; (iv) reviewing the External Auditor's findings reports and assessing the qualifications, independence and performance of the External Auditor; and (v) reviewing the mandate, resourcing, objectives and succession plans for the Chief Actuary, Chief Auditor and Chief Financial Officer.
The Management Resources Committee of the Board is responsible for assisting the Board with oversight of succession planning for senior executive positions and programs to effectively attract, retain, develop and reward employees. It provides guidance to management on advancing the talent agenda to achieve strategic objectives and foster the Company's culture. The Committee reviews incentive designs and governance of material incentive programs against alignment with business objectives and avoiding excessive risk taking. It reviews the implications of key enterprise risks, including people and culture risks pertaining to compensation design and human resources practices. In addition, the Committee reviews compensation matters, including the remuneration of executives who have a material impact on the risk exposure of the Company.
Senior Management Committees
The Executive Risk Committee ("ERC") provides executive management oversight of the Company's enterprise risk management activities. This includes the review and articulation of the risk appetite and overseeing that the risk profile is within the agreed risk appetite. ERC also oversees that there are policies, processes and controls in place to identify and effectively manage the significant risks. This is done in accordance with the risk appetite and the overall objective of promoting a balanced business and product model to achieve agreed upon risk-adjusted returns and allocate capital accordingly.
The Investment & Credit Risk Committee is responsible for reviewing critical matters related to the on-going management of the Company's General Fund. Accordingly, the Committee is responsible for overseeing, monitoring and reviewing current and potential credit and investment risk exposures, other credit and investment risk management issues and future credit and investment risk management strategies.
The Corporate Asset Liability Management Committee is responsible for providing oversight and input on the Asset Liability Management framework, policies, guidelines, limits, measurement and performance assessment applicable to the management of market and liquidity risks, as well as providing oversight of asset liability management and hedging strategy changes.
The Operational Risk & Compliance Committee is responsible for providing oversight of the Company's operational and compliance risk management practices, current and emerging operational risk exposures, and the processes to ensure ongoing identification of major operational and compliance risks facing the Company.
The Insurance Risk Committee is responsible for providing oversight and direction on insurance risk exposures facing the Company and to ensure that effective insurance risk management practices and controls are in place. This includes reviewing the current and emerging insurance risk profile; engaging in review of topical insurance, reinsurance, underwriting, claims and medical risk issues; and reviewing and recommending changes to the insurance risk appetite measurement methodology.
Accountabilities
Primary accountability for risk management is delegated by the Board to our Chief Executive Officer ("CEO"). The CEO further delegates responsibilities throughout the Company through management authorities and responsibilities. The CEO delegates accountability for the various classes of risk management to our executive officers, who are accountable for ensuring that the management of risk in the scope of their business accountability is in accordance with the Board approved Risk Framework, Risk Appetite Policy and risk management frameworks and policies.
3. Risk Universe
As a large financial services organization operating in a complex industry, the Company encounters a variety of risks. We face risks in formulating our business strategy and business objectives, in carrying on our business activities in the pursuit of our strategy and objectives, and from external factors. The Risk Framework structures key and emerging risks into a robust, global risk taxonomy comprised of six categories: business and strategic, credit, market, liquidity, insurance and operational risks. The Risk Framework sets out the core processes used to identify, measure, manage, monitor and report risks. The Risk Framework sets out both qualitative and quantitative measures and processes to control the risk the Company will bear in respect of each of these categories of risk and in aggregate.
4. Risk Appetite
Our Risk Appetite Policy defines the amount and type of risk we are willing to accept in pursuit of our business objectives, and is approved by the Board. It is forward-looking and our Strategic Plan, Capital Plan, Business Plan and business objectives are established within its boundaries.
The Company's risk appetite seeks to balance the various needs, expectations, risk and reward perspectives and investment horizons of all stakeholders. In particular, our risk appetite supports the pursuit of shareholder value while ensuring that the Company's ability to pay claims and fulfill policyholder and Client commitments is not compromised.
Our risk appetite is the primary mechanism for operationalizing our risk philosophy and the boundaries of permissible risk-taking across the enterprise. Our risk appetite supports the objective of maintaining adequate capital, managing earnings volatility, managing operational risk
54 December 31, 2024 Sun Life Financial Inc. MANAGEMENT'S DISCUSSION & ANALYSIS
and managing liquidity. To accomplish this, our risk appetite includes a wide array of qualitative and quantitative standards that reflect the Company's overall risk management principles and values.
We are generally comfortable accepting diversifiable risks where we are capable of using risk pooling to create liability portfolios with relatively low volatility. We take risk where we have internal expertise such as actuarial, underwriting, claims management, investment, risk management and distribution or where reinsurance partners are able to supplement our internal expertise. We prefer risks that arise across various dimensions, including products, geographies (intra-national and international), distribution channels and asset classes in order to maximize diversification benefits.
Our Risk Appetite Policy sets out multiple constraints which define the aggregate level of risk that the Company is willing to accept. We translate our risk appetite constraints into specific risk limits by risk class and business segment. Our risk profile is measured, managed and monitored regularly to ensure that we operate within our risk appetite. Our risk appetite limits are revised periodically to reflect the risks and opportunities inherent in our evolving business strategies and operating environment.
5. Risk Management Policies
In order to support the effective communication, implementation and governance of our Risk Framework, we have codified our processes and operational requirements into a comprehensive series of risk management frameworks, policies and operating guidelines. These frameworks, policies and guidelines promote the application of a consistent approach to managing risk exposures across our global business platform. The Board and Board Committees regularly review and approve significant changes to risk management frameworks and policies and regularly review management's reporting and attestation on compliance to these frameworks and policies.
6. Risk Management Process
All business segments employ a common approach to identify, measure, manage, monitor and report risks. The risk management process as set out in our Risk Framework is described below:
Risk Identification
Business segments have accountability for identifying and managing risks facing their business. We have a process to identify and monitor key and emerging risks that may have a material impact on our finances, operations or reputation. We evaluate potential correlations and inter-connections between various risk events and categories, and monitor key and emerging risks, emerging regulatory and rating agency requirements, or industry developments and various research reports.
Risk Measurement
Risk measurement involves determining and evaluating potential risk exposures and includes a number of techniques, including:
•Key risk indicators
•Probability-severity assessments
•Stress testing (including sensitivity and scenario analysis)
•Reverse stress testing
•Stochastic modelling
Risk measures are expressed in quantitative and qualitative terms.
A robust stress testing program forms an essential component of the Company's risk management program used to measure, monitor, understand and mitigate the Company's risk exposures and to ensure ongoing capital adequacy under plausible stress events. Stress testing is performed on key metrics such as earnings, regulatory capital ratios and liquidity to identify and monitor potential vulnerabilities to key risk drivers and ensure that the Company is operating within its risk appetite.
We develop and test a range of scenarios based on our internal assessment and regulatory guidance. Emerging risks are one of the inputs to determine stress test scenarios.
•Sensitivity testing is conducted on a regular basis and measures the earnings and regulatory capital and liquidity impacts from changes in underlying risk factors, assuming that there are no changes to any of the other risk factors. Sensitivity testing is performed for individual risks and for consolidated risk exposures at different levels of stress and at various levels of aggregation.
•Scenario testing involves changes to a number of risk factors to assess the impact of and interaction between these risk factors. These scenarios include integrated scenario testing, reverse scenario testing and key assumption sensitivity testing.
•Financial Condition Testing ("FCT"), as prescribed by the Canadian Institute of Actuaries, is used to satisfy requirements under the Canadian insurance Company Act, and OSFI regulations. Through stress testing selected adverse scenarios, the main objectives of FCT is to identify possible threats to our financial condition and the corrective management actions to mitigate those threats.
Risk Management
Risk management decisions are formed by evaluating whether the assessed risk for a business activity aligns with our risk appetite and meets the objective of risk-adjusted returns.
Risk Monitoring
Monitoring processes include oversight by the Board, which is exercised through Board Committees and Senior Management committees described in the Risk Governance and Accountabilities section in this document.
MANAGEMENT'S DISCUSSION & ANALYSIS Sun Life Financial Inc. December 31, 2024 55
Risk Reporting
At least on a quarterly basis, the Senior Management committees, Board Committees and the Board review reports that summarize our risk profile against the Board approved risk appetite, including the exposures across our principal risks, any changes in risk trends, forward-looking view of risks and emerging risks. These committees also review the effectiveness of the risk management strategies presented in the reports. On a regular basis, the Board and the Board Committees review and approve any significant changes to risk management frameworks and policies for the management of risk and review compliance with these frameworks and policies.
7. Three Lines of Defence
The Company’s risk governance allocates accountability and functional responsibilities through the adoptions of the Three Lines of Defence (“LOD”) model to ensure appropriate oversight. This segregation of responsibility helps to establish a robust control framework that promotes transparent and independent challenge of all risk-taking activities, and that encourages all functions to engage in self-critical examination to foster continuous improvement of the management of risk in our business.
The first LOD is represented by the business segment management who own the risks that are intrinsic to the business and have the primary responsibility to identify, measure, manage, monitor and report these risks. Some of the first LOD risk related responsibilities include:
•Identification of key and emerging risks;
•Manage, measure, monitor and report on risk within their business operations;
•Accountability for business results and the risks taken to achieve business results and the resulting impact of those risks; and
•Operating within risk appetite and according to risk management frameworks and policies;
•Cultivating a strong risk corporate culture.
The second LOD includes the Chief Risk Officer ("CRO") and heads of the oversight functions who are responsible for providing independent oversight of our Company-wide risk management programs. The CRO is responsible for developing our Risk Framework and Risk Appetite Policy, and for overseeing the development and implementation of risk management strategies aimed at optimizing the risk-return profile of the Company. The CRO is supported by a network of business segment risk officers. The functional heads support the CRO in the implementation and communication of our Risk Framework and Risk Appetite Policy. Some of the key second LOD risk related responsibilities include:
•Establishment of the risk management framework and policies;
•Providing oversight and effective independent challenge of first LOD; and
•Independent reporting to Senior Management committees and the Board of Directors on the level of risk against risk appetite.
The third LOD responsibilities are distinct from first and second LOD responsibilities. The Internal Audit function is the third LOD and is responsible for providing independent assurance to Senior Management and the Board and/or Board Committees on the design and operational effectiveness of the risk management practices and internal controls carried out by first LOD and second LOD. Internal Audit provides a quarterly opinion on the effectiveness of internal controls, risk management and governance processes to the Audit Committee of the Board. In addition, the Risk Committee may engage third-party independent reviews to supplement the third LOD review of the effectiveness of the Company's risk management programs.
8. Culture and Philosophy
We have built a strong corporate culture reflected in our core values of being Caring, Authentic, Bold, Inspiring and Impactful. These values set the tone and guide our high business standards, integrity and ethical behaviour, respect, and commitment to doing the right thing for our Clients.
The Board establishes the "tone from the top" and is accountable to ensure that the CEO and Senior Management create and sustain a culture of integrity throughout the organization. We work together through our focus on long-term, sustainable and resilient thinking to maximize our positive impact and ensure the resiliency of our organization, in support of our Purpose of helping our Clients to achieve lifetime financial security and to live healthier lives.
A key premise of our culture management framework is that everyone has an important role to play in preserving and enhancing our culture, which includes managing the Company’s risks. In order to support employees in fulfilling their role in managing the Company's risks, we have taken action to ensure our risk protocols and procedures are well defined and embedded in our day-to-day business activities, assess that appropriate resources and training are provided, establish and communicate a common risk philosophy and a high bar for integrity and conduct, and encourage every employee to openly identify risk exposures and communicate escalating risk concerns. The following elements support our culture:
•Setting core values to guide decision making
•Establishing tone from the top;
•Encouraging transparency in risk-taking;
•Performing effective challenge in conducting business decisions;
•Aligning incentives and risk management practices;
•Effectively communicating culture expectations;
•Establishing clear accountabilities; and
•Promoting ongoing resiliency
Risk Management is embedded in the enterprise's culture, which encourages ownership and responsibility for risk management at all levels. Our compensation programs are aligned to the organization's risk management practices through our governance structure for the design and approval of incentive compensation plans and processes used to support the alignment of compensation and risk management. We continuously reinforce and embed the accountability for risk management through communication and training on risk management at various forums and across various levels through training on the Code of Conduct annually, reinforcing accountability through performance reviews and compensation, continually monitoring processes and outcomes that drive expected behaviours, and through defining roles, responsibilities and expectations in the risk management frameworks and policies.
56 December 31, 2024 Sun Life Financial Inc. MANAGEMENT'S DISCUSSION & ANALYSIS
The Company's risk philosophy includes the following core principles:
Strategic Alignment
Our corporate strategy and business objectives are required to be established within the boundaries and prescriptions set out in the Risk Framework and the Risk Appetite Policy. This requires us to consider whether a business activity, intended to achieve the business and financial objectives, will result in a risk profile that we are willing to accept and which we are prepared to manage. We have established a range of explicit risk appetite constraints that we apply to all acceptable risks. Business and strategic risk is managed through our strategic and business planning process and through controls over the implementation of these Strategic and Business Plans. Risks associated with activities outside our risk appetite or outside the acceptable defined risks are avoided.
Capital and Liquidity Management
Maintaining adequate capital is essential to the continued operations of the Company and Subsidiaries. We assess and forecast capital adequacy on an on-going basis to operate in a safe and sound manner and to maintain adequate capital in relation to the risks associated with our business activities and strategy. Capital adequacy is assessed across all our businesses using the annual strategy and business planning processes and the annual ORSA process and is monitored on a regular basis. The level of capital adequacy risk accepted by the Company and Subsidiaries is required to be prudent and consistent with the principles, frameworks and policies outlined in the Risk Management Framework and Risk Appetite Policy. Capital adequacy risk is mitigated through adherence to risk management frameworks, policies and processes.
Maintaining adequate liquidity is critical to the protection of our policyholders, Clients and creditors and to maintaining ratings and access to capital markets.
Client and Other Stakeholder Interests
Our Risk Appetite Policy considers the interests of a large number of key stakeholders, including Clients, shareholders, debt-holders, employees, regulators, distributors, rating agencies and other capital markets participants. The policy prescribes how to balance the needs, expectations, risk and reward perspectives, and investment horizons of these different stakeholders. The Business Plans and business strategies are independently tested validated to ensure that they operate within the boundaries and requirements set out in the Risk Framework and the Risk Appetite Policy, and the results of this testing validation are reported to the Board.
Effective risk management requires that objectives and incentives be aligned to ensure management's decisions are consistent with the Company's risk philosophy and risk appetite. Compensation programs for employees are approved by the Board and the Board Committees and are aligned with the Company's risk philosophy, values, business and risk management strategies, and the long-term interests of stakeholders. In establishing annual performance objectives, we consider risk management goals to ensure that business decisions are consistent with the desired risk and return profile of the Company.
Capability Alignment
We seek out profitable risk-taking opportunities in those areas where we have established risk management skills and capabilities. Conversely, we endeavour to avoid or transfer risks that are beyond our risk-taking capability. Our ability to measure and evaluate risks, the quality of our risk governance and control environment, the depth and quality of our risk responses and the robustness of our pricing strategies are particularly important capabilities that we assess.
Portfolio Perspective
In evaluating a particular risk, consideration is given to a portfolio perspective of risk and return including the explicit recognition of the impacts of diversification and concentration and how different risks interact with each other. This perspective is extended to the development of risk mitigation and pricing strategies, recognizing that often the most cost-effective way of managing risk involves utilizing available relationships already inherent in our businesses.
Risk-Adjusted Returns
Financial return metrics used to assess business activities are developed in consideration of the constraints set out in the Risk Appetite Policy, and reflect the expected costs of mitigation and the cost of risk capital required to support the risk taking activity.
Understanding and Managing Uncertainties
While many risks are relatively well understood and measurable, there are risks that do not lend themselves to traditional metrics. We refer to these as “uncertainties”. These include geopolitical and environmental risks which are difficult to quantify and can have widespread contagion effects. It is important for the organization to not just analyse risks in silos but anticipate and prepare for uncertain events given the potential spillover of impacts onto other related risks. Rigorous and thoughtful table-top exercises should be convened as appropriate to understand the potential impacts and ramifications of plausible risk uncertainties and implement resiliency strategies.
Organizational Resilience
With various external challenges and increasing threats, it is key for the organization to maintain and enhance resiliency as a best practice. The capability to adapt in ever-changing conditions and a commitment to taking a resilient approach, are crucial in managing key vulnerabilities and delivering objectives in the face of business disruptions.
MANAGEMENT'S DISCUSSION & ANALYSIS Sun Life Financial Inc. December 31, 2024 57
Culture
Culture is the sum of the shared assumptions, values and beliefs that create the unique character of an organization. Our culture encourages behaviour aligned with goals for long-term value creation. It defines the appropriate behaviour for any given situation, governs the interaction with Clients and affects how employees identify with the organization. Our culture has significant potential to impact our risk profile. An organization's culture impacts its ability to create value and to protect value. Maintaining the right balance of risk-taking and risk control activities is a key organizational capability and fundamental to our long-term sustainable success.
Long-Term, Sustainable and Resilient
Our risk philosophy addresses the Company’s material economic, environmental and social impacts, and the opportunities and risks they present in delivering long-term value to the key stakeholders for the Company. We aspire to maximize our positive impact and ensure the resilience of our organization, in support of our Purpose of helping Clients achieve lifetime financial security and live healthier lives. Frameworks, policies, processes and controls are in place to identify and effectively manage significant risks to which we are exposed while operating within the Risk Appetite Policy.
9. Risk Categories
The text and tables in the following section of this MD&A include our disclosure on credit, market and liquidity risks in accordance with IFRS 7 Financial Instruments - Disclosures ("IFRS 7") and IFRS 17 Insurance Contracts, as well as a discussion on how we measure risk and our objectives, policies and methodologies for managing these risks. Disclosures in accordance with IFRS 7 and IFRS 17 are identified by a vertical line in the left margin of the page. The fact that certain text and tables are identified with a vertical line does not imply that these disclosures are of any greater importance than any other text or tables, and the Risk Management disclosure should be read in its entirely.
The disclosures in the Risk Management section of this document should be considered carefully together with other information in this MD&A and in the 2024 AIF, our Consolidated Financial Statements and other reports and materials that we file with securities regulators.
In this section, segregated funds include segregated fund guarantees, variable annuities and investment products, and includes Run-off reinsurance in U.S. IFM.
Our Risk Framework groups all risks into six major risk categories: market, insurance, credit, business and strategic, operational and liquidity risks.
i. Market Risk Risk Description We are exposed to market risk, which is defined as the risk that the value or future cash flows of insurance and investment contract liabilities or financial assets will fluctuate because of changes or volatility in market prices. Market risk includes equity, interest rate and spread, real estate, foreign currency, and inflation risks. Market Risk Management Governance and Control We employ a wide range of market risk management practices and controls as outlined below: •Market risk governance practices are in place, including independent monitoring and review and reporting to senior management and the Risk Committee. •Income and regulatory capital sensitivities are monitored, managed, and reported against pre-established risk appetite limits for equity, interest rate, credit spread, real estate and foreign currency risks. •Comprehensive asset-liability management and hedging policies, programs and practices are in place. •Regulatory solvency requirements include risk-based capital requirements and are monitored regularly. •Product Design and Pricing Policy requires a detailed risk assessment and pricing provisions for material risks. •Stress-testing techniques, such as FCT, are used to measure the effects of large and sustained adverse market movements. •Insurance contract liabilities are established in accordance with IFRS. •Internal capital targets are established at an enterprise level to cover all risks and are above minimum regulatory and supervisory levels. Actual capital levels are monitored to ensure they exceed internal targets. Specific market risks and our risk management strategies are discussed below in further detail. | |||||
Equity Risk Equity risk is the potential for financial loss arising from declines or volatility in public or private equity market prices. We are exposed to equity risk from a number of sources. We generate revenue in our asset management businesses and from certain protection and wealth contracts where fees are levied on account balances that are affected directly by equity market levels. Accordingly, we have further exposure to equity risk as adverse fluctuations in the market value of such assets will result in corresponding adverse impacts on revenue, income, the contractual service margin, and capital. In addition, declining and volatile equity markets may have a negative impact on sales and redemptions (surrenders) in these businesses, and this may result in further adverse impacts on net income, the contractual service margin, and capital. | |||||
58 December 31, 2024 Sun Life Financial Inc. MANAGEMENT'S DISCUSSION & ANALYSIS
A portion of our exposure to equity risk arises in connection with benefit guarantees on segregated fund products, some participating insurance contracts, some adjustable insurance contracts, and some universal life contracts. These benefit guarantees may be triggered upon death, maturity, withdrawal or annuitization. The cost of providing these guarantees is uncertain and depends upon a number of factors, including general capital market conditions, our hedging strategies, policyholder behaviour and mortality experience, each of which may result in negative impacts on net income, the contractual service margin, and capital. We also have direct exposure to equity markets from the investments supporting other general account liabilities, surplus, and employee benefit plans. These exposures fall within our risk-taking philosophy and appetite, and are therefore generally not hedged. | |||||
Interest Rate and Spread Risk Interest rate and spread risk includes the potential for financial loss arising from changes in the value of insurance and investment contract liabilities and financial assets due to changes or volatility in interest rates or spreads. In practice, when asset cash flows and the policy obligations they support are not matched, this may result in the need to either sell assets to meet policy payments and expenses or reinvest excess asset cash flows in unfavourable interest rate or credit spread environments. This risk is managed in our asset-liability management program. Details of the asset-liability management program are discussed under the heading "Market Risk Management Strategies" in section K - Risk Management in this document. Our primary exposure to interest rate and spread risk arises from insurance and investment contracts that contain guarantees in the form of minimum crediting rates, maximum premium rates, settlement options, guaranteed annuitization options and minimum benefits. If investment returns fall below guaranteed levels, we may be required to increase liabilities or capital in respect of these contracts. The guarantees attached to these products may be applicable to both past premiums collected and future premiums not yet received. Segregated fund contracts provide benefit guarantees that are linked to underlying fund performance and may be triggered upon death, maturity, withdrawal or annuitization. Exposure to guarantees is managed within our risk appetite limits through our asset-liability management program, which may include the use of hedging strategies utilizing interest rate derivatives such as interest rate floors, swaps, futures and swaptions. The impact of these guarantees on net income, contractual service margin, and capital are included in the disclosed market risk sensitivities. Significant changes or volatility in interest rates or spreads could have a negative impact on sales of certain protection and wealth products, and adversely impact the expected pattern of redemptions (surrenders) on existing policies. •Increases in interest rates or widening credit spreads may increase the risk that policyholders will surrender their contracts, potentially forcing us to liquidate assets at a loss. While we have established hedging programs in place and our protection and wealth products often contain surrender mitigation features, these may not be sufficient to fully offset the adverse impact of changes in interest rates or spreads. •Declines in interest rates or narrowing spreads can result in compression of the net spread between interest earned on investments and interest credited to policyholders, increased asset calls, mortgage and structured security prepayments, and net reinvestment of positive cash flows at lower yields, and therefore can adversely impact our profitability and financial position. •Negative interest rates may additionally result in losses on our cash and short-term deposits and low or negative returns on our fixed income assets impacting our profitability. •A sustained low interest rate environment may additionally adversely impact our net income, CSM, capital, and our ability to implement our business strategy and plans. This may be realized through lower sales, less profitable new business, changes in the pattern of redemptions on existing policies, among other impacts. We also have direct exposure to interest rates and spreads from investments supporting other general account liabilities, surplus and employee benefit plans. Higher interest rates or wider spreads will reduce the value of our existing assets. Conversely, lower interest rates or a narrowing of spreads will result in reduced investment income on new fixed income asset purchases. These exposures fall within our risk-taking philosophy and appetite and are therefore generally not hedged. Real Estate Risk Real estate risk is the potential for financial loss arising from fluctuations in the value of, or future cash flows from, our investments in real estate. We are exposed to real estate risk and may experience financial losses resulting from the direct ownership of real estate investments or indirectly through fixed income investments secured by real estate property, leasehold interests, ground rents, and purchase and leaseback transactions. Real estate price risk may arise from external market conditions, inadequate property analysis, inadequate insurance coverage, inappropriate real estate appraisals, or from environmental risk exposures. We hold real estate investments that support general account liabilities and surplus, and fluctuations in value will affect our net income, CSM, and capital. A material and sustained increase in interest rates may lead to deterioration in real estate values. | |||||
MANAGEMENT'S DISCUSSION & ANALYSIS Sun Life Financial Inc. December 31, 2024 59
Foreign Currency Risk Foreign currency risk is the result of mismatches in the currency of our assets and liabilities (inclusive of capital), and cash flows. This risk may arise from a variety of sources such as foreign currency transactions and services, foreign currency hedging, investments denominated in foreign currencies, investments in foreign subsidiaries and net income from foreign operations. Changes or volatility in foreign exchange rates, including a change to currencies that are fixed in value to another currency, could adversely affect our net income, contractual service margin and capital. As an international provider of financial services, we operate in a number of countries, with revenues and expenses denominated in several local currencies. In each country in which we operate, we generally maintain the currency profile of assets to match the currency of liabilities and required capital. This approach provides an operational hedge against disruptions in local operations caused by currency fluctuations. Foreign currency derivative contracts such as currency swaps and forwards are used as a risk management tool to manage the currency exposure in accordance with our Asset Liability Management Policy. As at December 31, 2024 and December 31, 2023, the Company did not have a material foreign currency risk exposure. Changes in exchange rates can affect our net income and surplus when financial results in functional currencies are translated into Canadian dollars. Net income earned outside of Canada is generally not currency hedged and a weakening in the local currency of our foreign operations relative to the Canadian dollar can have a negative impact on our net income reported in Canadian currency. A strengthening in the local currency of our foreign operations relative to the Canadian dollar would have the opposite effect. Regulatory capital ratios could also be impacted by changes in exchange rates. | |||||
Inflation Risk Inflation risk is the potential for financial loss arising from changes in inflation rates. This risk results from insurance contract liabilities that are linked to market measures of inflation such as the Consumer Price Index. The primary sources for this risk exposure are from certain group and retail annuity contracts and group long term disability contracts. In these contracts, the annuity and disability benefit payments may be linked to an indexing formula containing an inflation price index. Benefit payments linked to inflation indices may also include various caps, floors and averaging mechanisms that vary across product designs. Exposure to inflation risk is managed within our asset-liability management program, primarily by investing in inflation linked assets to match liability exposures. | |||||
The impact of inflation on general account expenses is discussed under the heading "Expense Risk" in section K - Risk Management in this document.
Market Risk Sensitivities | |||||
We utilize a variety of methods and measures to quantify our market risk exposures. These include duration management, key rate duration techniques, convexity measures, cash flow gap analysis, scenario testing, and sensitivity testing of earnings and regulatory capital ratios versus risk appetite limits. The measurement of liabilities and assets are affected by the level of equity market performance, interest rates, credit and swap spreads and other market risk variables. The following sections set out the estimated immediate impact on, or sensitivity of, our net income(1), contractual service margin, OCI and SLF Inc.'s LICAT ratio to certain instantaneous changes in market variables as at December 31, 2024 and December 31, 2023. The estimated sensitivities in the tables below reflect the impact of market movements on insurance contracts and investment contracts, assets backing insurance contracts, assets backing investment contracts, assets backing the surplus segment, and seed investments in our asset management subsidiaries. Net income sensitivities to equity and real estate market movements are driven primarily by changes in the value of investments backing general account liabilities and surplus. Net income sensitivities to interest rates and spreads are driven by the net impact on liabilities and the assets backing them. Lower interest rates or a narrowing of spreads will result in increased liabilities for insurance contracts, offset by increased values of the assets backing general liabilities. Higher interest rates or a widening of spreads will result in decreased liabilities for insurance contracts, offset by decreased values of the assets backing general account liabilities. Further detail on the impact of changes or volatility in market prices on assets and liabilities is provided under the headings "Equity Risk", "Interest Rate and Spread Risk", and "Real Estate Risk" above. OCI sensitivities are impacted by changes in the market value of assets classified as FVOCI. The market value of FVOCI fixed income assets, which are held primarily backing surplus, investment contracts and CSM liabilities, increases with lower interest rates or a narrowing of spreads, and decreases with higher interest rates or widening of spreads. As these market risk sensitivities reflect an instantaneous impact on net income, CSM, OCI and SLF Inc.'s LICAT ratio, they do not include impacts over time such as the effect on fee income in our asset management businesses. Refer to Additional Cautionary Language and Key Assumptions Related to Sensitivities in this section for important additional information regarding these estimates. | |||||
(1)Net income in section K - Risk Management in this document refers to common shareholders' net income. | |||||||||||||||||
60 December 31, 2024 Sun Life Financial Inc. MANAGEMENT'S DISCUSSION & ANALYSIS
Private and Public Equity Market Sensitivities
The following table sets out the estimated immediate impact on, or sensitivity of, our net income, CSM, OCI and SLF Inc.'s LICAT ratio to certain instantaneous changes in public or private equity market prices as at December 31, 2024 and December 31, 2023. The sensitivities shown outline the impact of the same percentage increase or decrease applied to each of private equity and public equity. About 60% of our expected net income sensitivity to changes in equity markets is driven by investments in private equity.
($ millions, unless otherwise noted) | As at December 31, 2024 | ||||||||||||||||||||||||||||
Change in Private and Public Equity Markets(1)(2)(3) | 25% decrease | 10% decrease | 10% increase | 25% increase | |||||||||||||||||||||||||
Potential impact on net income (after-tax) | (550) | (225) | 225 | 575 | |||||||||||||||||||||||||
| Potential impact on CSM (pre-tax) | (775) | (300) | 275 | 650 | |||||||||||||||||||||||||
Potential impact on OCI(4) | — | — | — | — | |||||||||||||||||||||||||
Potential impact on LICAT ratio(5) | 2.0% point decrease | 0.5% point decrease | 0.5% point increase | 1.0% point increase | |||||||||||||||||||||||||
| ($ millions, unless otherwise noted) | As at December 31, 2023 | ||||||||||||||||||||||||||||
Change in Private and Public Equity Markets(1)(2)(3) | 25% decrease | 10% decrease | 10% increase | 25% increase | |||||||||||||||||||||||||
Potential impact on net income (after-tax) | (400) | (175) | 175 | 425 | |||||||||||||||||||||||||
| Potential impact on CSM (pre-tax) | (625) | (250) | 250 | 600 | |||||||||||||||||||||||||
Potential impact on OCI(4) | — | — | — | — | |||||||||||||||||||||||||
Potential impact on LICAT ratio(5) | 3.0% point decrease | 1.0% point decrease | 1.0% point increase | 2.5% point increase | |||||||||||||||||||||||||
(1)Represents the respective change across all equity exposures as at December 31, 2024 and December 31, 2023. Due to the impact of active management, basis risk, and other factors, realized sensitivities may differ significantly from expectations. Sensitivities include the impact of re-balancing equity hedges for hedging programs at 2% intervals (for 10% changes in equity markets) and at 5% intervals (for 25% changes in equity markets). (2)The market risk sensitivities include the estimated impact of our hedging programs in effect as at December 31, 2024 and December 31, 2023, and include new business added and product changes implemented prior to such dates. (3)Net income, CSM and OCI sensitivities have been rounded in increments of $25 million. The sensitivities exclude the market impacts on the income from our joint ventures in China and India. | |||||||||||||||||||||||||||||
(4) The market risk OCI sensitivities exclude the impact of changes in the defined benefit obligations and plan assets. (5)The LICAT sensitivities illustrate the impact on SLF Inc. as at December 31, 2024 and December 31, 2023. LICAT ratios are rounded in increments of 0.5%. | |||||||||||||||||||||||||||||
MANAGEMENT'S DISCUSSION & ANALYSIS Sun Life Financial Inc. December 31, 2024 61
Interest Rate Sensitivities
The following table sets out the estimated immediate impact on, or sensitivity of, our net income, CSM, OCI and SLF Inc.'s LICAT ratio to certain instantaneous changes in interest rates as at December 31, 2024 and December 31, 2023. | |||||||||||||||||||||||||||||
| ($ millions, unless otherwise noted) | As at December 31, 2024 | As at December 31, 2023 | |||||||||||||||||||||||||||
Change in Interest Rates(1)(2)(3) | 50 basis point decrease | 50 basis point increase | 50 basis point decrease | 50 basis point increase | |||||||||||||||||||||||||
Potential impact on net income (after-tax) | (50) | 25 | (25) | 50 | |||||||||||||||||||||||||
| Potential impact on CSM (pre-tax) | 150 | (150) | 75 | (75) | |||||||||||||||||||||||||
Potential impact on OCI(4) | 200 | (200) | 200 | (200) | |||||||||||||||||||||||||
Potential impact on LICAT ratio(5) | 2.5% point increase | 2.0% point decrease | 1.5% point increase | 1.5% point decrease | |||||||||||||||||||||||||
(1)Interest rate sensitivities assume a parallel shift in assumed interest rates across the entire yield curve as at December 31, 2024 and December 31, 2023 with no change to the ultimate risk-free rate. Variations in realized yields based on factors such as different terms to maturity and geographies may result in realized sensitivities being significantly different from those illustrated above. Sensitivities include the impact of re-balancing interest rate hedges for hedging programs at 10 basis point intervals (for 50 basis point changes in interest rates). (2)The market risk sensitivities include the estimated impact of our hedging programs in effect as at December 31, 2024 and December 31, 2023, and include new business added and product changes implemented prior to such dates. (3)Net income, CSM and OCI sensitivities have been rounded in increments of $25 million. The sensitivities exclude the market impacts on the income from our joint ventures in China and India. (4)The market risk OCI sensitivities exclude the impact of changes in the defined benefit obligations and plan assets. | |||||||||||||||||||||||||||||
(5)The LICAT sensitivities illustrate the impact on SLF Inc. as at December 31, 2024 and December 31, 2023. The sensitivities reflect the worst scenario as at December 31, 2024 and assume that a scenario switch does not occur in the quarter. LICAT ratios are rounded in increments of 0.5%. | |||||||||||||||||||||||||||||
The above sensitivities were determined using a 50 basis point change in interest rates and 10% and 25% changes in our equity markets because we believe that these market shocks were reasonably possible as at December 31, 2024. Significant changes in market variables may result in other than proportionate impacts on our sensitivities. | |||||||||||||||||||||||||||||
Potential Impact of Change in Ultimate Risk-Free Rate
Interest rate sensitivities do not include any impact from changes to the ultimate risk-free rate. Our estimated sensitivity to a 10 basis point decrease in the ultimate risk-free rate assumed in our insurance contract liabilities is a decrease in reported net income of approximately
$50 million after-tax, and a decrease in CSM of approximately $25 million.
$50 million after-tax, and a decrease in CSM of approximately $25 million.
Credit Spread and Swap Sensitivities | |||||
| The following tables set out the estimated immediate impact on, or sensitivity of, our net income, CSM, OCI and SLF Inc.'s LICAT ratio to certain instantaneous changes in credit spreads and our net income, CSM, and OCI to certain changes in swap spreads as at December 31, 2024 and December 31, 2023. | |||||
| ($ millions, unless otherwise noted) | As at December 31, 2024 | As at December 31, 2023 | |||||||||||||||||||||||||||
Change in Credit Spreads(1)(2) | 50 basis point decrease | 50 basis point increase | 50 basis point decrease | 50 basis point increase | |||||||||||||||||||||||||
Potential impact on net income (after-tax) | 75 | (50) | 50 | (50) | |||||||||||||||||||||||||
| Potential impact on CSM (pre-tax) | 125 | (125) | 75 | (25) | |||||||||||||||||||||||||
Potential impact on OCI(3) | 200 | (200) | 200 | (175) | |||||||||||||||||||||||||
Potential impact on LICAT ratio(4) | 2.0% point increase | 2.0% point decrease | 1.0% point increase | 1.0% point decrease | |||||||||||||||||||||||||
(1)The credit spread sensitivities assume a parallel shift in the indicated spreads across the entire term structure with no change to the ultimate liquidity premium. The sensitivities reflect a floor of zero on credit spreads where the spreads are not currently negative. Variations in realized spread changes based on different terms to maturity, geographies, asset classes and derivative types, underlying interest rate movements, and ratings may result in realized sensitivities being significantly different from those provided above. (2)Net income, CSM, and OCI sensitivities have been rounded in increments of $25 million. The sensitivities exclude the market impacts on the income from our joint ventures in China and India. (3)The market risk OCI sensitivities exclude the impact of changes in the defined benefit obligations and plan assets. | |||||||||||||||||||||||||||||
(4)The LICAT sensitivities illustrate the impact on SLF Inc. as at December 31, 2024 and December 31, 2023. The sensitivities reflect the worst scenario as of December 31, 2024 and assume that a scenario switch does not occur in the quarter. LICAT ratios are rounded in increments of 0.5%. | |||||||||||||||||||||||||||||
62 December 31, 2024 Sun Life Financial Inc. MANAGEMENT'S DISCUSSION & ANALYSIS
| ($ millions, unless otherwise noted) | As at December 31, 2024 | As at December 31, 2023 | |||||||||||||||||||||||||||
Change in Swap Spreads(1)(2) | 20 basis point decrease | 20 basis point increase | 20 basis point decrease | 20 basis point increase | |||||||||||||||||||||||||
Potential impact on net income (after-tax) | (25) | 25 | (25) | 25 | |||||||||||||||||||||||||
(1)The swap spread sensitivities assume a parallel shift in the indicated spreads across the entire term structure. Variations in realized spread changes based on different terms to maturity, geographies, asset classes and derivative types, underlying interest rate movements, and ratings may result in realized sensitivities being significantly different from those provided above. (2)Net income, CSM, and OCI sensitivities have been rounded in increments of $25 million. The sensitivities exclude the market impacts on the income from our joint ventures in China and India. | |||||||||||||||||||||||||||||
Real Estate Sensitivities
The following table sets out the estimated immediate impact on, or sensitivity of, our net income, OCI and CSM to certain instantaneous changes in the value of our real estate investments as at December 31, 2024 and December 31, 2023.
| ($ millions, unless otherwise noted) | As at December 31, 2024 | As at December 31, 2023 | |||||||||||||||
Change in Real Estate Values (1) | 10% decrease | 10% increase | 10% decrease | 10% increase | |||||||||||||
| Potential impact on net income (after-tax) | (450) | 450 | (475) | 475 | |||||||||||||
| Potential impact on CSM (pre-tax) | (100) | 100 | (100) | 100 | |||||||||||||
(1)Net income, CSM, and OCI sensitivities have been rounded in increments of $25 million. The sensitivities exclude the market impacts on the income from our joint ventures in China and India. | |||||||||||||||||
LICAT Interest Rate Scenario Switch
The LICAT interest rate risk is assessed under four different interest rate scenarios, and the scenario leading to the highest capital requirement is chosen as the worst scenario for each geographic region as defined by the LICAT guideline. Changes and interaction between the level and term movements in interest rates and credit spreads can shift the interest rate scenario applied in the LICAT calculation causing a discontinuity where capital requirements change materially. In 2020, OSFI updated the LICAT guideline for interest rate risk requirements for participating businesses to be smoothed over six quarters. As a result, the actual impact to the LICAT ratio from participating businesses in any quarter will reflect the scenarios from current quarter as well as the prior five quarters and switching between the scenarios would have the effect of offsetting the previous impacts over time. It should be noted that switching of the scenario can also change the direction of our sensitivities.
For SLF Inc., assuming no further scenario switches, no additional LICAT ratio impact is expected over the next five quarters.
For Sun Life Assurance, assuming no further scenario switches, the remaining impact of one-half percentage point is expected to increase the LICAT ratio over the next five quarters.
Market Risk Management Strategies
Market risk is managed at all stages during the product life cycle including product design and development, ongoing review and positioning of our suite of products, and ongoing asset-liability management and hedge re-balancing. Our market risk management strategies are developed based on policies and operating guidelines at the enterprise level, business segment level and product level. Liabilities having a similar risk profile are grouped together and a customized investment and hedging strategy is developed and implemented to optimize return within our risk appetite limits.
We have implemented asset-liability management and hedging programs involving regular monitoring and adjustment of market risk exposures using assets, derivative instruments and repurchase agreements to maintain market risk exposures within our risk appetite. The general availability and cost of these hedging instruments may be adversely impacted by a number of factors including changes in interest rates, increased volatility in capital markets, and changes in the general market and regulatory environment within which these hedging programs operate. In particular, regulations for derivatives could impose additional costs and could affect our hedging strategy. | ||||||||||||||
Our hedging programs may themselves expose us to other risks, including basis risk, volatility risk, and increased levels of derivative counterparty credit risk, liquidity risk, model risk and other operational risks. These factors may adversely impact the net effectiveness, costs, and financial viability of maintaining these hedging programs and therefore adversely impact our profitability and financial position. While our hedging programs are intended to mitigate these effects (e.g., hedge counterparty credit risk is managed by maintaining broad diversification, dealing primarily with highly-rated counterparties, and transacting through over-the-counter ("OTC") contracts cleared through central clearing houses, exchange-traded contracts or bilateral OTC contracts negotiated directly between counterparties that include credit support annexes), residual risk, potential reported earnings and capital volatility remain.
In general, market risk exposure is mitigated by the assets supporting our products. This includes holdings of fixed income assets such as bonds, mortgages and loans. Derivative instruments may supplement these assets to reduce the risk from interest rate mismatches and mitigate the market risk associated with liability features and optionality.
MANAGEMENT'S DISCUSSION & ANALYSIS Sun Life Financial Inc. December 31, 2024 63
General Account Protection and Wealth Products
Most of our expected net income sensitivity to changes in interest rates and equity markets is derived from our general account protection and wealth products. We have implemented market risk management strategies to mitigate a portion of the market risk related to our general account protection and wealth products.
Individual protection products include universal life and other long-term life and health insurance products. Major sources of market risk exposure for individual protection products include the reinvestment risk related to future premiums on regular premium policies, asset reinvestment risk on both regular premium and single premium policies and the guaranteed cost of insurance. Interest rate risk for individual protection products is typically managed on a duration basis, within tolerance ranges set out in the applicable investment policy or guidelines. Targets and limits are established so that the level of residual exposure is commensurate with our risk appetite. Exposures are monitored frequently, and assets are re-balanced as necessary to maintain compliance within prescribed tolerances using a combination of assets and derivative instruments. A portion of the longer-term cash flows are backed with equities and real estate.
For participating insurance products and other protection products with adjustable features, the investment strategy objective is to provide a total rate of return given a constant risk profile over the long term.
Fixed annuity products generally provide the policyholder with a guaranteed investment return or crediting rate. Interest rate risk for these products is typically managed on a duration basis, within tolerance ranges set out in the applicable investment guidelines. Targets and limits are established so that the level of residual exposure is commensurate with our risk appetite. Exposures are monitored frequently, and assets are re-balanced as necessary to maintain compliance within prescribed tolerances using a combination of fixed income assets and derivative instruments.
Certain protection and wealth products contain minimum interest rate guarantees. Market risk management strategies are implemented to limit potential financial loss due to reductions in asset earned rates relative to contract guarantees. These typically involve the use of hedging strategies utilizing interest rate derivatives such as interest rate floors, swaps and swaptions.
Indexed universal life products contain features that credit policyholders the return of underlying equity indices, subject to defined caps, floors and participation rates. Dynamic hedging strategies utilizing equity derivatives are implemented to replicate the policyholder returns and to limit the potential risk of equity guarantees to within our risk appetite tolerances.
Certain protection and wealth products contain features which allow the policyholders to surrender their policy at book value. Market risk management strategies are implemented to limit the potential financial loss due to changes in interest rate levels and policyholder behaviour. These typically involve the use of dynamic hedging strategies and the purchase of interest rate swaptions.
Certain products have guaranteed minimum annuitization rates. Market risk management strategies are implemented to limit the potential financial loss and typically involve the use of fixed income assets, interest rate swaps, and swaptions.
Segregated Funds Products
Certain segregated fund products provide benefit guarantees, which are linked to underlying fund performance and may be triggered upon death, maturity, withdrawal or annuitization. The cost of providing these guarantees is uncertain and depends upon a number of factors including general capital market conditions, our hedging activities, policyholder behaviour and mortality experience, each of which may result in negative impacts on net income, the contractual service margin and capital.
Our hedging programs use derivative instruments and fixed income assets to mitigate the interest rate, equity market, and foreign currency exposure of our segregated fund contracts. Materially all of our segregated fund contracts, as measured by fund values, are included in a hedging program. While materially all contracts are included in the hedging program, not all of our market risk exposure related to these contracts is hedged. For those segregated fund contracts included in the hedging program, we generally hedge the value of expected future net claims costs and associated risk adjustments for non-financial risk.
Our hedging strategy is applied both at the line of business or product level and at the total company level using a combination of hedging techniques such as re-balancing of short-dated interest rate and equity derivative contracts and longer-dated put options. We actively monitor our overall market exposure and may implement tactical hedge overlay strategies in order to align sensitivities with risk management objectives.
The impact of segregated fund guarantees and associated hedging programs on net income, contractual service margin and capital are included in the disclosed market risk sensitivities.
64 December 31, 2024 Sun Life Financial Inc. MANAGEMENT'S DISCUSSION & ANALYSIS
Market Risk Management Applications for Derivative Usage
The primary uses of derivatives are set out in the table below as at December 31, 2024.
| Products/Application | Uses of Derivative | Derivatives Used | ||||||
General asset-liability management - interest rate risk exposure for most protection and wealth products | To manage the sensitivity of the duration gap between assets and liabilities to interest rate changes | Interest rate swaps, swaptions, floors and bond forwards and futures | ||||||
Guarantees on protection and wealth contracts - minimum interest rate guarantees, guaranteed surrender values and guaranteed annuitization options | To limit potential financial losses from significant reductions in asset earned rates relative to contract guarantees | Interest rate swaps, swaptions, floors and bond forwards and futures | ||||||
Segregated fund guarantees & indexed universal life | To manage the exposure of product guarantees sensitive to movement in equity market and interest rate levels and currency fluctuations | Put options, call options, futures and swaps on equity indices, interest rate swaps, bond forwards and futures, and foreign exchange forwards | ||||||
| Currency exposure in relation to asset-liability management | To reduce the sensitivity to currency fluctuations by matching the value and cash flows of specific assets denominated in one currency with the value and cash flows of the corresponding liabilities denominated in another currency | Currency swaps and forwards | ||||||
| Credit exposure | To replicate credit exposures and enhance investment returns | Credit default swaps | ||||||
Additional Cautionary Language and Key Assumptions Related to Sensitivities Our market risk sensitivities are measures of our estimated change in net income, OCI, CSM and LICAT ratio for changes in market risk variables described above, based on market risk variables and business in force as at the reporting date. These sensitivities are calculated independently for each risk factor, generally assuming that all other risk variables stay constant. The sensitivities do not take into account indirect effects such as potential impacts on goodwill impairment or valuation allowances on deferred tax assets. | ||||||||||||||
We have provided measures of our net income sensitivity to instantaneous changes in equity markets, interest rates, credit spreads, swap spreads, real estate price levels, and capital sensitivities to changes in equity price levels, interest rates and credit spreads. The LICAT ratio and CSM sensitivities are non-IFRS financial measures, and for additional information, see section M - Non-IFRS Financial Measures in this document. The cautionary language which appears in this section is applicable to all net income, CSM, OCI and LICAT ratio sensitivities.
Actual results can differ materially from these estimates for a variety of reasons, including differences in the pattern or distribution of the market shocks, the interaction between these risk factors, model error, or changes in other assumptions such as business mix, effective tax rates, policyholder behaviour, currency exchange rates and other market variables relative to those underlying the calculation of these sensitivities. The extent to which actual results may differ from the indicative ranges will generally increase with larger movements in risk variables. Our sensitivities as at December 31, 2023 have been included for comparative purposes only. | ||||||||||||||
Sensitivities to interest rates and credit spreads assume a parallel shift in assumed interest rates across the entire yield curve or a parallel shift in the indicated spreads across the entire term structure, with no change to the ultimate risk-free rate or ultimate liquidity premium. Realized sensitivities may be significantly different from those illustrated based on factors such as different terms to maturity, geographies, asset classes and derivative types, and ratings. | ||||||||||||||
The sensitivities reflect the composition of our assets and liabilities as at December 31, 2024 and December 31, 2023, respectively. Changes in these positions due to new sales or maturities, asset purchases/sales, or other management actions could result in material changes to these reported sensitivities. In particular, these sensitivities reflect the expected impact of hedging activities based on the hedging programs in place as at the respective calculation dates. The actual impact of hedging activity can differ materially from that assumed in the estimated sensitivities due to ongoing hedge re-balancing activities, changes in the scale or scope of hedging activities, changes in the cost or general availability of hedging instruments, basis risk (i.e., the risk that hedges do not exactly replicate the underlying portfolio experience), model risk, and other operational risks in the ongoing management of the hedge programs or the potential failure of hedge counterparties to perform in accordance with expectations. | ||||||||||||||
The sensitivities are based on methods and assumptions in effect as at December 31, 2024 and December 31, 2023, as applicable. Changes in the regulatory environment, assumptions or methods used to measure assets and liabilities after those dates could result in material changes to the estimated sensitivities. Changes in market risk variables in excess of the changes illustrated may result in other than proportionate impacts. | ||||||||||||||
The sensitivities reflect the CSM as at December 31, 2024 and December 31, 2023. For insurance contracts measured using the VFA, where the change in the effect of the time value of money and financial risk not arising from the underlying items adjusts the CSM, changes in the CSM balance will affect the sensitivity of income to changes in market risk variables. | ||||||||||||||
Our LICAT sensitivities may be non-linear and can change due to the interrelationship between market rates and spreads, actuarial assumptions and our LICAT calculations.
MANAGEMENT'S DISCUSSION & ANALYSIS Sun Life Financial Inc. December 31, 2024 65
For the reasons outlined above, our sensitivities should only be viewed as indicative estimates of the underlying sensitivities of each factor under these specialized assumptions, and should not be viewed as predictors of our future income, OCI, CSM or capital. Given the nature of these calculations, we cannot provide assurance that actual impacts will be consistent with the estimates provided. | ||||||||||||||
Information related to market risk sensitivities should be read in conjunction with the information contained in section
N - Accounting and Control Matters - 1 - Critical Accounting Policies and Estimates in this document. Additional information on market risk can be found in Note 6 of the 2024 Annual Consolidated Financial Statements.
ii. Insurance Risk
Risk Description Insurance risk is the uncertainty of product performance due to actual experience emerging differently than expected in the areas of mortality, morbidity and longevity. In addition, policyholder behaviour, product design and pricing, expense and reinsurance risks impact multiple risk categories, including insurance risk. Insurance Risk Management Governance and Control We employ a wide range of insurance risk management practices and controls, as outlined below: •Insurance risk governance practices are in place, including independent monitoring and review and reporting to senior management and the Risk Committee. •Income and regulatory capital sensitivities are monitored, managed and reported against pre-established risk appetite limits for policyholder behaviour, mortality, morbidity and longevity risks. •Comprehensive Insurance Risk Policy, guidelines and practices are in place. •The global underwriting manual aligns underwriting practices with our corporate risk management standards and ensures a consistent approach in insurance underwriting. •Board-approved maximum retention limits are in place. Amounts issued in excess of these limits are reinsured. •Detailed procedures, including criteria for approval of risks and for claims adjudication are established and monitored for each business segment. •Underwriting and risk selection standards and procedures are established and overseen by the corporate underwriting and claims risk management function. •Diversification and risk pooling is managed by aggregation of exposures across product lines, geography and distribution channels. •Reinsurance is used to limit losses, minimize exposure to significant risks and to provide additional capacity for growth. •The Insurance Risk Policy and Investment & Credit Risk Policy establish acceptance criteria and protocols to monitor the level of reinsurance ceded to any single reinsurer or group of reinsurers. •Reinsurance counterparty risk is monitored, including annual reporting of reinsurance exposure to the Risk Committee. •Various limits, restrictions and fee structures are introduced into plan designs in order to establish a more homogeneous policy risk profile and limit potential for anti-selection. •Regulatory solvency requirements include risk-based capital requirements and are monitored regularly. •The Product Design and Pricing Policy requires detailed risk assessment and pricing provision for material risks. •Company specific and industry level experience studies and drivers of earnings analysis are monitored and factored into valuation, renewal and new business pricing processes. •Stress-testing techniques, such as FCT, are used to measure the effects of large and sustained adverse movements in insurance risk factors. •Insurance contract liabilities are established in accordance with IFRS. •Internal capital targets are established at an enterprise level to cover all risks and are above minimum regulatory and supervisory levels. The concentration for insurance risks is monitored geographically and its adverse effect is mitigated through a diversified product portfolio, product design, underwriting standards and practices, utilizing reinsurance as well as the Company's global operation. Specific to the reinsurance risk, the concentration is measured by aggregating the exposure to each reinsurance counterparty across all Business Groups to ensure it does not exceed a predefined risk level. Specific insurance risks and our risk management strategies are discussed below in further detail. | ||||||||||||||
Policyholder Behaviour Risk
Many of our products include some form of embedded policyholder option. We can incur losses due to adverse policyholder behaviour relative to the assumptions used in the pricing and valuation of products regarding lapse of policies or exercise of other embedded policy options. Uncertainty in policyholder behaviour can arise from several sources including: •Unexpected events in the policyholder's life circumstances; •The general level of economic activity (whether higher or lower than expected); •Changes in the financial and capital markets; •Changes in pricing and availability of current products; •The introduction of new products, changes in underwriting technology and standards; •Changes in our financial strength or reputation. Uncertainty in future cash flows affected by policyholder behaviour can be further exacerbated by unexpected behaviour during times of economic turbulence or at key option exercise points in the life of an insurance contract. | ||||||||||||||
66 December 31, 2024 Sun Life Financial Inc. MANAGEMENT'S DISCUSSION & ANALYSIS
Various types of provisions are built into many of our products to reduce the impact of uncertain policyholder behaviour. These provisions include: •Surrender charges that adjust the payout to the policyholder by taking into account prevailing market conditions. •Limits on the amount that policyholders can surrender or borrow. •Restrictions on the timing of policyholders' ability to exercise certain options. •Restrictions on both the types of funds policyholders can select and the frequency with which they can change funds. Policyholder behaviour risk is also mitigated through reinsurance on some insurance contracts. Internal experience studies are used to monitor, review and update policyholder behaviour assumptions as needed, which could result in updates to policy liabilities. | ||||||||||||||
Mortality and Morbidity Risk
Mortality and morbidity risk is the risk that future experience could be unfavourable relative to the assumptions used in the pricing and valuation of products. Mortality and morbidity risk could adversely affect many of our products which introduces the potential for adverse financial results. These risks can arise in the normal course of business through random fluctuation in realized experience, through catastrophes, as a result of a pandemic, or in association with other risk factors such as product development and pricing risk. Adverse mortality and morbidity experience could also occur through systemic anti-selection, which could arise due to poor plan design, or underwriting process failure or the development of investor-owned and secondary markets for life insurance policies. Adverse morbidity experience could also occur through external events such as increases in disability claims during economic slowdowns, increases in high medical treatment costs and growth in utilization of specialty drugs. Mortality and morbidity concentration risk is the risk of a catastrophic event that could occur in geographic locations where there is significant insurance coverage, such as natural environmental disasters (for example, earthquakes), human-made disasters (for example, acts of terrorism, military actions, and inadvertent introduction of toxic elements into the environment) as well as epidemics. Concentration risk exposure is monitored on group policies in a single location. We do not have a high degree of concentration risk to single individuals or groups due to our well-diversified geographic and business mix. The largest portion of mortality risk within the Company is in North America. Individual and group insurance policies are underwritten prior to initial issue and renewals, based on risk selection, plan design, and rating techniques. Current legislation in Canada restricts insurers from requiring policyholders to take or release the results of genetic tests. If policyholders have access to the results of genetic tests and we do not, this creates asymmetry of information between policyholders and insurers, which could adversely impact mortality and morbidity experience and policyholder behaviour. This asymmetry of information may increase as genetic testing advances and becomes more accessible, giving rise to better diagnoses of conditions where treatments are expensive or non-existent. The asymmetry of information may lead to increased anti-selection in new business underwriting. There may also be an impact on policy lapse rates where adverse genetic testing results may motivate policyholders to retain their policies resulting in higher claims payouts than assumed in the pricing and valuation of products, as well as increased insurance rates which may result in loss of new and existing policyholders. Detailed uniform underwriting procedures have been established to determine the insurability of applicants and to manage exposure to large claims. These underwriting requirements are regularly scrutinized against industry guidelines and oversight is provided through a corporate underwriting and claim management function. We are committed to paying claims fairly and promptly in accordance with the terms of our policies. Our claims management process is designed to ensure thorough evaluation of claims. The Insurance Risk Policy, which is approved by the Risk Committee, sets out limits on the maximum amount of insurance risk per life that may be retained. Retention limits per life vary by geographic region and amounts in excess of the Board-approved maximum retention limits are reinsured to ensure there is no exposure to unreasonable concentration of risk. •On a single life or joint-first-to-die basis our retention limit is $40 million in Canada and US$40 million outside of Canada. •For survivorship life insurance, our maximum global retention limit is $50 million in Canada and US$50 million outside of Canada. •In certain markets and jurisdictions, retention levels below the maximum are applied. Reinsurance is utilized for numerous products in most business segments, and placement is done on an automatic basis for defined insurance portfolios and on a facultative basis for individual risks with certain characteristics. | ||||||||||||||
MANAGEMENT'S DISCUSSION & ANALYSIS Sun Life Financial Inc. December 31, 2024 67
Longevity Risk
Longevity risk is the potential for losses arising from adverse changes in mortality improvement rates relative to the assumptions used in the pricing and valuation of products. This risk can manifest itself slowly over time as socioeconomic conditions improve and medical advances continue. It could also manifest itself more quickly, for example, due to medical breakthroughs that significantly extend life expectancy. Longevity risk affects contracts where benefits or costs are based upon the likelihood of survival and higher than expected improvements in insured life expectancy could therefore increase the ultimate cost of these benefits (for example, annuities, pensions, pure endowments, some segregated funds, and specific types of health contracts), thereby requiring strengthening of policyholder liabilities and resulting in reductions in net income and capital. To improve management of longevity risk, we monitor research in the fields that could result in a change in expected mortality improvement. Stress-testing techniques are used to measure and monitor the impact of extreme mortality improvement on the aggregate portfolio of protection and wealth products. | ||||||||||||||
Product Design and Pricing Risk
Product design and pricing risk is the risk a product does not perform as expected, causing adverse financial consequences. This risk may arise from deviations in realized experience versus assumptions used in the pricing of products. Risk factors include uncertainty concerning: •Future investment yields •Policyholder behaviour •Mortality and morbidity experience •Sales levels •Mix of business •Expenses •Taxes Although some of our products permit us to increase premiums or adjust other charges and credits during the life of the policy or contract, the terms of these policies or contracts may not allow for sufficient adjustments to maintain expected profitability. This could have an adverse effect on our profitability and capital position. Products that offer complex features, options or guarantees require increasingly complex pricing models, methods or assumptions, leading to additional levels of uncertainty. •The risk of mis-pricing increases with the number and inherent uncertainty of assumptions needed to model a product. •Past experience data supplemented with future trend assumptions may be poor predictors of future experience. •Lack of experience data on new products or new Client segments increases the risk that future actual experience unfolds differently from expected assumptions. •External environmental factors may introduce new risk factors, which were unanticipated during product design, and have an adverse result on the financial performance of the product. •Policyholder behaviour in the future may vary from that assumed at the time the product is designed, thereby adversely affecting the product's financial performance. Our Product Design and Pricing Policy, approved by the Risk Committee, establishes the framework governing our product design and pricing practices and is designed to align our product offerings with our strategic objectives and risk-taking philosophy. Consistent with this policy, product development, design and pricing processes have been implemented throughout the Company. New products follow a stage-gate process with defined management approvals based on the significance of the initiative. Each initiative is subject to a risk assessment process to identify key risks and risk mitigation requirements and is reviewed by multiple stakeholders. Additional governance and control procedures are listed below: •Pricing models, methods, and assumptions are subject to periodic internal peer reviews. •Experience studies, drivers of earnings analysis, and product dashboards are used to monitor actual experience against those assumed in pricing and valuation. •On experience rated, participating, and adjustable products, emerging experience is reflected through changes in policyholder dividend scales as well as other policy adjustment mechanisms such as premium and benefit levels. •Limits and restrictions may be introduced into the design of products to mitigate adverse policyholder behaviour or apply upper thresholds on certain benefits. | ||||||||||||||
Expense Risk
Expense risk is the risk that future expenses are higher than the assumptions used in the pricing and valuation of products. This risk can arise from: •General economic conditions; •Unexpected increases in inflation; •Slower than anticipated growth; •Changes in availability of current products; or •Reduction in productivity leading to increases in unit expenses. Expense risk occurs in products where we cannot or will not pass increased costs onto the policyholder and will manifest itself in the form of a liability increase or a reduction in expected future profits. From time to time, certain products or business segments may be closed for new sales (for example, individual protection business in the U.S.). Our ability to effectively manage the run-off of business in these products or business segments introduces additional risks, such as policyholder behaviour and expense risk, that may have an adverse effect on our operations, profitability and financial position. We closely monitor expenses through an annual budgeting process and ongoing monitoring of any expense gaps between unit expenses assumed in pricing and actual expenses. | ||||||||||||||
68 December 31, 2024 Sun Life Financial Inc. MANAGEMENT'S DISCUSSION & ANALYSIS
Reinsurance Risk
We purchase reinsurance for certain risks underwritten by our various insurance businesses. Reinsurance risk is the risk of financial loss due to adverse developments in reinsurance markets (for example, discontinuance or diminution of reinsurance capacity, or an increase in the cost of reinsurance), insolvency of a reinsurer or inadequate reinsurance coverage. While reinsurance arrangements provide for the recovery of claims arising from the liabilities ceded, we retain primary responsibility to the policyholders. Rates for our in-force reinsurance treaties can be either guaranteed or adjustable for the life of the ceded policy. Changes in reinsurance market conditions, including actions taken by reinsurers to increase rates on existing and new coverage and our ability to obtain appropriate reinsurance, may adversely impact the availability or cost of maintaining existing or securing new reinsurance capacity, with adverse impacts on our business strategies, profitability and financial position. There is a possibility of rate increases or renegotiation of some of the legacy reinsurance contracts by our reinsurers, as the global reinsurance industry continues to review and optimize their business models. In addition, changes to the regulatory treatment of reinsurance arrangements could have an adverse impact on our capital position. | ||||||||||||||
We have an Insurance Risk Policy approved by the Risk Committee and an Investment & Credit Risk Policy approved by the Governance Committee, which set acceptance criteria and processes to monitor and manage the level of reinsurance ceded to any single reinsurer. These policies are regularly reviewed and approved by the relevant Board Committee to ensure the alignment with our risk appetite levels and reinsurance risk guidelines. The policies set the acceptance criteria which verify if a reinsurer qualifies as a suitable reinsurance counterparty, having the capability, expertise, governance practices and financial capacity to assume the risks being considered. In addition, a periodic due diligence is performed on the existing reinsurance counterparties, including an internal credit assessment for reinsurance counterparties with whom we have material exposure. The exposure to each reinsurance counterparty is monitored closely to ensure that no single reinsurance counterparty represents an undue level of credit risk and does not exceed the predefined limits. In order to diversify our reinsurance risk, there is generally more than one reinsurance counterparty supporting a reinsurance pool. A summary of the reinsurance counterparty credit risk exposures is reported annually to the Risk Committee. To further increase the reinsurance risk control, our reinsurance agreements include provisions to allow actions to be taken, such as recapture of ceded risk (at a potential cost to the Company), in the event that the reinsurance counterparty loses its legal ability to carry on business through insolvency or regulatory action. In case of unfavourable developments in the reinsurance markets, we also have an option to discontinue or implement changes to the new sales of our products to better manage the associated risks. | ||||||||||||||
Additional information on insurance risk can be found in Note 7 of our 2024 Annual Consolidated Financial Statements.
iii. Credit Risk
Risk Description
Credit risk is the possibility of loss from amounts owed by our borrowers or financial counterparties. We are subject to credit risk in connection with issuers of securities held in our investment portfolio, debtors, structured securities, reinsurers, counterparties (including derivative, repurchase agreement and securities lending counterparties), other financial institutions and other entities. Losses may occur when a counterparty fails to make timely payments pursuant to the terms of the underlying contractual arrangement or when the counterparty's credit rating or risk profile otherwise deteriorates. Credit risk can also arise in connection with deterioration in the value of, or ability to realize, any underlying security that may be used as collateral for the debt obligation. Credit risk can occur as a result of broad economic conditions, challenges within specific sectors of the economy, from issues affecting individual companies or loss given default expectations. Events that result in defaults, impairments or downgrades of the securities in our investment portfolio would cause the Company to record realized or unrealized losses and may cause an increase in our provisions for asset default, adversely impacting earnings. | ||||||||||||||
MANAGEMENT'S DISCUSSION & ANALYSIS Sun Life Financial Inc. December 31, 2024 69
Credit Risk Management Governance and Control
We employ a wide range of credit risk management practices and controls, as outlined below: •Credit risk governance practices are in place, including independent monitoring and review and reporting to senior management and the Risk Committee. •Risk appetite limits have been established for credit risk. •Income and regulatory capital sensitivities are monitored, managed and reported against pre-established risk limits. •Comprehensive Investment and Credit Risk Management Policy, guidelines and practices are in place. •Specific investment diversification requirements are in place, such as defined investment limits for asset class, geography, and industry. •Risk-based credit portfolio, counterparty, and sector exposure limits have been established. •Mandatory use of credit quality ratings for portfolio investments has been established and is reviewed regularly. These internal rating decisions for new fixed income investments and ongoing review of existing rating decisions are independently adjudicated by Corporate Risk Management. • Develop and maintain hedging programs that may employ the use of derivatives. Market conditions determine the availability and cost of the derivative protection. •Comprehensive due diligence processes and ongoing credit analyses are conducted. •Regulatory solvency requirements include risk-based capital requirements and are monitored regularly. •Comprehensive compliance monitoring practices and procedures including reporting against pre-established investment limits are in place. •Purchase reinsurance for certain risks underwritten by our various insurance businesses. Reinsurance does not relieve us from our direct liability to policyholders and accordingly, we bear credit risk with respect to our reinsurers. Reinsurance exposures are monitored to ensure that no single reinsurer represents an undue level of credit risk. •Stress-testing techniques, such as FCT, are used to measure the effects of large and sustained adverse credit developments. •Insurance contract liabilities are established in accordance with IFRS. •Internal capital targets are established at an enterprise level to cover all risks and are above minimum regulatory and supervisory levels. Actual capital levels are monitored to ensure they exceed internal targets. | ||||||||||||||
Our core principles of credit risk management include asset diversification, fundamental research and analysis of cash flows, proactive and continuous risk monitoring, active management and relative value assessment, all with the objective of optimizing risk-adjusted returns, with due consideration for the impacts of capital and taxation.
We rate fixed income investments primarily through the use of internally developed scorecards and rating methodologies, which combine an estimated probability of default and loss given default to determine an expected loss and credit risk rating. This rating is expressed using a 22-point scale that is generally consistent with those used by external rating agencies, and is based on detailed examination of the borrower's, or issuer's, credit quality and the characteristics of the specific instrument. The probability of default assessment is based on borrower-level or issuer-level analysis, which encompasses an assessment of industry risk, business strategy, competitiveness, strength of management and other financial information. The loss given default assessment is based on instrument-level analysis, which considers the impact of guarantees, covenants, liquidity and other structural features. These scorecards provide input to stochastic value-at-risk models and are used to stress test the portfolio, which provide insight into the distribution and characteristics of credit risk within our portfolios. In accordance with our policies and under normal circumstances, our ratings cannot be higher than the highest rating provided by certain Nationally Recognized Statistical Rating Organizations ("NRSROs"). Certain assets, including those in our sovereign debt, are assigned a rating based on ratings provided by NRSROs using a priority sequence order of Standard & Poor's, Moody's, Fitch and DBRS Limited. | |||||||||||||||||
Additional information on credit risk can be found in Note 6 of our 2024 Annual Consolidated Financial Statements.
iv. Business and Strategic Risk
Risk Description
Business and strategic risk is the risk of loss from the inability to adequately identify, plan or implement an appropriate strategy to achieve strategic and business objectives or adapt to changes in Client behaviour, the external business, economic, geopolitical, regulatory or environmental and social landscape or when assumptions made in strategy are not realized as expected.
Business and Strategic Risk Management Governance and Control
We employ a wide range of business and strategic risk management practices and controls, as outlined below:
•Business and strategic risk governance practices are in place, including independent monitoring, review and reporting to Senior Management, the Board and the Board Committees.
•Business and strategic risk is managed through our strategic and business planning process and controls over the implementation of these plans. These plans are reviewed and key themes, issues and emerging risks are discussed by our Executive Team and by the Board and/or Board Committees.
•Our Business and Strategic Plans are subject to approval by the Board, which also receives regular reviews of implementation progress against key Business Plan objectives.
•Comprehensive policies including the Risk Framework, Risk Appetite Policy, Product Design and Pricing Policy, Mergers and Acquisition Policy, Change Management Risk - Strategic Execution Policy, Capital and Liquidity Management Framework and Capital Risk Policy are in place.
•Our corporate strategy and business objectives are established within the boundaries set out in the Risk Framework and the Risk Appetite Policy. Our business strategies and plans are designed to align with our risk appetite, our capital position and our financial performance objectives.
•Our risk appetite is periodically assessed, taking into consideration the economic and regulatory environments in which we operate.
•Merger, acquisition, strategic investments and divestiture transactions are governed by a Board-approved Merger and Acquisition Risk Management Policy and significant transactions require the approval of the Board.
•Stress-testing techniques, such as FCT, are used to measure the effects of large and sustained adverse scenarios.
70 December 31, 2024 Sun Life Financial Inc. MANAGEMENT'S DISCUSSION & ANALYSIS
•Key and emerging risks are identified, monitored and reported, including emerging regulatory changes that may have a material impact on our finances, operations or reputation.
•Internal capital targets are established at an enterprise level to cover all risks and are above minimum regulatory and supervisory levels. Actual capital levels are monitored to ensure they exceed internal targets. In the event of capital breaches, a clearly defined escalation process is in place.
We regularly review and adapt our business strategies and plans to take account of changes in the external business, economic, geopolitical and regulatory environments in which we operate. Our business strategies and plans are designed to align with our risk appetite, our capital position and our financial performance objectives. We periodically reassess our risk appetite taking into consideration the economic, regulatory and competitive environment in which we operate.
Specific business and strategic risks are discussed below in further detail.
Geopolitical Risk
Geopolitical risk is the wide array of risks associated with conflict or tensions between states as well as events or trends with global or international dimensions that increase risks for the operations of companies. We operate in various geographies and our business and financial operations are susceptible to regional and global economic, geopolitical and regulatory changes. Geopolitical risk may lead to increased volatility in the global capital and energy markets, difficulty in conducting business in certain geographies, an increased threat of targeted cyber-attacks, and has the potential to introduce reputational risk. The most recent actions between the US and Canada and the possibility of a drawn out trade war with tariffs in place for an extended period of time may cause severe disruption to the Canadian and US economies, impacting markets, GDP growth, foreign exchange rates, inflation and employment with associated implications for Clients and investments.
Economic Risk
We may be affected by economic and capital markets conditions and economic shocks around the globe as a result of increasingly connected global markets. Factors such as changes in interest rates, foreign exchange rates, market volatility, housing prices, consumer spending, saving and debt, business investment and inflation around the globe can affect the business and economic environments in which we operate.
Economic risk can also intersect with other risk considerations such as environmental and social risks. The impact of these factors include the possibility of continued low growth, sustained low interest rates, increases in inflation, increased volatility in interest rates and equity markets, and a continuation of relatively low yet volatile credit spreads. The impact on the economic environment from any of these events may not be consistent with our assumptions and expectations, which may adversely impact our financial results and the ability to implement our business strategy. Market-related impacts from the economic environment, legal, regulatory or policy changes or other governmental actions could continue to place pressure on our earnings, regulatory capital requirements, profitability, liquidity and our ability to implement our business strategies and plans. Low interest rates and increased volatility create a number of challenges for us including increased hedge costs, lower investment yields, adverse policyholder behaviour and lower levels of new business profitability. Other impacts of macro-economic uncertainty and volatility may lead to other financial and non-financial impacts including goodwill impairment, decline in our share price and impact on our credit and financial strength ratings.
Execution Risk
Our business strategies, plans and financial performance are dependent on the successful execution of organizational and strategic initiatives designed to support the growth of our business. Our ability to effectively manage and prioritize the execution of these initiatives, identify and adapt rapidly to new opportunities, and refine our strategies in response to changing economic, regulatory and competitive environment directly affects our ability to execute our strategies. Identifying and implementing the right set of initiatives is critical to achieving our Business Plan targets.
Successful execution of our business strategies and plans impacts a number of factors, including:
•Our ability to generate sufficient earnings to maintain an adequate level of capital;
•Our ability to generate sustained investment performance;
•Our ability to meet regulatory requirements;
•Our ability to manage our risk exposures effectively;
•Our ability to attract and retain Clients and distributors;
•Our ability to have the right set of diverse products and business mix, and
•Our ability to reduce operating expenses while maintaining our ability to hire, retain and motivate key personnel.
There is no certainty that we will be successful in implementing our business strategies or that these strategies will achieve our objectives. If our business strategies are not successful or are not executed effectively, it could lead to cost structure challenges and we may not be able to achieve our growth objectives or react to market opportunities, which may have an adverse impact on our business and financial results.
Distribution Risk
We distribute our products through a variety of distribution channels, including direct sales agents, managing general agents, independent general agents, financial intermediaries, broker-dealers, banks, pension and benefits consultants and other third-party marketing organizations. Competition for these intermediaries and agents is based on products, compensation, support services and financial position.
We face the risk that our key distribution partners may undergo consolidation, change in ownership structure or change their distribution model which could materially impact sales and our growth targets. New distribution channels could emerge that may impact the effectiveness of our current distribution strategy. Distribution channels are growing rapidly in some businesses in certain countries, which may heighten the risks of market conduct and channel conflicts or overlaps. Distribution risk may also be influenced where our distribution or product strategy and related services or technology are not in line with our strategic objectives or in consideration of the changes in Client behaviour or our regulatory environment.
MANAGEMENT'S DISCUSSION & ANALYSIS Sun Life Financial Inc. December 31, 2024 71
The capability to reach and retain Clients through use of digital technology and data analytics is becoming increasingly important in the insurance industry. While use of digital-based distribution channels may help us achieve or expand scale, these channels expose us to regulatory compliance and information security related risks.
Failure to achieve planned distribution scale could materially impact our financial and strategic objectives. This includes the inability to attract and retain intermediaries and agents at a cost that is financially feasible to the Company, or to develop online sales and Client support capabilities and technologies. In addition, the lack of a well-diversified distribution model in the jurisdictions in which we do business may cause over-reliance on agency channel or key partners.
Risks Relating to Mergers, Acquisitions, Divestitures and Strategic Investments
We regularly explore opportunities to selectively acquire other businesses or to divest ourselves of all or part of certain businesses, in support of our growth and strategic objectives.
Any transaction carries risks associated with economic, operational, strategic, financial, tax, legal, regulatory, compliance, environmental, social, and other factors, which could adversely impact our ability to achieve our financial and strategic objectives. These may include the risks that:
•We may be unable to make an appropriate acquisition in a desired market or business line;
•We may be unable to realize the financial and strategic benefits of the transactions, including any anticipated cost savings following an acquisition, due to competitive factors, regulatory requirements or other reasons;
•The capital utilized to finance any transaction may limit our ability to deploy further capital to pursue other opportunities and initiatives;
•We may fail to, or are unable to, uncover all material liabilities and/or subsequent asset impairments, despite having conducted extensive due diligence, and;
•The customary indemnifications provided by the seller to the purchaser may not be collectible or sufficient to fully offset losses arising from the acquired business, and the credit risk of the seller that the purchaser may be exposed to if an indemnification provision is triggered.
Our ability to realize the contemplated economic, financial, and strategic benefit of any transaction is contingent on several factors, including:
•The effective separation and/or integration of the transferred businesses, restructure and/or reorganization of related businesses, and retention of key personnel to effectively execute these transactions, and;
•The successful integration of the acquired businesses with our existing operation, and harmonization of any differences in organizational culture, which may require the dedication of significant management resources and distract management’s attention from our day-to-day business.
To mitigate these risks, we have established procedures to govern the evaluation, execution and integration of mergers and acquisitions transactions. Regular updates on execution and integration risks relating to these transactions are provided to the Board, its Committees and senior management teams, as appropriate, along with any mitigants developed to address such risks.
Competitive Environment
Competition from insurance companies, banks, asset managers, mutual fund companies, financial planners and other service providers (including new entrants and non-traditional financial services companies) is intense, and could adversely affect our business in certain countries.
The trend towards global consolidation of the financial services industry has resulted in competitors with significant market share and established distribution relationships and brands. These larger companies have the ability to heavily invest in fundamental activities for sustained profitable growth and superior Client service such as brand equity, product development, technology, risk management, and distribution capability.
The businesses in which we engage are highly competitive and our ability to sell our products is dependent on many factors, including scale, price and yields offered, distribution channels, digital capabilities, financial strength ratings, range of product lines and product and service quality, brand strength, investment performance, historical dividend levels and the ability to provide value added services to distributors and Clients. In certain markets, some of our competitors may be superior to us on one or more of these factors. Our competitors have significant potential to disrupt our business through targeted strategies to reduce our market share which may include targeting our key people or bancassurance partners and other distributors or aggressively pricing their products. Our ability to achieve our Business Plans and strategies depends significantly upon our capacity to anticipate and respond quickly to these competitive pressures.
Technology is driving rapid change in the financial services sector and is enabling new entrants to compete or offer services to our competitors to enhance their ability to compete in certain segments of the insurance, wealth and asset management markets. The emergence of new technologies such as robotic process automation, artificial intelligence, blockchain and advanced analytics may have an impact on the financial services sector and how companies interact with their stakeholders. Our current competitors or new entrants may use these or other new technologies to provide services in various areas such as customized pricing, proactive outreach to Clients and targeted marketing in order to strengthen their Client relationships and influence Client behaviour. The risk of disruption from changing technology and innovation may impact our distribution models as new and low cost digital-based business models emerge in connection with the distribution of financial services and products, such as insurtechs and robo-advisors. These risks are evolving rapidly with an increasing number of digital users and are difficult to anticipate and respond to proactively, and may adversely impact our profitability and financial position.
Competitors may offer a greater selection of or lower cost products, which may require us to adapt at a more rapid pace, create margin pressure in some of our businesses and impact our profitability and market share. In the asset management sector, there has been a trend among investors towards lower-fee passive investment products such as index- and other types of exchange-traded funds, which may impact our ability to attract and retain Clients in our actively managed products. Product development and product life cycles have shortened in many product segments, leading to more intense competition with respect to product features. This increases product development and administrative costs and reduces the time frame over which capital expenditures can be recovered. Regulatory and compliance costs also generally rise with increases in the range and complexity of our product portfolio.
72 December 31, 2024 Sun Life Financial Inc. MANAGEMENT'S DISCUSSION & ANALYSIS
Many of our insurance products, particularly those offered by the group segment, are renewed annually. Given this relatively high frequency of renewal activity, this business may be particularly exposed to adverse persistency through competitive market pressures.
Different accounting bases of reporting and regulatory capital requirements across multiple jurisdictions may cause us to be at a disadvantage compared to some of our competitors due to differences in reported earnings and due to these reporting and regulatory capital requirements.
Investment Performance
Investment performance risk is the possibility that we fail to achieve the desired return objectives on our investment portfolio, or that our asset management businesses fail to design or execute investment strategies in order to achieve competitive returns on the products and managed accounts offered by these businesses. Failure to achieve investment objectives may adversely affect our revenue and profitability through slower growth prospects and adverse impacts on policyholder or Client behaviour.
For our insurance businesses, the performance of our investment portfolio depends in part upon the level of and changes in interest rates, spreads, credit experience, equity prices, real estate values, the performance of the economy in general, the performance of the specific obligors included in these portfolios and other factors that are beyond our control. These changes can affect our net investment income substantially in any period.
In our asset management businesses, portfolio management risk is the risk that an investment strategy is not executed in a prudent manner, such that the mandate significantly fails to fulfill its investment objective and materially falls short of its target returns and relevant benchmark rates of return.
•Not properly executing the investment strategy could cause potential legal or regulatory concern and reputational harm, and we could lose existing and potential Clients.
•We may also see adversely affected sales, increased outflows or reduced level of assets under management, which could lead to a decline in the fee margin and financial losses.
Changes in Legal and Regulatory Environment
Most of our businesses are subject to extensive regulation and supervision. Changes to legislation, regulations or government policies, or the manner in which they are interpreted or enforced, may require that we make significant changes to our strategy and may result in increased implementation costs and diversion of resources to manage the change. These changes could impact financial reporting, accounting processes, capital requirements, the regulatory framework for our products and services, the regulation of selling practices, sales intermediaries and product offerings, solvency requirements, executive compensation, and corporate governance practices and could impose restrictions on our foreign operations (such as limits on foreign ownership of local companies). All of these changes could have an adverse effect on our business and operations. Our failure to comply with existing and evolving regulatory requirements could also result in regulatory sanctions and could affect our relationships with regulatory authorities and our ability to execute our business strategies and plans.
Currently there are a number of regulatory developments in Canada and globally which could impact our business and the way we are regulated or supervised in various jurisdictions, which include the following:
•In Canada, there has been increased focus on enhancing the affordability of and accessibility to prescription drugs and dental procedures, including pressure on the federal government from political parties, some provincial governments, the media and advocacy groups to implement forms of nationalized pharmacare and dentalcare programs. These programs could impact our business in several ways, including premium income, our ability to offer coverage, the price and level of coverage of other benefits we offer or are able to offer through our Canadian group benefits business, which in turn could impact plan renewals and retention of group Clients, plan member interaction and the value of other coverage offered by that business.
•Insurance and securities regulators continue to focus on client fairness, advisor conduct and related practices and are assessing product fees, compensation practices, sales practices and conflicts of interest. Regulators are also imposing higher standards that relate to interacting with clients in order to increase disclosure obligations related to fees; impose prohibitions or restrictions on the payment of certain types of commissions and service fees to agents, advisors and third-party distributors; resulting in changes to product features and sales and market practices by agents, advisors, product manufacturers and distributors. Examples of these changes include the Client Focused Reforms released by the Canadian Securities Administrators which fully came into effect on December 31, 2021, and the final rule amendments published by the Canadian Securities Administrators and the Canadian Council of Insurance Regulators in April 2023, and coming into effect on January 1, 2026 to enhance total cost reporting for investment funds and segregated funds.
•In the U.S., the Trump administration is expected to reshape federal policy through executive and regulatory authority. These policy changes may affect taxation, healthcare, technology, trade, and ESG, among other things, and could directly or indirectly impact our business.
•In June 2020, China passed the Hong Kong National Security Law under which law enforcement authorities have extensive powers. In July 2020, then-U.S. President Trump signed into law the Hong Kong Autonomy Act (the "Act"), and issued an Executive Order providing authority to impose primary sanctions against entities and individuals determined to have materially contributed to the undermining of Hong Kong’s autonomy. The Act also provides authority to impose secondary sanctions against non-U.S. financial institutions determined to have conducted a significant transaction for any individual or entity subject to primary sanctions under the Act. In June 2021, China enacted the Law of the People’s Republic of China on Countering Foreign Sanctions, which authorizes the State Council to impose countermeasures in response to sanctions imposed by foreign governments on Chinese companies and individuals. In March 2024, Hong Kong enacted the Safeguarding National Security Ordinance pursuant to Article 23 of the Basic Law of Hong Kong, which comprises a number of new offences (including those relating to state secrets), changes to existing offences and additional powers on enforcement and implementation by law enforcement authorities including extraterritorially. The U.S. and China have applied a number of targeted sanctions and trade restrictions against the other's respective interests in recent years and there may be heightened risks and uncertainties to our business in Hong Kong as a result of these developments.
•Regulators are increasing their focus on data, technology and cybersecurity. New laws, regulations, guidelines, directives and expectations continue to emerge that will require the Company to enhance its technology and information security programs, upgrade its third-party risk management and data governance programs, increase regulatory reporting obligations and have an impact on the costs and resources associated with the Company’s data technology and information security activities.
MANAGEMENT'S DISCUSSION & ANALYSIS Sun Life Financial Inc. December 31, 2024 73
•Regulators in the various jurisdictions in which we operate have increased their focus on ESG matters, including the impact of climate change, and some regulators have taken steps towards introducing or have already introduced rules to address risks and disclosures around these matters. In Canada, OSFI Guideline B-15 on Climate Risk Management ("Guideline B-15") became effective as of fiscal year-end 2024 and sets out OSFI’s expectations related to the management and disclosure of climate-related risks by FRFIs. In December 2024, the Canadian Sustainability Standards Board (CSSB) finalized and issued its Canadian Sustainability Disclosures Standards (“CSDS”) 1 and 2. CSDS 1 and CSDS 2 are standards for general sustainability-related disclosures and climate-related disclosures, respectively. While the proposed standards will not be mandatory, their release is expected to lead to the implementation by regulators of mandatory sustainability reporting requirements under applicable Canadian law. OSFI has committed to ensuring interoperability from a prudential perspective between Guideline B-15 and the CSSB standards. The Canadian Securities Administrators (“CSA”) intends to consider the final CSSB standards in its revised proposal for a climate-related disclosure regime and may include modifications appropriate for Canadian capital markets. In addition, in 2022, the CSA published guidance for investment funds relating to ESG disclosure, which was revised in March 2024. In the U.S., state governments and regulators have increased their focus on the ESG practices of financial institutions, asset managers, and large U.S. entities conducting business in their states, particularly with respect to climate risk and greenhouse gas emissions. This includes both the climate-related disclosure legislation in states such as California as well as, conflicting state level considerations on other ESG practices that reflect the political polarization surrounding ESG in the U.S. Additionally, the SEC issued its final climate related disclosure rule which requires many registrants to include certain climate-related disclosures in their regulatory filings. The rule is on hold pending judicial review. In addition, the broad-reaching EU Corporate Sustainability Reporting Directive came into effect in 2023, which mandates comprehensive reporting under the European Sustainability Reporting Standards from many non-EU headquartered companies with EU operations that meet certain criteria. Potential divergence in expectations among regulators, as well as the pace of regulatory change in the area of climate change, could lead to operational risks. We continue to monitor our risk management practices and disclosures as new regulations and standards are implemented and as the situation continues to evolve. We are also monitoring the development of anti-greenwashing laws and regulations, including recent amendments to the Competition Act (Canada) which have introduced new substantiation standards for environmental claims, as well as climate-related litigation and enforcement actions relating to “greenwashing” or the practice of making misleading or unsubstantiated environmental claims.
See the heading Regulatory Matters in the AIF for a description of our regulatory environment in Canada, the U.S., Asia and Bermuda and other examples of changes in regulation that may affect our business and operations.
Environmental and Social Risk
Our financial performance, operations, and reputation may be adversely affected if we do not adequately prepare for the direct or indirect impacts of environmental and social risks. Environmental and social risks include but are not limited to environmental damage on properties owned or managed by us, physical risks, as well as public health risks. These risks may impact our direct operations, investing activities or other areas of our value chain.
Environmental and social risks can arise as a direct result of the increased frequency and severity of environmental disasters, emerging regulatory and public policy developments, and their impacts on our operations, invested assets, suppliers, Clients and reputation. They can also arise indirectly through heightened stakeholder expectations around environmental and social performance, resource constraints, costs associated with adaptation, and Clients and suppliers negatively impacted by the aforementioned. Environmental and social risks are considered in our risk assessment processes.
As an owner/lessor of and investor in real estate, we may be impacted where environmental events damage or disrupt our underlying properties. Our businesses and the properties underlying our investments are subject to environmental laws and regulations in the jurisdictions in which we operate. Consequently, we may experience environmental impacts or liabilities that could adversely affect the value of those businesses and properties, their ability to generate income, and costs related to any compliance requirements or remediation. Through other invested assets, such as loans, bonds or equity investments, we could be subject to these impacts and negative consequences from environmental issues arising at the level of the issuer and/or specific asset. Our reputation and operations may be adversely affected if we or our tenants, borrowers, or other associated parties violate environmental regulations or best practices.
Environmental risks could also harm the financial position of our reinsurers and insurers of property which we own, lease, have invested in, or manage. In turn, this may increase the risk of default on recoveries from these reinsurers and insurers, may increase the cost of reinsuring our business or the cost of insurance, and may result in reinsurance or insurance coverage being unavailable.
Significant environmental changes and disasters may also reduce the overall level of economic activity in affected areas which could hurt our businesses, the value of our investments, our ability to offer products and services, or service our existing Clients. As noted above under Insurance Risk - Mortality and Morbidity Risk, environmental risks have implications in areas such as catastrophic risk and the concentration risk presented by natural and human-made environmental disasters. As these events increase, they may impact our mortality and morbidity experience and our pricing and modelling assumptions.
If our Clients, shareholder groups, or other key stakeholders deem that our environmental and social practices are inadequate, our business could be negatively affected. Failure to comply with an existing or potential Client's policies (or not meeting their minimum requirements) could disqualify us from the opportunity to bid on, earn, or retain business. We may also experience reduced access to capital markets if certain indices find that our practices fall short of their criteria and we are removed as an index constituent.
v. Operational Risk
Risk Description
Operational risk is the risk of loss (financial and non-financial) resulting from inadequate or failed internal processes, people and systems or from external events. Operational risk is present in all of our business activities and encompasses a broad range of risks as described below. Operational risk is embedded in the practices utilized to manage other risks and, therefore, if not managed effectively, operational risk can impact our ability to manage other key risks.
74 December 31, 2024 Sun Life Financial Inc. MANAGEMENT'S DISCUSSION & ANALYSIS
Operational Risk Management Governance and Control
We employ a wide range of operational risk management practices and controls, as outlined below:
•Operational risk governance practices are in place, including independent monitoring and review and reporting to senior management and the Board Committees.
•Risk appetite limits have been established in Operational Risk.
•Comprehensive Operational Risk Management Framework, Policies, guidelines and practices are in place.
•Our governance practices, corporate values, Code of Conduct and Company-wide approach to managing risk set the foundation for mitigating operational risks.
•Our Code of Conduct sets the tone for a strong ethical culture, and we regularly review and update the Code of Conduct to ensure that it continues to meet the expectations of regulators and other stakeholders. All our directors and employees must reconfirm annually their understanding of and commitment to comply with the Code of Conduct.
•We have established appropriate internal controls and systems for talent acquisition, rewards and development programs that attract, build and retain top talent and create strong succession plans as well as compensation programs, and we provide ongoing training to our people.
•We conduct regular monitoring of employee engagement to ensure we create and maintain a work environment where all employees are welcome and able to contribute effectively.
•Stress-testing techniques, such as FCT, are used to measure the effects of large and sustained adverse scenarios.
•We mitigate a portion of our operational risk exposure through our corporate insurance program by purchasing insurance coverage that seeks to provide insurance against unexpected material losses resulting from events such as criminal activity, property loss or damage and liability exposures, or that satisfies legal requirements and contractual obligations.
•Internal capital targets are established at an enterprise level to cover all risks and are above minimum regulatory and supervisory levels. Actual capital levels are monitored to ensure they exceed internal targets.
Specific operational risks and our risk management strategies are discussed below in further detail.
Information Security and Privacy Risks
Information and technology are used in almost all aspects of our business and operations. As part of our Client strategy, we continue to enhance the digital side of our business to support and enable new business models and processes, that are more personal, proactive and predictive.
Our business and the successful implementation of our digital strategy are dependent on various factors including maintaining a secure environment for information belonging to our Clients, employees and other parties that interact with us. This requires the effective and secure use, management and oversight of information and physical assets. We engage with various stakeholders and leverage emerging technologies, including digital, mobile applications, cloud computing, artificial intelligence and robotic process automation. These technologies are used to collect, process and maintain information relating to business transactions and financial reporting, as well as the personal information of our Clients and employees. We also obtain services from a wide range of third-party service providers and have outsourced some business and information technology functions in various jurisdictions.
There continues to be an increasing number of information security compromises and privacy breaches across industry sectors, governments and individuals. The increasing scope and complexity of malicious activity poses a significant risk to our systems and these risks may be exacerbated by the breadth of our operations, our geographic footprint and the complexity of our technology systems. A serious security or privacy breach of either an internal or third-party service provider’s computer system that contains sensitive business, Client and/or employee information may result in business interruption, theft or misuse of confidential information, regulatory penalties and scrutiny, litigation, reputational damage and may have an adverse impact on current and future business opportunities with our Clients, employees and business relationships. We continue to actively monitor for increases in malicious activity due to escalating geopolitical tensions across the globe.
In particular, privacy breaches could occur and may result in unauthorized access, use or disclosure of personal information. Many jurisdictions in which we do business are developing and implementing cyber security reporting requirements and more stringent consumer privacy legislation, often with greater enforcement powers for regulators and higher fines and penalties for organizations.
We continue investing in people, processes, and technology to strengthen our abilities to respond to the evolving threat landscape. Our well-established security controls and processes are intent on protecting our information and computer systems and the information entrusted to us by our Clients and employees. Examples of our established controls and processes include:
•Our Information Security framework is overseen by the Chief Information Security Officer, supported by senior leadership and by our Operational Risk Management Framework.
•Our Information Security framework and governance controls (policies, procedures, training) are aligned with recognized industry standards and are compliant with applicable laws and regulations. The security framework also includes technology and process safeguards and regularly promotes secure behavioural practices.
•As part of our layered security approach, we deliver general security awareness training sessions to all employees every year that is reinforced with regular awareness resources and activities.
•Our Chief Privacy Officer oversees the global privacy program and sets direction for privacy compliance across the enterprise. Our global privacy program monitors adherence to our global privacy commitments, local laws and local privacy policies.
•Over 30 Privacy Officers across the enterprise monitor emerging privacy legislation, help our businesses make privacy-related decisions and provide guidance on handling personal information.
•We deliver general privacy training annually to all employees supported by targeted training as needed, and provide regular monitoring and reporting.
•Our protection strategy leverages information security risk assessments and privacy impact assessments to evaluate potential risks.
•We carry cyber risk insurance to help mitigate the impact of security and privacy incidents.
The threat environment is rapidly and constantly changing, and there remains a possibility that our processes and controls could be unsuccessful in detecting or preventing a security breach. We remain vulnerable, and work with third parties who may also be vulnerable, to computer viruses and other types of malicious software, cyber-attacks and hacking attempts from unauthorized persons, the physical theft of
MANAGEMENT'S DISCUSSION & ANALYSIS Sun Life Financial Inc. December 31, 2024 75
computer systems, internal programming or human errors, fraud, or other disruptive problems or events. There is also a risk that certain internal controls fail, which could also exacerbate the consequences from such events.
Human Resources Risk
Our ability to achieve business objectives can be adversely affected if we are unable to attract, retain or effectively deploy resources with the in-depth knowledge and necessary skills required, or are unable to design compensation and talent programs that effectively drive employee behaviour and shape corporate culture. Failure to manage Human Resources risk can also lead to direct financial and reputational loss including losses arising from activity that is inconsistent with Human Rights or employment laws or health and safety regulations.
To mitigate this risk, we have comprehensive Human Resource policies, practices and programs in place to ensure compliance with employment legislation, minimize the risk of employee misconduct, and proactively develop employee skills, capabilities and behaviours to meet future business needs.
Regulatory Compliance, Legal and Conduct Risk
We are subject to extensive regulatory oversight by financial services regulators in the jurisdictions in which we conduct business. Failure to comply with applicable laws or to conduct our business consistent with changing regulatory or public expectations could adversely impact our reputation and may lead to regulatory investigations, examinations, proceedings, settlements, penalties, fines, restrictions on our business, litigation or an inability to carry out our business strategy.
As a business with external Clients and stakeholders, we face many operational risks, including, legal, fraud, privacy, financial crimes, market conduct, and business conduct. Examples of how these operational risks may affect our business are outlined below:
a.Legal Risk: during the normal course of operating our business, we are subject to the risk of adverse litigation including class action lawsuits. Such litigation could result in reputational damage and financial loss.
b.Fraud Risk: both internal and external fraud are possibilities within our business, such as opening policies under other people’s names. Such actions could result in reputational damage and lawsuits.
c.Privacy Risk: any leakage of personal information could have ramifications for our business and may lead to lawsuits and reputational damage.
d.Financial Crimes Risk: non-compliance with regulatory requirements and the failure to manage the risk around Money-Laundering, Terrorist Financing, Sanctions, Bribery and Corruption can lead to financial loss, reputational damage, business sanctions.
e.Market Conduct Risk: the risk of unfair treatment of Clients, for example, as a result of inadequate or failed processes or inappropriate behaviours, offerings, or interactions by the Enterprise, its Employees, Agents, Distributors, or other third parties. This includes risk arising from non-compliance with Regulatory Requirements and how we design, develop, market, distribute, sell or service our products to our Clients and may result in reputational damage and financial loss.
f.Business Conduct Risk: the risk arising from the administration of the firm that is not compliant with applicable laws and regulations, which may result in reputational damage, business sanctions and financial loss.
As an international organization, we are subject to anti-bribery and anti-corruption laws, and regulations in the jurisdictions in which we operate in, each of which include significant civil and criminal penalties if breached. Our policies, including our Code of Conduct, require strict adherence to these laws. We, or our joint ventures, Distributors or other third-parties acting on our behalf, may from time to time interact with government officials, which presents a heightened risk of censure under anti-bribery and anti-corruption laws if our or our business partners' due diligence or other procedures when interacting with government officials are deemed inadequate.
Financial services regulators and other government agencies in jurisdictions we operate regularly make inquiries, conduct investigations and administer examinations with respect to compliance with applicable laws and regulations. As well, regulators and governmental authorities, industry groups and rating agencies have developed initiatives regarding market conduct. Financial services regulators and other governmental authorities in many of the countries in which we operate have raised issues and commenced regulatory inquiries, investigations and proceedings with respect to current and past business practices in the financial services industry and have given greater emphasis to the investigation of those practices. Current and future regulatory investigations, examinations, proceedings, and civil actions arising out of such matters could adversely affect our reputation, and may result in settlements, penalties, fines, restrictions on our business, litigation or an inability to carry out our business strategy or may cause us to make changes to our business and compliance practices, policies and procedures, which in turn could impact our profitability and future financial results and increase our litigation risk.
Under the Insurance Companies Act and the Supervisory Information (Insurance) Regulations (Canada) and pursuant to similar restrictions in other jurisdictions, we are prohibited from directly or indirectly disclosing any supervisory information relating to SLF Inc., Sun Life Assurance and their affiliates.
Our Chief Compliance Officer oversees our comprehensive Enterprise-wide compliance framework, which is aligned with guidance from OSFI and other regulators. This framework promotes proactive, risk-based management of compliance and regulatory risk, and includes Enterprise and business segment policies and operating guidelines, programs to promote awareness of laws and regulations that impact us, ongoing monitoring of emerging legal issues and regulatory changes and training programs.
•The employee training programs include anti-money laundering and anti-terrorist financing, sanctions, anti-bribery and corruption, fraud, privacy and information security risk management.
•Effective governance, oversight and implementation is a coordinated effort between first and second lines of defence functions. Second line oversight and effective challenge relies on a network of compliance officers.
•The Chief Compliance Officer reports regularly to the Board and Board Committees on the health of the compliance program, key compliance risks, emerging regulatory trends, escalation of significant issues and key risk indicators.
Information Technology Risk
The use of technology and computer systems is essential in supporting and maintaining business operations. We use technology to support virtually all aspects of our business and operations. The rapidly changing business environment increases the risk of our technology strategy not being agile enough to adapt to new business demands in a timely manner leading to financial losses, increased costs and the inability to meet Client needs.
76 December 31, 2024 Sun Life Financial Inc. MANAGEMENT'S DISCUSSION & ANALYSIS
Initiatives supporting our business strategy rely on developing innovative information technology solutions on a timely basis. Although every reasonable precaution is taken to ensure information technology systems remain available, stable, and current, it is not possible to fully eliminate all risk. Some changes and upgrades are extremely complex and there is a chance that an undetected technical flaw may exist, which, when implemented, stops or disrupts critical information technology systems or business applications.
Third-Party Risk
We engage in a variety of third-party relationships, including with distributors, independent contractors, outsourcing service providers and suppliers. Our profitability or reputation could be impacted if these third parties are unable to meet their ongoing service commitments or fail to perform to expected standards.
An interruption in our relationship with certain third parties or other parties engaged by such third parties, the impairment of their reputation or creditworthiness, their failure to provide contracted services in the manner agreed or in accordance with applicable laws and regulations,
or the ability to timely and cost effectively transition to alternate third parties in the event of a disruption could materially and adversely affect our business objectives or expose us to regulatory fines and/or reputational harm.
To manage these risks, we have established Company-wide policies and guidelines which are consistent with OSFI's and other local regulatory requirements, and which set out our requirements to identify, assess, manage, monitor and report on third-party risks. Our program includes third-party risk assessments and a risk-based approach to conducting due diligence. The key elements and risks associated with the third party are documented in the form of a written agreement, and the company monitors performance of its third parties in a manner that is commensurate to the size, risk, scope and complexity of the third-party relationship.
Business Disruption Risk
To conduct operations, our businesses are dependent on the availability of a range of resources including trained employees, physical locations, access to technology and third parties.
A sustained failure of one or more of our key business processes or systems could materially and adversely impact our business, operations and employees. These failures can result from disruption of our processes and systems due to a range of risks including utility outages, fires, floods, severe storms, cyber-attacks, terrorism and other human-made attacks, natural disasters and other events. We have experienced increased incidents and impacts of disruption due to weather events such as tropical storms and flooding in the geographies in which we operate, as well as earthquakes, and pandemic risks.
Business disruptions can also occur due to changes in environmental risk. The related impacts have been highlighted above under the heading Environmental and Social Risk. Also, because some of our business processes are performed by third parties and some of our systems interface with, or are dependent on, third-party systems, we could experience service interruptions if these third-party operations or systems are degraded and/or fail.
To mitigate these risks, we have implemented a business continuity management program to regularly test and facilitate the recovery of critical business operations. This program encompasses business continuity, crisis management and disaster recovery planning, and includes periodic testing of these plans.
Our policy, guidelines and operating procedures establish consistent processes to manage the impact to key business functions and operations and to support effective and efficient resumption should a major disruption occur. In addition to regular updates and testing of business continuity plans for critical business operations, we conduct mandatory business continuity awareness training for all employees annually and have off-site backup facilities and failover capability designed to minimize downtime and accelerate recovery time in the event of a major disruption.
Model Risk
We use complex models to support many business functions including product development and pricing, capital management, valuation, financial reporting, planning, hedging, asset-liability management, risk management and advanced analytics (such as artificial intelligence, predictive modelling and decision making algorithms). Model risk is the risk of loss, either in the form of financial loss, inappropriate or poor business decisions, damage to reputation, or other adverse impact, arising from inaccurate model outputs or incorrect use or interpretation of model outputs.
Model risk can arise from many sources including
•inappropriate methodologies,
•assumptions or parameters,
•incorrect use of source data,
•inaccurate or untimely source data,
•incorrect application or operator errors,
•increasing product complexity, and
•regulatory expectations.
If the models' methodologies and assumptions are not appropriately set or well controlled, or data or implementation errors occur in the models, this could result in a negative impact on our results and financial position.
Many of our methods and models for managing risk and exposures are based upon the use of observed historical precedents for financial market behaviour, credit experience and insurance risks. As a result, these methods may not fully predict future risk exposures, which can be significantly greater than our historical measures indicate. Other risk management methods depend upon the evaluation of information regarding markets, Clients, catastrophic occurrence or other matters that are publicly available or otherwise accessible to us. However, this information may not always be accurate, complete, up-to-date, properly evaluated or necessarily indicative of ultimate realized experience. As we review and update our models, changes might be made to valuation methods and assumptions, which may impact our results.
MANAGEMENT'S DISCUSSION & ANALYSIS Sun Life Financial Inc. December 31, 2024 77
To manage model risk, we have established robust, Company-wide model risk management procedures over the models' life cycle with respect to building, using, changing and retiring models. The policy and operating guidelines set out minimum, risk-based requirements to ensure that models are effectively controlled, maintained and appropriately understood by users.
Information Management Risk
As an international provider of financial services, we deal with extensive information across a number of countries.
Information management risk is the:
a.inability to capture, manage, retain and appropriately dispose of business records,
b.the inability to provide data that is valid, complete, accurate, consistent, unique, or timely to support business decisions, and
c.the inability to manage data location and cross-border access appropriately.
Failure to manage these risks could have financial or reputational impacts, and may lead to regulatory proceedings, penalties, and litigation. To manage and monitor information management risk, we have a data governance framework, which includes a records management program, data quality best practices, and data residency controls.
We continue to evolve our risk management best practices to manage risks associated with Generative-AI as we identify use cases and run experiments designed to identify opportunities.
vi. Liquidity Risk
Risk Description
Liquidity risk is the possibility that we will not be able to fund all cash outflow commitments and collateral requirements as they fall due. This includes the risk of being forced to sell assets at depressed prices resulting in realized losses on sale. This risk also includes restrictions on our ability to efficiently allocate capital among our subsidiaries due to various market and regulatory constraints on the movement of funds. Our funding obligations arise in connection with the payment of policyholder benefits, expenses, reinsurance settlements, asset purchases, investment commitments, interest on debt, and dividends on common and preferred shares. Sources of available cash flow include general fund premiums and deposits, investment related inflows (such as maturities, principal repayments, investment income and proceeds of asset sales), proceeds generated from financing activities, and dividends and interest payments from subsidiaries. We have various financing transactions and derivative contracts under which we may be required to pledge collateral or to make payments to our counterparties for the decline in market value of specified assets. The amount of collateral or payments required may increase under certain circumstances (such as changes to interest rates, credit spreads, equity markets or foreign exchange rates), which could adversely affect our liquidity. | |||||
Under stress conditions, increases in funding obligations can occur in conjunction with reductions in cost effective sources of available cash inflow. In particular, adverse stress scenarios could involve increases in policyholder cash surrenders and terminations and decreases in the amounts of premiums and deposits being generated by existing and new Clients. Adverse capital market conditions may also be associated with a reduction in available market liquidity and clearing prices for expected asset sales, and reductions in the level of cash inflows (dividends, interest payments and expected maturities) on continuing portfolio investments. These developments could have an adverse effect on our financial position and results of operations.
We engage in various transactions including repurchase agreements and other capital markets transactions to meet short-term cash requirements. The cost and our ability to execute these transactions may be negatively impacted by illiquid or volatile markets. Disruption in the financial markets may limit our access to capital in the event we are required to seek additional liquidity to operate our businesses. This will result in increased costs to raise capital coupled with less desirable terms or maturities which would decrease future profitability and financial flexibility.
SLF Inc. is a holding company for its insurance, wealth and asset management subsidiaries and does not have significant operations of its own. Dividends and interest payments from its subsidiaries are its principal sources of cash. If the cash received from its subsidiaries is insufficient, then it may be required to raise debt or equity externally or sell some of its assets. We are subject to various regulations in the jurisdictions in which we operate. The ability of SLF Inc.'s subsidiaries to pay dividends and transfer funds is regulated in certain jurisdictions and may require local regulatory approvals and the satisfaction of specific conditions in certain circumstances. Through effective cash management and capital planning, SLF Inc. ensures that its subsidiaries, as a whole and on a stand-alone basis, are properly funded and maintain adequate liquidity to meet obligations, both individually and in aggregate.
In addition, rating agencies publish credit ratings of securities issued by SLF Inc. and its subsidiaries, which have an impact on the interest rates paid by those companies on borrowed funds. A material downgrade in the issuer credit ratings could limit our access to capital or increase the cost of borrowing and may have an adverse effect on our financial condition.
We have established financing arrangements that support NAIC statutory reserves for universal life policies issued by Sun Life Assurance in the U.S. Our ability to support these reserves with these financing structures can be negatively impacted by market conditions and regulatory changes. Further, these financings, in all or in part, are treated as operating leverage by the rating agencies. If, due to a change in rating agency methodology or position, the rating agencies cease to treat these financings as operating leverage, without providing any grandfathering provisions, there may be an adverse impact on our credit and financial strength ratings.
78 December 31, 2024 Sun Life Financial Inc. MANAGEMENT'S DISCUSSION & ANALYSIS
Liquidity Risk Management Governance and Control We generally maintain a conservative liquidity position and employ a wide range of liquidity risk management practices and controls, which are described below: •Liquidity risk governance practices are in place, including independent monitoring and review and reporting to senior management and the Risk Committee. •Liquidity is managed in accordance with our Asset Liability Management Policy and operating guidelines. •Liquidity contingency plans are maintained for the management of liquidity in a liquidity event. •Stress testing is performed by comparing liquidity coverage risk metrics under a one-month stress scenario to our policy thresholds. These liquidity coverage risk metrics are measured and managed at the enterprise and legal entity levels. •Stress testing of our collateral is performed by comparing collateral coverage ratios to our policy thresholds. •Cash Management and asset-liability management programs support our ability to maintain our financial position by ensuring that sufficient cash flow and liquid assets are available to cover potential funding requirements. We invest in various types of assets with a view of matching them to our liabilities of various durations. •Internal capital targets are established at an enterprise level to cover all risks and are above minimum regulatory and supervisory levels. Actual capital levels are monitored to ensure they exceed internal targets. •We actively manage and monitor our capital and asset levels, and the diversification and credit quality of our investments. •Various credit facilities for general corporate purposes are maintained. Based on our historical cash flows and liquidity management processes, we believe that the cash flows from our operating activities will continue to provide sufficient liquidity for us to satisfy Client obligations, service debt obligations and to pay other expenses as they fall due. | |||||
MANAGEMENT'S DISCUSSION & ANALYSIS Sun Life Financial Inc. December 31, 2024 79
Maturity Analysis for Insurance Contracts
The following tables present the undiscounted estimated future cash flows of insurance contract and reinsurance contract held assets and liabilities on our Consolidated Statements of Financial Position. These cash flows include estimates related to the timing and payment of death and disability claims, policy surrenders, policy maturities, annuity payments, minimum guarantees on segregated fund products, policyholder dividends, amounts on deposit, commissions and premium taxes offset by contractual future premiums and fees on in-force contracts. These estimated cash flows are based on the best estimated assumptions used in the determination of insurance contract and reinsurance contract held assets and liabilities. Due to the use of assumptions, actual cash flows will differ from these estimates. Amounts payable on demand, which includes amounts on deposit, dividends on deposit, outstanding claims and policyholder account values, are included in the 1 year or less time band. Amounts in this table include the liability for incurred claims and liability for remaining coverage for contracts measured using the premium allocation approach ("PAA"). The amounts included in the table differ from the carrying value of the portfolio mainly due to discounting and risk adjustments. | ||||||||||||||
| As at December 31, | 2024 | 2023 | ||||||||||||
| Insurance contract liabilities: | ||||||||||||||
Within 1 Year(1) | $ | 11,269 | $ | 11,428 | ||||||||||
1 Year to 2 Years | 3,254 | 3,670 | ||||||||||||
2 Years to 3 Years | 3,363 | 3,887 | ||||||||||||
3 Years to 4 Years | 4,059 | 4,128 | ||||||||||||
4 Years to 5 Years | 5,211 | 4,451 | ||||||||||||
| Over 5 years | 729,030 | 556,052 | ||||||||||||
| Total | $ | 756,186 | $ | 583,616 | ||||||||||
| Insurance contract assets: | ||||||||||||||
Within 1 Year | $ | (633) | $ | (463) | ||||||||||
1 Year to 2 Years | (332) | (323) | ||||||||||||
2 Years to 3 Years | (272) | (276) | ||||||||||||
3 Years to 4 Years | (263) | (248) | ||||||||||||
4 Years to 5 Years | (241) | (225) | ||||||||||||
Over 5 years | (3,935) | (3,305) | ||||||||||||
| Total | $ | (5,676) | $ | (4,840) | ||||||||||
| Reinsurance contract held liabilities: | ||||||||||||||
Within 1 Year | $ | 110 | $ | 140 | ||||||||||
1 Year to 2 Years | 99 | 83 | ||||||||||||
2 Years to 3 Years | 101 | 88 | ||||||||||||
3 Years to 4 Years | 104 | 91 | ||||||||||||
4 Years to 5 Years | 107 | 95 | ||||||||||||
| Over 5 years | 4,769 | 5,036 | ||||||||||||
| Total | $ | 5,290 | $ | 5,533 | ||||||||||
| Reinsurance contract held assets: | ||||||||||||||
Within 1 Year(1) | $ | (847) | $ | (520) | ||||||||||
1 Year to 2 Years | (652) | (54) | ||||||||||||
2 Years to 3 Years | (685) | (69) | ||||||||||||
3 Years to 4 Years | (707) | (105) | ||||||||||||
4 Years to 5 Years | (728) | (130) | ||||||||||||
| Over 5 years | (9,405) | (11,330) | ||||||||||||
| Total | $ | (13,024) | $ | (12,208) | ||||||||||
(1) Includes amounts payable on demand of $5,177 million (2023 - $4,800 million), and $(29) million (2023 - $(33) million) for Insurance contract liabilities and Reinsurance contract held assets, respectively.
80 December 31, 2024 Sun Life Financial Inc. MANAGEMENT'S DISCUSSION & ANALYSIS
Maturity Analysis - Other Financial Liabilities
The following table summarizes the contractual maturities of our significant financial liabilities and contractual commitments other than insurance contracts as at December 31, 2024 and 2023: | |||||||||||||||||||||||||||||||||||
| Financial Liabilities and Contractual Obligations | |||||||||||||||||||||||||||||||||||
December 31, 2024 ($ millions) | Within 1 year | 1 year to 3 years | 3 years to 5 years | Over 5 years | Total | ||||||||||||||||||||||||||||||
Investment contract liabilities(1) | $ | 6,157 | $ | 2,351 | $ | 1,413 | $ | 1,692 | $ | 11,613 | |||||||||||||||||||||||||
Senior debentures and unsecured financing(2) | 2,133 | 28 | 28 | 519 | 2,708 | ||||||||||||||||||||||||||||||
Subordinated debt(2) | 225 | 451 | 585 | 7,248 | 8,509 | ||||||||||||||||||||||||||||||
| Bond repurchase agreements | 2,840 | — | — | — | 2,840 | ||||||||||||||||||||||||||||||
| Accounts payable and accrued expenses | 10,085 | — | — | — | 10,085 | ||||||||||||||||||||||||||||||
Lease liabilities(3) | 166 | 262 | 207 | 421 | 1,056 | ||||||||||||||||||||||||||||||
| Secured borrowings from mortgage securitization | 461 | 758 | 382 | 380 | 1,981 | ||||||||||||||||||||||||||||||
Borrowed funds(2) | 23 | 107 | 244 | 31 | 405 | ||||||||||||||||||||||||||||||
Credit facilities | 2,126 | — | — | — | 2,126 | ||||||||||||||||||||||||||||||
| Total liabilities | $ | 24,216 | $ | 3,957 | $ | 2,859 | $ | 10,291 | $ | 41,323 | |||||||||||||||||||||||||
Contractual commitments:(4) | |||||||||||||||||||||||||||||||||||
| Contractual loans, equities and mortgages | $ | 1,242 | $ | 985 | $ | 576 | $ | 2,054 | $ | 4,857 | |||||||||||||||||||||||||
| Total contractual commitments | $ | 1,242 | $ | 985 | $ | 576 | $ | 2,054 | $ | 4,857 | |||||||||||||||||||||||||
December 31, 2023 ($ millions) | Within 1 year | 1 year to 3 years | 3 years to 5 years | Over 5 years | Total | ||||||||||||||||||||||||||||||
Investment contract liabilities(1) | $ | 5,728 | $ | 2,518 | $ | 1,442 | $ | 1,727 | $ | 11,415 | |||||||||||||||||||||||||
Senior debentures and unsecured financing(2) | 2,347 | 28 | 28 | 533 | 2,936 | ||||||||||||||||||||||||||||||
Subordinated debt(2) | 204 | 410 | 554 | 7,192 | 8,360 | ||||||||||||||||||||||||||||||
| Bond repurchase agreements | 2,705 | — | — | — | 2,705 | ||||||||||||||||||||||||||||||
| Accounts payable and accrued expenses | 8,665 | — | — | — | 8,665 | ||||||||||||||||||||||||||||||
Lease liabilities(3) | 188 | 319 | 228 | 534 | 1,269 | ||||||||||||||||||||||||||||||
| Secured borrowings from mortgage securitization | 306 | 885 | 560 | 535 | 2,286 | ||||||||||||||||||||||||||||||
Borrowed funds(2) | 86 | 103 | 14 | 162 | 365 | ||||||||||||||||||||||||||||||
Credit facilities | 2,330 | — | — | — | 2,330 | ||||||||||||||||||||||||||||||
| Total liabilities | $ | 22,559 | $ | 4,263 | $ | 2,826 | $ | 10,683 | $ | 40,331 | |||||||||||||||||||||||||
Contractual commitments:(4) | |||||||||||||||||||||||||||||||||||
| Contractual loans, equities and mortgages | $ | 39 | $ | 1,199 | $ | 915 | $ | 2,756 | $ | 4,909 | |||||||||||||||||||||||||
| Total contractual commitments | $ | 39 | $ | 1,199 | $ | 915 | $ | 2,756 | $ | 4,909 | |||||||||||||||||||||||||
(1) These amounts represent the undiscounted estimated cash flows of investment contract liabilities on our Consolidated Statements of Financial Position. | |||||||||||||||||||||||||||||||||||
(2) Payments due based on maturity dates and include expected interest payments. Actual redemption of certain securities may occur sooner as some include an option for the issuer to call the security at par at an earlier date. | |||||||||||||||||||||||||||||||||||
(3) Liabilities associated with the lease commitments are included on the Consolidated Statements of Financial Position. | |||||||||||||||||||||||||||||||||||
(4) Contractual commitments are not reported on our Consolidated Statements of Financial Position. Additional information on these commitments is included in Note 22 of our 2024 Annual Consolidated Financial Statements. | |||||||||||||||||||||||||||||||||||
Additional information on liquidity risk can be found in Note 6 of our 2024 Annual Consolidated Financial Statements.
MANAGEMENT'S DISCUSSION & ANALYSIS Sun Life Financial Inc. December 31, 2024 81
vii. Other Risks
International Operations
The future success of our businesses in our international operations depends in large part on our ability to grow and compete in the markets where we operate. Challenges in these markets pose strategic and execution risk including our ability to attract and retain qualified employees and executives with local experience and critical skills, geopolitical, legal, economic, competition or other risks, risks associated with joint venture operations, developing and executing our risk management practices, and our ability to attract, retain, expand and diversify distribution channels.
If we are unable to attract, retain and engage qualified employees and executives with relevant experience and critical business skills, our ability to grow our business in our international operations as quickly as planned may be limited. Competition for qualified employees and distribution partners in our international operations, in particular the Asian markets, continues to be strong and could adversely impact our ability to attract and retain talent.
Our international operations may face geopolitical, legal and regulatory, economic, competitive, operational or other risks that we may not face in our domestic operations. Examples of this type of risk are the risk of changes in regulation, geopolitical risks due to changes in government, discriminatory regulation, political instability, nationalization or expropriation of assets, changes to the maximum level of non-domestic ownership, price controls and exchange controls or other restrictions that could prevent us from transferring funds from these operations out of the countries in which they operate or converting local currencies we hold into Canadian dollars or other currencies.
Capital markets in certain international markets may not have the same depth, liquidity or range of investment options generally available in other markets in which we operate. In particular, the more limited availability of long-duration assets exposes our Asian operations to higher asset-liability management costs and potential risk.
We have entered into joint venture arrangements in certain markets in Asia, where we may have a lesser degree of control over these businesses that may expose us to additional operational, financial, compliance and legal risks. We may be dependent on our joint venture counterparty for capital, product distribution, local market knowledge, or other resources. Our ability to exercise management control or influence over these joint ventures and the success of our investments in them will depend on the cooperation between the joint venture participants and the terms of the joint venture agreements, which allocate control among the joint venture participants. If we are unable to effectively manage these joint ventures, or any joint venture counterparty fails to meet its obligations under the joint venture arrangement, encounters financial difficulty, elects to alter, modify or terminate the relationship, or a joint venture does not comply with local legislation or regulations, we may be unable to achieve our objectives and our results of operations and brand may be negatively impacted.
Capital Adequacy
Capital adequacy risk is the risk that our capital position is not or will not be sufficient to withstand adverse economic conditions, to maintain our financial strength, to allow us and our subsidiaries to support ongoing operations and to take advantage of opportunities for expansion, and to support the risk taking activity in pursuit of our business objectives.
The strength of our capital position depends in part upon the level of and changes in interest rates and equity prices, credit experience, mortality and morbidity experience, currency rate fluctuations and our overall profitability.
Various factors may negatively impact our capital ratios, and may impair our financial position and our ability to execute our business strategies and plans, such as:
•Declining equity markets
•Downgrades in ratings
•Changes in interest rates
•Changes in credit spreads on corporate bonds and asset backed securities
•Lower earnings
•Inability to access capital markets on a timely basis
In addition, regulatory changes being considered by other regulators world-wide may adversely impact the capital of SLF Inc. and its insurance subsidiaries.
Credit and Financial Strength Ratings
Financial strength ratings represent the opinions of rating agencies regarding an insurance company's ability to meet its policy obligations. Credit ratings indicate the opinions of rating agencies regarding an issuer's ability to meet the terms of debt, preferred share and Tier 1 hybrid capital obligations in a timely manner, and are important factors in a company’s overall funding profile and ability to access external capital. A downgrade by a rating agency in the credit ratings of securities issued by SLF Inc. and its subsidiaries or the financial strength ratings of SLF Inc.'s insurance company subsidiaries could adversely affect our financial condition and results of operations.
The financial strength rating of an insurance company is a key competitive factor in marketing its products and in attracting and retaining agents and distributors. If our credit or financial strength ratings are downgraded, our financial condition, competitive position and results of operations could be negatively impacted in many ways, including:
•Reducing new sales of insurance products, annuities and investment products;
•Requiring us to reduce prices for products and services to remain competitive;
•Higher level of surrenders and withdrawals;
•Higher reinsurance costs;
•Increasing our cost of capital and limiting our access to the capital markets, thus reducing our financial flexibility;
•Reducing our ability to enter into normal course derivative or hedging transactions and increasing the costs associated with such transactions; and
•Adversely affecting our relationships with our advisors and third-party distributors of our products.
82 December 31, 2024 Sun Life Financial Inc. MANAGEMENT'S DISCUSSION & ANALYSIS
In addition, downgrades in our credit or financial strength ratings below thresholds specified in certain of our derivative agreements, reinsurance agreements and other agreements could result in the counterparties to those agreements having the right to terminate those agreements or to require that we provide support for those agreements in the form of collateral or letters of credit.
Changes in methodologies and criteria used by rating agencies could also result in downgrades that do not reflect changes in the general economic conditions or our financial condition.
Additional information concerning our ratings is provided in the AIF under the heading Security Ratings.
Tax Matters
The validity and measurement of tax benefits associated with various tax positions taken or expected to be taken in our tax filings are a matter of tax law and are subject to interpretation. Tax laws are complex and their interpretation requires significant judgment. The provision for income taxes reflects management’s interpretation of the relevant tax laws and its best estimate of income tax implications of the transactions and events during the period. There can be a risk that tax authorities could differ in their interpretation of the relevant laws and could assert that tax positions taken by the company give rise to a need for reassessment, including reassessment under specific or general anti-avoidance rules or transfer pricing provisions.
The assessment of additional taxes, interest and penalties or damage to the Company’s reputation could be materially adverse to our future results of operations and financial position.
Under the liability method of accounting for income taxes, deferred tax assets are recognized for the carryforward of unused tax losses and tax credits, as well as amounts that have already been recorded in the financial statements, but will not result in deductible amounts in determining taxable income until future periods. Deferred tax assets are recognized only to the extent of the probability that taxable profit will be available against which the future tax deductions and unused tax losses can be utilized.
At the end of each reporting period, we must assess the value of our deferred tax assets. The determination of our deferred tax assets is dependent upon projections of future taxable profits. Our projections require significant judgments and estimates about future events, including global economic conditions and the future profitability of our businesses. If the profitability of our businesses is lower than our projections or if our outlook diminishes significantly, we may be required to reduce the value of our deferred tax assets. Any change to our deferred tax assets could have a material adverse impact on our future results of operations and financial position.
We are also subject to changing income tax regulations. We currently have an effective income tax rate that is lower than the Canadian statutory income tax rate for corporations. The Company reflects favourable tax impacts in its financial statements from certain tax benefits, including but not limited to tax-exempt or low-taxed investment income, dividends received deductions, tax credits (from certain investments or from taxes paid on foreign source income), and favourable tax rates in certain jurisdictions in which we operate. In addition, many of our life insurance products benefit Clients with preferred tax treatment under various tax regimes. For example life insurance policies and annuity contracts in the U.S. and Canada allow for the deferral or elimination of taxation on earnings (inside buildup) accrued under the policy. There is a risk that tax legislation, administrative guidance or legislative developments could lessen or eliminate some of the benefits currently available to the Company or its policyholders. This risk could result in lower product sales or increased lapses of policies, and could have a material adverse effect on our future results of operations and financial position.
From time to time, governments in countries in which we operate enact changes to statutory corporate income tax rates. A change in income tax rate requires us to review and re-measure our deferred tax assets and liabilities as of the date of substantive enactment. As of December 31, 2024, the Company reported a $3,624 million net deferred tax asset in its Consolidated Statements of Financial Position, primarily in Canada. Any future tax rate reductions in jurisdictions where we carry a net deferred tax asset could result in a reduction in the carrying value of the deferred tax asset and a corresponding income tax expense at the time of substantive enactment of a rate reduction.
The Pillar Two global minimum tax rules apply to us effective January 1, 2024 and have been substantively enacted in several jurisdictions, including Canada, whose Global Minimum Tax Act became enacted in June 2024. The Pillar Two legislation requires the ultimate parent entity of a group to pay top-up tax, on a jurisdiction-by-jurisdiction basis, on profits of its subsidiaries that are taxed below 15%. Our subsidiaries that are currently subject to a statutory tax rate or to a tax regime that could result in taxing profits at a rate below 15% include those in Bermuda, Hong Kong and Ireland. The Pillar Two legislation is expected to increase the effective tax rate on underlying net income by approximately one to two percentage points.
| L. Additional Financial Disclosure | |||||
1. Selected Annual Information
| ($ millions, after-tax, unless otherwise stated) | 2024 | 2023 | 2022 | ||||||||
Total revenue (pre-tax) | 38,633 | 40,774 | 5,769 | ||||||||
| Common shareholders' net income (loss) | 3,049 | 3,086 | 2,871 | ||||||||
| Reported basic earnings per share ($) | 5.27 | 5.27 | 4.90 | ||||||||
| Reported earnings per share (diluted) ($) | 5.26 | 5.26 | 4.89 | ||||||||
| Total assets | 370,721 | 333,241 | 323,608 | ||||||||
MANAGEMENT'S DISCUSSION & ANALYSIS Sun Life Financial Inc. December 31, 2024 83
2. Items related to Statement of Operations
i. Business Group Summary Statements of Operations
| 2024 | 2023 | ||||||||||||||||||||||
| ($ millions) | Canada | U.S. | Asset Management | Asia | Corporate | Total | Total | ||||||||||||||||
| Insurance revenue | 8,778 | 12,296 | — | 1,554 | 9 | 22,637 | 21,356 | ||||||||||||||||
| Investment income (loss) | 5,039 | 316 | 281 | 1,648 | 131 | 7,415 | 11,586 | ||||||||||||||||
| Fee income | 1,771 | 489 | 6,391 | 329 | (399) | 8,581 | 7,832 | ||||||||||||||||
| Revenue | 15,588 | 13,101 | 6,672 | 3,531 | (259) | 38,633 | 40,774 | ||||||||||||||||
| Insurance service expenses | 7,309 | 11,345 | — | 974 | 3 | 19,631 | 18,450 | ||||||||||||||||
| Reinsurance contract held net (income) expense | 4 | (145) | — | 56 | — | (85) | 69 | ||||||||||||||||
| Insurance finance (income) expenses from insurance contracts issued | 3,843 | 63 | — | 1,233 | — | 5,139 | 9,675 | ||||||||||||||||
| Reinsurance finance (income) expenses | 81 | (121) | — | (11) | — | (51) | (59) | ||||||||||||||||
| (Decrease) increase in investment contract liabilities | 390 | — | — | 3 | — | 393 | 331 | ||||||||||||||||
| Other income | — | — | (163) | — | — | (163) | (169) | ||||||||||||||||
| Interest expenses | 262 | 116 | 172 | 105 | 9 | 664 | 552 | ||||||||||||||||
| Operating expenses and commissions | 1,989 | 1,127 | 4,596 | 701 | 353 | 8,766 | 7,995 | ||||||||||||||||
| Total expenses | 13,878 | 12,385 | 4,605 | 3,061 | 365 | 34,294 | 36,844 | ||||||||||||||||
| Income tax expense (benefit) | 395 | 133 | 411 | 124 | (23) | 1,040 | 461 | ||||||||||||||||
| Dividends on preferred shares and distributions on other equity instruments | — | — | — | — | 80 | 80 | 79 | ||||||||||||||||
| Non-controlling interests and participating policyholders' income in net income of subsidiaries | 98 | 27 | 128 | (83) | — | 170 | 304 | ||||||||||||||||
| Reported net income (loss) - Common shareholders | 1,217 | 556 | 1,528 | 429 | (681) | 3,049 | 3,086 | ||||||||||||||||
2024 vs. 2023
Canada
Canada's revenue decreased $1.6 billion in 2024, reflecting lower net investment income primarily from fair value changes of invested assets partially offset by higher insurance revenue.
U.S.
U.S.'s revenue decreased $0.4 billion in 2024, reflecting lower net investment income primarily from fair value changes of invested assets partially offset by higher insurance revenue.
Asset Management
Asset Management's revenue increased $0.5 billion in 2024, driven by higher fee income in MFS and SLC Management.
Asia
Asia's revenue decreased $0.5 billion in 2024, reflecting lower net investment income primarily from fair value changes of invested assets, partially offset by higher insurance revenue.
Corporate
Corporate's loss of $0.3 billion in 2024 compared to a loss of $0.1 billion in 2023, primarily from the sale of Sun Life UK in Q2'23.
ii. Revenue
Revenues are primarily derived from life and health insurance, investment management and annuities, and mutual funds, as well as Corporate investments and earnings on capital not attributed to a strategic business segment. Total revenue is comprised of: (i) insurance revenue; (ii) net investment income; and (iii) fee income. Total revenue excludes investment result for insurance contracts for account of segregated fund holders.
Insurance revenue is comprised of the portion of premiums that cover expected claims and directly attributable expenses in the period, as well as the release of risk adjustment and the amortization of CSM for the period. Insurance revenue excludes the portion of premiums that cover repayment of investment components.
Net investment income is comprised of interest income, dividends, realized and unrealized gains and losses, and other investment income earned on general fund assets. Net investment income, such as net rental income, fair value changes, and foreign exchange gains (losses) are also earned from non-financial instruments. Net investment income can experience volatility arising from the quarterly fluctuation in the
84 December 31, 2024 Sun Life Financial Inc. MANAGEMENT'S DISCUSSION & ANALYSIS
value of FVTPL assets and foreign currency changes on assets and liabilities, which may in turn affect the comparability of revenue from period to period. The change in fair value of FVTPL assets is driven largely by market-related factors such as interest rates, credit spreads and equity returns. The debt and equity securities that support insurance contract liabilities are generally designated or classified as FVTPL and changes in fair values of these assets are recorded in net investment income in our Consolidated Statements of Operations. Changes in the fair values of the FVTPL assets supporting insurance contract liabilities are largely offset by a corresponding change in the liabilities excluding those for account of segregated fund holders.
Fee income includes distribution fees, fund management and other asset-based fees, primarily earned in the Asset Management segment. Fee income also includes administrative service and other fees primarily earned in the Canada and U.S. segments. Premium and deposit equivalents from administrative services only ("ASO"), as well as deposits received by the Company on investment contracts such as segregated funds, mutual funds and managed funds are not included in revenue; however, the Company does receive fee income from these contracts, which is included in revenue. Fee income and ASO premium and deposit equivalents are an important part of our business and as a result, revenue does not fully represent sales and other activity taking place during the respective periods.
| ($ millions) | 2024 | 2023 | ||||||
| Insurance revenue | ||||||||
| Annuities | 2,395 | 2,258 | ||||||
| Life insurance | 5,620 | 5,356 | ||||||
| Health insurance | 14,622 | 13,742 | ||||||
| Total insurance revenue | 22,637 | 21,356 | ||||||
| Net Investment income (loss) | 7,415 | 11,586 | ||||||
| Fee income | 8,581 | 7,832 | ||||||
| Total revenue | 38,633 | 40,774 | ||||||
2024 vs. 2023
Total revenue decreased by $2.1 billion, reflecting lower net investment income primarily from fair value changes of invested assets partially offset by higher insurance revenue. Foreign exchange translation increased revenue by $0.3 billion. By business group, revenue reflected lower net investment income in Canada, the U.S., and Asia, partially offset by higher insurance revenue primarily in Canada, the U.S, and Asia.
Insurance revenue increased $1.3 billion, primarily driven by higher insurance revenue in Canada, the U.S and Asia.
Net investment income decreased $4.2 billion primarily from fair value changes of invested assets reflecting the impact of interest rates.
Fee income increased $0.7 billion driven by higher fee income in MFS, SLC Management and in our other wealth and asset management businesses.
iii. Expenses
| ($ millions) | 2024 | 2023 | ||||||
| Expenses | ||||||||
| Insurance service expenses | 19,631 | 18,450 | ||||||
Reinsurance contract held net (income) expense | (85) | 69 | ||||||
Insurance finance (income) expenses from insurance contracts issued | 5,139 | 9,675 | ||||||
Reinsurance finance (income) expenses | (51) | (59) | ||||||
(Decrease) increase in investment contract liabilities | 393 | 331 | ||||||
Other income | (163) | (169) | ||||||
| Interest expenses | 664 | 552 | ||||||
| Operating expenses and commissions | 8,766 | 7,995 | ||||||
| Total expenses | 34,294 | 36,844 | ||||||
Total expenses of $34.3 billion decreased $2.6 billion in 2024 compared to the prior year, primarily driven by lower insurance finance expenses from insurance contracts issued partially offset by higher insurance service expenses.
Insurance service expenses of $19.6 billion increased $1.2 billion in 2024 compared to the prior year, primarily driven by increases in the U.S. and Canada.
Reinsurance contract held net income of $0.1 billion compared to $0.1 billion net expense in the prior year, primarily driven by Canada.
Insurance finance expenses from insurance contracts issued of $5.1 billion decreased $4.5 billion in 2024, primarily driven by Canada, the U.S. and Asia.
Other income of $163 million in 2024 primarily relates to the early termination of a distribution agreement in Asset Management, compared to prior year other income of $169 million relating to the sale of Sun Life UK and the sale of the sponsored markets business in Canada. For additional information, refer to Note 3 of our 2024 Annual Consolidated Financial Statements.
Interest expenses of $0.7 billion increased $0.1 billion in 2024 compared to the prior year, primarily driven by Canada.
MANAGEMENT'S DISCUSSION & ANALYSIS Sun Life Financial Inc. December 31, 2024 85
Operating expenses and commissions of $8.8 billion increased $0.8 billion in 2024 compared to the prior year, primarily driven by higher expenses across all businesses, and $85 million of unfavourable foreign exchange translation. For additional information, see Note 17 of our 2024 Annual Consolidated Financial Statements.
iv. Taxes
Income Taxes
In 2024, we had an income tax expense of $1,040 million on reported net income before taxes of $4,339 million, which resulted in an effective income tax rate of 24.0% (2023 - $461 million, $3,930 million, and 11.7%, respectively).
On an underlying basis(1), in 2024, we had an income tax expense of $834 million on our underlying net income before taxes of $4,831 million, representing an effective income tax rate of 17.3% which is within our expected range of 16% to 22% (2023 - $811 million, $4,685 million, and 17.3%, respectively).
See section D - Profitability - 5 - Income taxes in this document for additional information on our effective tax rates.
3. Items related to Statements of Financial Position
i. Changes in items related to the Statement of Financial Position
Total general fund assets were $221.9 billion as at December 31, 2024 (December 31, 2023 - $204.8 billion), primarily driven by general operating activities and favourable impacts from foreign exchange translation.
The net liabilities balance for insurance contracts issued(2) was $146.9 billion as at December 31, 2024 (December 31, 2023 - $135.5 billion), primarily driven by cash flows, insurance finance income and expenses and foreign currency translation, partially offset by the change in insurance service result.
Total shareholders' equity, including preferred shares and other equity instruments, is $25.6 billion as at December 31, 2024
(December 31, 2023 - $23.6 billion). The change in total shareholders' equity included:
(December 31, 2023 - $23.6 billion). The change in total shareholders' equity included:
(i)total shareholders' net income of $3,129 million, before preferred share dividends of $80 million; and
(ii)favourable impacts from foreign exchange translation of $1,346 million included in OCI; partially offset by
(iii)common share dividend payments of $1,875 million; and
(iv)a decrease of $855 million from the repurchase and cancellation of common shares.
As at January 31, 2025, SLF Inc. had 572,857,568 common shares, 3,049,926 options to acquire SLF Inc. common shares, and 52,200,000 Class A Shares outstanding.
ii. Off-Balance Sheet Arrangements
In the normal course of business, we are engaged in a variety of financial arrangements. The principal purposes of these arrangements are to earn management fees and additional spread on a matched book of business and to reduce financing costs.
While most of these activities are reflected on our balance sheet with respect to assets and liabilities, certain of them are either not recorded on our balance sheet or are recorded on our balance sheet in amounts that differ from the full contract or notional amounts. The types of off-balance sheet activities we undertake primarily include asset securitizations and securities lending. For more information, see Note 5 in our 2024 Annual Consolidated Financial Statements.
iii. Goodwill and Intangibles Impairment
The Company completed its annual goodwill and indefinite life intangible asset impairment testing in the fourth quarter of 2024. No impairment charges on goodwill were recognized in 2024 and 2023. Impairment charges on intangible assets of $201 million were recognized in 2024 (2023 - $5 million), primarily related to an intangible asset related to bancassurance in Vietnam reflecting updates resulting from changes in regulatory and macro-economic factors.
iv. Commitments, Guarantees, Contingencies and Reinsurance Matters
In the normal course of business, we enter into leasing agreements, outsourcing arrangements and agreements involving indemnities to third parties. We are also engaged in arbitration proceedings from time to time with certain companies that have contracts to provide reinsurance to the Company. Information regarding our commitments, guarantees and contingencies are summarized in Note 22 of our 2024 Annual Consolidated Financial Statements. A table summarizing our significant financial liabilities and contractual obligations can be found in this MD&A in the section K - Risk Management - 9 - Risk Categories - vi - Liquidity Risk.
(1)Our effective income tax rate on underlying net income is calculated using underlying net income and income tax expense associated with underlying net income, which excludes amounts attributable to participating policyholders.
(2)For more information about the changes in the net insurance contract liabilities, refer to Note 10 of the 2024 Annual Consolidated Financial Statements.
86 December 31, 2024 Sun Life Financial Inc. MANAGEMENT'S DISCUSSION & ANALYSIS
4. Fourth Quarter 2024 Profitability
The following table reconciles our Common shareholders' net income ("reported net income") and underlying net income in the fourth quarter of 2024 and 2023. All factors discussed in this document that impact underlying net income are also applicable to reported net income. Certain adjustments and notable items also impact the CSM, such as mortality experience and assumption changes; see section
F - Contractual Service Margin in this document for more information.
F - Contractual Service Margin in this document for more information.
| ($ millions, after-tax) | Q4'24 | Q4'23 | ||||||
Underlying net income (loss) by business type(1): | ||||||||
| Wealth & asset management | 486 | 439 | ||||||
| Group - Health & Protection | 266 | 365 | ||||||
| Individual - Protection | 339 | 284 | ||||||
| Corporate expenses & other | (126) | (105) | ||||||
Underlying net income(1) | 965 | 983 | ||||||
Add: Market-related impacts | (179) | (193) | ||||||
Assumption changes and management actions | 11 | (1) | ||||||
Other adjustments | (560) | (40) | ||||||
| Reported net income - Common shareholders | 237 | 749 | ||||||
Underlying ROE(1) | 16.5% | 18.4% | ||||||
Reported ROE(1) | 4.0% | 14.0% | ||||||
Notable items attributable to reported and underlying net income(1): | ||||||||
| Mortality | 10 | (5) | ||||||
| Morbidity | (22) | 91 | ||||||
Lapse and other policyholder behaviour | — | (11) | ||||||
| Expenses | (10) | (26) | ||||||
Credit(2) | (34) | (18) | ||||||
Other(3) | 16 | (2) | ||||||
(1)Represents a non-IFRS financial measure. For more details, see section M - Non-IFRS Financial Measures in this document. For more information about business types in Sun Life's business groups, see section A - How We Report Our Results in this document.
(2)Credit includes rating changes on assets measured at FVTPL, and the ECL impact for assets measured at FVOCI.
(3)Other notable items are recorded in Net Insurance Service Result and Net Investment Result in the Drivers of Earnings analysis. For more details, see section M - Non-IFRS Financial Measures in this document.
Quarterly Comparison - Q4'24 vs. Q4'23
Underlying net income(1) of $965 million decreased $18 million or 2%, driven by:
•Wealth & asset management(1) up $47 million: Higher fee income in Asset Management, Canada, and Asia, partially offset by lower net investment results in Canada.
•Group - Health & Protection(1)(2) down $99 million: Unfavourable morbidity experience in U.S. medical stop-loss and less favourable morbidity experience in Canada, partially offset by business growth in Canada.
•Individual - Protection(1)(2) up $55 million: Improved protection experience in Asia and Canada and higher contributions from joint ventures in Asia.
•Corporate expenses & other(1) $(21) million increase in net loss primarily reflecting higher expenses largely from continued investments in our Asia businesses and incentive compensation in Asia.
Reported net income of $237 million decreased $512 million or 68%, driven by:
•Lower tax-exempt investment income of $234 million in Corporate;
•An impairment charge of $186 million on an intangible asset related to bancassurance in Vietnam reflecting updates resulting from changes in regulatory and macro-economic factors; and
•A non-recurring provision in U.S. Dental; partially offset by
•Market-related impacts primarily reflecting improved real estate experience(3).
Foreign exchange translation led to an increase of $16 million in underlying net income and an increase of $17 million in reported net income.
(1)Refer to section D - Profitability in this document for more information on notable items attributable to reported and underlying net income items and section M - Non-IFRS Financial Measures in this document for a reconciliation between reported net income and underlying net income. For more information about the business types in Sun Life's operating segments/business groups, see section A - How We Report Our Results in this document.
(2)Effective Q1'24, reflects a refinement in the allocation methodology for expenses from Individual - Protection to Group - Health & Protection business types in the U.S. business group.
(3)Real estate experience reflects the difference between the actual value of real estate investments compared to management's longer-term expected returns supporting insurance contract liabilities ("real estate experience").
MANAGEMENT'S DISCUSSION & ANALYSIS Sun Life Financial Inc. December 31, 2024 87
The Q4'24 effective income tax rate(1) on underlying net income and reported net income was 17.4% and 63.2% respectively. The effective income tax rate on reported net income reflects the non-deductible impairment charge on an intangible asset in Vietnam as well as lower tax-exempt investment income.
Performance by Business Group - Fourth Quarter
We manage our operations and report our financial results in five business segments. The following section describes the operations and financial performance of Asset Management, Canada, U.S., Asia and Corporate.
The following table sets out the differences between our underlying net income (loss) and reported net income (loss) by business group.
Q4'24 | ||||||||||||||||||||
| ($ millions) | Asset Management | Canada | U.S. | Asia | Corporate | Total | ||||||||||||||
| Underlying net income (loss) | 360 | 366 | 161 | 175 | (97) | 965 | ||||||||||||||
| Add: Market-related impacts (pre-tax) | (18) | (142) | (74) | 27 | (14) | (221) | ||||||||||||||
| ACMA (pre-tax) | — | (1) | (1) | 15 | — | 13 | ||||||||||||||
| Other adjustments (pre-tax) | (34) | (8) | (143) | (193) | — | (378) | ||||||||||||||
Tax expense (benefit) | 18 | 38 | 50 | (13) | (235) | (142) | ||||||||||||||
| Reported net income (loss) - Common shareholders | 326 | 253 | (7) | 11 | (346) | 237 | ||||||||||||||
Q4'23 | ||||||||||||||||||||
| Underlying net income (loss) | 331 | 350 | 253 | 143 | (94) | 983 | ||||||||||||||
Add: Market-related impacts (pre-tax) | (11) | (223) | (60) | (142) | — | (436) | ||||||||||||||
| ACMA (pre-tax) | — | 72 | (65) | (1) | — | 6 | ||||||||||||||
| Other adjustments (pre-tax) | (39) | (6) | (65) | (8) | — | (118) | ||||||||||||||
Tax expense (benefit) | 16 | 155 | 38 | 52 | 53 | 314 | ||||||||||||||
| Reported net income (loss) - Common shareholders | 297 | 348 | 101 | 44 | (41) | 749 | ||||||||||||||
Quarterly Comparison - Q4'24 vs. Q4'23
Asset Management
Asset Management underlying net income of $360 million increased $29 million or 9% driven by:
•MFS up $40 million (up US$25 million): Higher fee income from higher average net assets ("ANA") partially offset by higher expenses. The MFS pre-tax net operating profit margin(2) improved to 40.5% for Q4'24, compared to 39.4% in the prior year.
•SLC Management down $11 million: Lower fee-related earnings mostly offset by higher net seed investment income. Fee-related earnings(2) decreased 14% reflecting higher expenses primarily from incentive compensation, partially offset by higher AUM driven by strong capital raising and deployment across the platform. Fee-related earnings margin(2) was 23.0% for Q4'24, compared to 24.2% in the prior year.
Asset Management reported net income of $326 million increased $29 million or 10%, driven by the increase in underlying net income.
Foreign exchange translation led to an increase of $8 million in underlying and reported net income, respectively.
Canada
Underlying net income of $366 million increased $16 million or 5%, reflecting:
•Wealth & asset management up $9 million: Business growth and higher fee income driven by higher AUM largely offset by lower net investment results, including unfavourable credit experience.
•Group - Health & Protection down $6 million: Business growth and higher investment results more than offset by less favourable morbidity experience reflecting higher claims volumes and longer claims durations.
•Individual - Protection up $13 million: Favourable mortality experience driven by lower claims, and higher investment results.
•Lower earnings on surplus across all businesses primarily reflecting lower net interest income.
Reported net income of $253 million decreased $95 million or 27%, reflecting market-related and ACMA impacts. The market-related impacts were primarily from unfavourable interest rate impacts partially offset by improved real estate experience.
(1)Our effective income tax rate on reported net income is calculated using Total income (loss) before income taxes, as detailed in Note 19 in our 2024 Annual Consolidated Financial Statements. Our effective income tax rate on underlying net income is calculated using pre-tax underlying net income, as detailed in section M - Non-IFRS Financial Measures in this document, and the associated income tax expense.
(2)Represents a non-IFRS financial measure. For more details, see section M - Non-IFRS Financial Measures in this document.
88 December 31, 2024 Sun Life Financial Inc. MANAGEMENT'S DISCUSSION & ANALYSIS
U.S.
Underlying net income of US$115 million decreased US$72 million or 39%, driven by:
•Group - Health & Protection(1) down US$71 million: Unfavourable morbidity experience in medical stop-loss driven by claims severity.
•Individual - Protection(1) down US$1 million: In line with the prior year.
Reported net loss was US$1 million compared to reported net income of US$77 million in the prior year, reflecting the decrease in underlying net income and a non-recurring provision in Dental, partially offset by ACMA impacts. Unfavourable interest rate impacts were mostly offset by improved real estate experience.
Foreign exchange translation led to an increase of $4 million in underlying net income and an increase of $1 million in reported net loss.
Asia
Underlying net income of $175 million increased $32 million or 22%, driven by:
•Wealth & asset management up $9 million: Higher fee income primarily driven by higher AUM.
•Individual - Protection up $41 million: Improved protection experience and higher contributions from joint ventures.
•Regional office expenses & other $(18) million increased net loss reflecting continued investments in the business across the region and higher incentive compensation.
Reported net income of $11 million decreased $33 million or 75%, driven by an impairment charge on an intangible asset related to bancassurance in Vietnam reflecting updates resulting from changes in regulatory and macro-economic factors, partially offset by market-related impacts and the increase in underlying net income. The market-related impacts were primarily from favourable interest rate impacts and improved real estate experience.
Foreign exchange translation led to an increase of $4 million in underlying net income and an increase of $6 million in reported net income.
Corporate
Underlying net loss was $97 million, in line with prior year's underlying net loss of $94 million.
Reported net loss was $346 million compared to reported net loss of $41 million in the prior year, reflecting lower tax exempt investment income.
5. Fourth Quarter 2024 Growth
Revenue of $7.5 billion decreased $11.2 billion compared to the same period in 2023, primarily reflecting fair value changes in invested assets driven by rising interest rates. Foreign exchange translation increased revenue by $103 million.
(1)Effective Q1'24, reflects a refinement in the allocation methodology for expenses from Individual - Protection to Group - Health & Protection business types in the U.S. business group.
MANAGEMENT'S DISCUSSION & ANALYSIS Sun Life Financial Inc. December 31, 2024 89
6. Quarterly Financial Results
The following table provides a summary of our results for the eight most recently completed quarters. A more complete discussion of our historical quarterly results can be found in our Interim and Annual MD&A for the relevant periods.
| Quarterly results | ||||||||||||||||||||||||||
| ($ millions, unless otherwise noted) | Q4'24 | Q3'24 | Q2'24 | Q1'24 | Q4'23 | Q3'23 | Q2'23 | Q1'23 | ||||||||||||||||||
| Total revenue | 7,509 | 15,333 | 8,916 | 6,875 | 18,684 | 2,439 | 7,668 | 11,983 | ||||||||||||||||||
| Common shareholders' net income (loss) | ||||||||||||||||||||||||||
Underlying net income(1) | 965 | 1,016 | 1,000 | 875 | 983 | 930 | 920 | 895 | ||||||||||||||||||
Add: Market-related impacts | (179) | 29 | (153) | (70) | (193) | 23 | (220) | (64) | ||||||||||||||||||
| ACMA | 11 | 36 | 16 | (7) | (1) | 35 | 7 | (5) | ||||||||||||||||||
Other adjustments | (560) | 267 | (217) | 20 | (40) | (117) | (47) | (20) | ||||||||||||||||||
Reported net income - Common shareholder | 237 | 1,348 | 646 | 818 | 749 | 871 | 660 | 806 | ||||||||||||||||||
| Diluted EPS ($) | ||||||||||||||||||||||||||
Underlying(1) | 1.68 | 1.76 | 1.72 | 1.50 | 1.68 | 1.59 | 1.57 | 1.52 | ||||||||||||||||||
Reported | 0.41 | 2.33 | 1.11 | 1.40 | 1.28 | 1.48 | 1.12 | 1.37 | ||||||||||||||||||
| Basic reported EPS ($) | ||||||||||||||||||||||||||
| Reported | 0.41 | 2.33 | 1.11 | 1.40 | 1.28 | 1.49 | 1.12 | 1.37 | ||||||||||||||||||
Underlying net income (loss) by segment(1) | ||||||||||||||||||||||||||
| Asset Management | 360 | 344 | 307 | 282 | 331 | 330 | 296 | 282 | ||||||||||||||||||
| Canada | 366 | 375 | 402 | 310 | 350 | 338 | 372 | 316 | ||||||||||||||||||
| U.S. | 161 | 219 | 204 | 189 | 253 | 185 | 215 | 237 | ||||||||||||||||||
| Asia | 175 | 170 | 179 | 177 | 143 | 166 | 150 | 141 | ||||||||||||||||||
| Corporate | (97) | (92) | (92) | (83) | (94) | (89) | (113) | (81) | ||||||||||||||||||
Total underlying net income (loss)(1) | 965 | 1,016 | 1,000 | 875 | 983 | 930 | 920 | 895 | ||||||||||||||||||
Add: Market-related impacts (pre-tax) | (221) | (12) | (169) | (26) | (436) | 107 | (298) | (99) | ||||||||||||||||||
| ACMA (pre-tax) | 13 | 63 | 18 | (8) | 6 | 41 | 11 | (5) | ||||||||||||||||||
Other adjustments (pre-tax) | (378) | 246 | (254) | 41 | (118) | (156) | (89) | (10) | ||||||||||||||||||
| Tax expense (benefit) on above items | (142) | 35 | 51 | (64) | 314 | (51) | 116 | 25 | ||||||||||||||||||
Reported net income (loss) by segment - Common shareholders | ||||||||||||||||||||||||||
Asset Management | 326 | 644 | 274 | 284 | 297 | 268 | 248 | 254 | ||||||||||||||||||
Canada | 253 | 382 | 292 | 290 | 348 | 365 | 210 | 329 | ||||||||||||||||||
U.S. | (7) | 339 | 127 | 97 | 101 | 132 | 175 | 168 | ||||||||||||||||||
Asia | 11 | 32 | 151 | 235 | 44 | 211 | 122 | 134 | ||||||||||||||||||
Corporate | (346) | (49) | (198) | (88) | (41) | (105) | (95) | (79) | ||||||||||||||||||
Total reported net income (loss) - Common shareholders | 237 | 1,348 | 646 | 818 | 749 | 871 | 660 | 806 | ||||||||||||||||||
(1)Represents a non-IFRS financial measure. For more details, see section M - Non-IFRS Financial Measures in this document.
Third Quarter 2024
Underlying net income of $1,016 million increased $86 million or 9%, driven by:
•Wealth & asset management up $17 million: Higher fee income in Asset Management, Asia, and Canada, partially offset by unfavourable credit experience in Canada.
•Group - Health & Protection up $60 million: Strong business growth in U.S. Group Benefits and Canada, higher fee-based income in Canada, and improved group life mortality experience in the U.S., partially offset by lower U.S. Dental results.
•Individual - Protection up $9 million: Business growth in Asia and Canada partially offset by unfavourable mortality experience in Asia.
•Corporate expenses & other were in line with prior year.
Reported net income of $1,348 million increased $477 million or 55%, driven by a decrease in SLC Management's estimated acquisition-related liabilities and the increase in underlying net income. Favourable equity market impacts and improved real estate experience were offset by interest rate impacts.
90 December 31, 2024 Sun Life Financial Inc. MANAGEMENT'S DISCUSSION & ANALYSIS
Second Quarter 2024
Underlying net income of $1,000 million increased $80 million or 9%, driven by:
•Wealth & asset management up $36 million: Higher fee income in Asset Management, Canada, and Asia, partially offset by higher expenses in Asset Management.
•Group - Health & Protection down $55 million: Lower results in U.S. Dental primarily reflecting the impact of Medicaid redeterminations and related claims following the end of the Public Health Emergency, less favourable morbidity experience in Canada, and unfavourable morbidity experience in U.S. medical stop-loss, partially offset by strong business growth in U.S. Group Benefits and Canada.
•Individual - Protection up $82 million: Business growth in Asia and Canada, and favourable mortality experience in Canada and the U.S.
•Corporate expenses & other $17 million decrease in net loss driven by lower operating expenses and financing costs.
Reported net income of $646 million decreased $14 million or 2%. Financial discipline remains core to our Client Impact Strategy and business. In Q2'24, we recorded a restructuring charge of $138 million (post-tax $108 million) reflecting actions taken to improve productivity and drive earnings growth at the higher-end of our Medium-Term Financial Objectives. We expect these actions to result in annual savings of approximately $200 million (pre-tax) by 2026. The restructuring charge is offset by the increase in underlying net income; and market-related impacts primarily reflecting interest rates and real estate investments.
First Quarter 2024
Underlying net income of $875 million decreased $20 million from prior year, driven by:
•Wealth & asset management down $3 million: Higher fee income offset by higher expenses in Asset Management, as well as lower net seed investment income in SLC Management.
•Group - Health & Protection down $23 million: Less favourable morbidity experience in U.S. medical stop-loss and lower results in U.S. Dental primarily reflecting the impact of Medicaid redeterminations following the end of the Public Health Emergency, partially offset by strong revenue growth in U.S. Group Benefits, and business growth and improved disability experience in Canada.
•Individual - Protection down $13 million: Lower earnings due to the sale of Sun Life UK partially offset by business growth in Asia.
•Corporate expenses & other $19 million decrease in net loss driven by lower financing costs.
Reported net income of $818 million increased $12 million from prior year, driven by the gains on partial sale of ABSLAMC and the early termination of a distribution agreement in Asset Management, largely offset by the prior year gain on sale of the sponsored markets business in Canada, fair value changes in management's ownership of MFS shares, and the decrease in underlying net income. Unfavourable real estate experience was mostly offset by favourable interest rate impacts.
Fourth Quarter 2023
Underlying net income of $983 million increased $91 million or 10% from prior year, driven by:
•Wealth & asset management up $27 million: Higher Asset Management fee-related earnings and higher investment income driven by volume growth and an increase in yields.
•Group - Health & Protection up $44 million: Business premium growth in the U.S. and Canada, improved disability experience in Canada, and higher investment contributions in the U.S., partially offset by lower results in U.S. Dental.
•Individual - Protection up $53 million: Business growth reflecting good sales momentum in Asia, and higher investment contributions in Canada, partially offset by lower earnings due to the sale of Sun Life UK.
•Corporate expenses & other $(33) million increase in net loss driven by higher operating expenses reflecting business growth and continued investments in the business, partially offset by a lower effective tax rate.
•Higher earnings on surplus primarily driven by higher net interest income and lower realized losses.
Reported net income of $749 million decreased $416 million or 36%, driven by unfavourable market-related impacts primarily reflecting interest rates and real estate experience, the prior year impact of the Canada Tax Rate Change, and fair value changes in management's ownership of MFS shares; partially offset by the increase in underlying net income, the impact of the Bermuda Corporate Income Tax Change; and lower DentaQuest integration costs.
Third Quarter 2023
Underlying net income of $930 million decreased $19 million or 2%, driven by:
•Wealth & asset management up $38 million: Higher investment income driven by volume growth and an increase in yields, and higher Asset Management fee-related earnings.
•Group - Health & Protection up $4 million: Strong revenue growth across all U.S. businesses and better disability experience in Canada, largely offset by health and protection experience in the U.S., and lower fee-related earnings in Canada.
•Individual - Protection down $8 million: Lower earnings due to the sale of Sun Life UK, and lower net investment results in the U.S., partially offset by business growth reflecting good sales momentum during the past year in Asia.
•Corporate expenses & other $(53) million increase in net loss includes higher debt financing costs.
•Higher expenses across business types were driven by volume growth, continued investments in the business, and higher incentive compensation.
Reported net income of $871 million increased $760 million, driven by favourable market-related impacts primarily reflecting interest rates partially offset by real estate experience, a $170 million charge related to the sale of Sun Life UK and a higher increase in SLC Management's acquisition-related liabilities in the prior year, and ACMA impacts; partially offset by fair value changes in management's ownership of MFS shares.
MANAGEMENT'S DISCUSSION & ANALYSIS Sun Life Financial Inc. December 31, 2024 91
Second Quarter 2023
Underlying net income of $920 million increased $112 million or 14%, driven by:
•Wealth & asset management down $1 million: Higher investment income driven by volume growth and an increase in yields was largely offset by lower fee-based earnings in MFS, reflecting equity market declines over the past year, as well as higher expenses in Canada.
•Group - Health & Protection up $122 million: Strong performance driven by good premium growth and better disability experience in Canada and the U.S., as well as a full quarter of DentaQuest contributions.
•Individual - Protection up $50 million: Higher premiums reflecting good sales momentum during the past year in Asia, and improved insurance experience in Canada and the U.S.
•Corporate expenses & other $(59) million increased net loss driven by higher operating expenses including incentive compensation and an increase in debt financing costs.
•Higher earnings on surplus reflecting an increase in realized gains and net interest income from higher rates.
Reported net income of $660 million decreased $270 million or 29%, driven by market-related impacts primarily reflecting interest rates and real estate investments, the prior year gain on the sale-leaseback of the Wellesley office in the U.S., and fair value changes in management's ownership of MFS shares; partially offset by the increase in underlying net income.
First Quarter 2023
Underlying net income of $895 million increased $175 million or 24%, driven by:
•Wealth & asset management down $11 million: Lower fee-based earnings in MFS, Canada, and Asia, reflecting equity market declines, largely offset by an increase in investment income driven by higher volumes and yields.
•Group - Health & Protection up $180 million: Strong performance including premium growth, improved disability in Canada and the U.S., strong medical stop-loss margins, and improved U.S. mortality. DentaQuest results also contributed to the increase.
•Individual - Protection up $42 million: Higher premiums reflecting good sales momentum during the past year, and improved mortality in Asia.
•Corporate Support & other $(36) million increased net loss: Higher operating expenses including long-term incentive compensation and IFRS 17 project spend, as well as an increase in debt financing costs.
•Higher investment income reflecting an increase in realized gains from surplus assets and net interest income from higher rates.
Reported net income of $806 million increased $141 million or 21%, driven by the increase in underlying net income and gain on the sale of the sponsored markets business in Canada, partially offset by market-related impacts, and DentaQuest integration and SLC Management acquisition-related costs.
92 December 31, 2024 Sun Life Financial Inc. MANAGEMENT'S DISCUSSION & ANALYSIS
| M. Non-IFRS Financial Measures | |||||
1. Common Shareholders' View of Reported Net Income
The following table provides the reconciliation of the Drivers of Earnings ("DOE") analysis to the Statement of Operations total net income. The DOE analysis provides additional detail on the sources of earnings, primarily for protection and health businesses, and explains the actual results compared to the longer term expectations. The underlying DOE and reported DOE are both presented on a common shareholders' basis by removing the allocations to participating policyholders.
| ($ millions) | 2024 | |||||||||||||||||||
| Statement of Operations | Underlying DOE(1) | Non-underlying adjustments(1) | Common Shareholders' Reported DOE(2)(3) | Adjustment for: | Reported (per IFRS) | |||||||||||||||
Par(2) | Net(3) | |||||||||||||||||||
| Net insurance service result | 2,996 | — | 2,996 | 243 | (148) | 3,091 | ||||||||||||||
| Net investment result | 1,677 | (310) | 1,367 | (97) | 664 | 1,934 | ||||||||||||||
ACMA(3) | 86 | 86 | — | (86) | ||||||||||||||||
| Fee Income: | ||||||||||||||||||||
| Asset Management | 1,762 | 250 | 2,012 | (2,012) | ||||||||||||||||
| Other fee income | 321 | — | 321 | (18) | 8,278 | 8,581 | ||||||||||||||
| Fee income | 8,581 | |||||||||||||||||||
| Other expenses | (1,925) | (701) | (2,626) | — | (6,641) | (9,267) | ||||||||||||||
| Income before taxes | 4,831 | (675) | 4,156 | 128 | 55 | 4,339 | ||||||||||||||
| Income tax (expense) benefit | (834) | (120) | (954) | (86) | — | (1,040) | ||||||||||||||
| Total net income | 3,997 | (795) | 3,202 | 42 | 55 | 3,299 | ||||||||||||||
Allocated to Participating and NCI(4) | (61) | (12) | (73) | (42) | (55) | (170) | ||||||||||||||
Dividends and Distributions(5) | (80) | — | (80) | — | — | (80) | ||||||||||||||
Underlying net income(1) | 3,856 | |||||||||||||||||||
| Reported net income - Common shareholders | (807) | 3,049 | — | — | 3,049 | |||||||||||||||
| ($ millions) | 2023 | |||||||||||||||||||
| Statement of Operations | Underlying DOE(1) | Non-underlying adjustments(1) | Common Shareholders' Reported DOE(2)(3) | Adjustment for: | Reported (per IFRS) | |||||||||||||||
Par(2) | Net(3) | |||||||||||||||||||
| Net insurance service result | 2,979 | (29) | 2,950 | 149 | (262) | 2,837 | ||||||||||||||
| Net investment result | 1,710 | (682) | 1,028 | 94 | 517 | 1,639 | ||||||||||||||
ACMA(3) | 53 | 53 | — | (53) | ||||||||||||||||
| Fee income: | ||||||||||||||||||||
| Asset Management | 1,677 | (270) | 1,407 | (1,407) | ||||||||||||||||
| Other fee income | 247 | 12 | 259 | (15) | 7,588 | 7,832 | ||||||||||||||
| Fee income | 7,832 | |||||||||||||||||||
| Other expenses | (1,928) | (167) | (2,095) | — | (6,283) | (8,378) | ||||||||||||||
| Income before taxes | 4,685 | (1,083) | 3,602 | 228 | 100 | 3,930 | ||||||||||||||
| Income tax (expense) benefit | (811) | 404 | (407) | (50) | (4) | (461) | ||||||||||||||
| Total net income | 3,874 | (679) | 3,195 | 178 | 96 | 3,469 | ||||||||||||||
Allocated to Participating and NCI(4) | (67) | 37 | (30) | (178) | (96) | (304) | ||||||||||||||
Dividends and Distributions(5) | (79) | — | (79) | — | — | (79) | ||||||||||||||
Underlying net income(1) | 3,728 | |||||||||||||||||||
| Reported net income - Common shareholders | (642) | 3,086 | — | — | 3,086 | |||||||||||||||
(1)For a breakdown of non-underlying adjustments made to arrive at underlying net income as well as the underlying DOE analysis, see the heading "Underlying Net Income and Underlying EPS" below.
(2)Removes the components attributable to the participating policyholders.
(3)Certain amounts within the Drivers of Earnings are presented on a net basis to reflect how the business is managed, compared to a gross basis in the Consolidated Financial Statements. For more details, refer to "Drivers of Earnings" in section 3 - Additional Non-IFRS Financial Measures. For example, in this document, the reported net income impact of ACMA is shown in aggregate for Net insurance service result and Net investment result, and excludes amounts attributable to participating policyholders and includes non-liability impacts. In contrast, Note 10.B.v of the 2024 Annual Consolidated Financial Statements shows the pre-tax net income impacts of method and assumption changes in aggregate, and CSM Impacts include amounts attributable to participating policyholders.
(4)Allocated to equity in the participating account and attributable to non-controlling interests.
(5)Dividends on preferred shares and distributions on other equity instruments.
MANAGEMENT'S DISCUSSION & ANALYSIS Sun Life Financial Inc. December 31, 2024 93
2. Underlying Net Income and Underlying EPS
Underlying net income is a non-IFRS financial measure that assists in understanding Sun Life's business performance by making certain adjustments to IFRS income. Underlying net income, along with common shareholders’ net income (Reported net income), is used as a basis for management planning, and is also a key measure in our employee incentive compensation programs. This measure reflects management's view of the underlying business performance of the company and long-term earnings potential. For example, due to the longer term nature of our individual protection businesses, market movements related to interest rates, equity markets and investment properties can have a significant impact on reported net income in the reporting period. However, these impacts are not necessarily realized, and may never be realized, if markets move in the opposite direction in subsequent periods or in the case of interest rates, the fixed income investment is held to maturity.
Underlying net income removes the impact of the following items from reported net income:
•Market-related impacts reflecting the after-tax difference in actual versus expected market movements, including:
i)Net interest impact from risk-free rate, credit spread, swap spread movements, and other impacts, reflecting accounting mismatches between assets and liabilities:
a.Differences arising from fair value changes(1) of fixed income assets (including derivatives) measured at FVTPL supporting insurance contracts, compared to fair value changes of the liabilities(2);
b.Fair value changes of fixed income assets (including derivatives) measured at FVTPL supporting our investment contract liability and surplus portfolios(3); and
c.Tax-exempt investment(4) income above or below expected long-term tax savings relating to our Canadian multi-national insurance operations.
ii)Non-fixed income investments where the weighted average expected return is approximately 2% per quarter, including:
a.Equity investments (including derivatives) supporting insurance contracts and surplus portfolios; and
b.Investment properties supporting insurance contracts and surplus portfolios.
•ACMA – captures the impact of method and assumption changes, and management actions on insurance and reinsurance contracts.
•Other adjustments:
i)Management’s ownership of MFS shares – this adjustment removes the change in fair value and other activity related to MFS common shares owned by management.
ii)Acquisition, integration, and restructuring – expense and income related to acquisition or disposal of a business. Also includes expenses related to restructuring activities.
iii)Intangible asset amortization – removes the amortization expense associated with finite life intangible assets arising from acquisitions or business combinations excluding amortization of software and distribution agreements.
iv)Other – represents items that are unusual or exceptional in nature which management believes are not representative of the long-term performance of the Company.
Underlying EPS (diluted). This measure is used in comparing the profitability across multiple periods and is calculated by dividing underlying net income by weighted average common shares outstanding for diluted EPS, excluding the dilutive impact of convertible instruments. For additional information about the underlying net income, see above. For additional information about the composition of the EPS, please refer to Note 25 of our Interim Consolidated Financial Statements for the period ended December 31, 2024. For additional information about the SLEECS, please refer to Note 12 of our 2024 Annual Consolidated Financial Statements.
(1)For fixed income assets, Underlying Net Income includes credit experience from rating changes on assets measured at FVTPL, and the ECL impact for assets measured at FVOCI.
(2)Underlying net income is based on observable discount curves and exchange rates at the beginning of the period.
(3)Underlying net income for earnings on surplus includes realized gains (losses) on fixed income assets classified as FVOCI.
(4)Q4'24 balances are isolated in Other within Other adjustments.
94 December 31, 2024 Sun Life Financial Inc. MANAGEMENT'S DISCUSSION & ANALYSIS
The following table sets out the post-tax amounts that were excluded from our underlying net income (loss) and underlying EPS and provides a reconciliation to our reported net income and EPS based on IFRS.
Reconciliations of Select Net Income Measures
| ($ millions, after-tax) | 2024 | 2023 | ||||||
| Underlying net income | 3,856 | 3,728 | ||||||
Market-related impacts | ||||||||
| Equity market impacts | 25 | (13) | ||||||
Interest rate impacts(1) | (60) | (14) | ||||||
Impacts of changes in the fair value of investment properties (real estate experience) | (338) | (427) | ||||||
| Add: Market-related impacts | (373) | (454) | ||||||
| Add: Assumption changes and management actions | 56 | 36 | ||||||
| Other adjustments | ||||||||
| Management's ownership of MFS shares | (22) | 12 | ||||||
Acquisition, integration and restructuring(2)(3)(4)(5)(6)(7) | 140 | (155) | ||||||
Intangible asset amortization(8) | (332) | (132) | ||||||
Other(9)(10)(11)(12)(13) | (276) | 51 | ||||||
| Add: Total of other adjustments | (490) | (224) | ||||||
| Reported net income - Common shareholders | 3,049 | 3,086 | ||||||
| Underlying EPS (diluted) ($) | 6.66 | 6.36 | ||||||
| Add: Market-related impacts ($) | (0.65) | (0.78) | ||||||
| Assumption changes and management actions ($) | 0.10 | 0.06 | ||||||
| Management's ownership of MFS shares ($) | (0.04) | 0.02 | ||||||
| Acquisition, integration and restructuring ($) | 0.24 | (0.26) | ||||||
| Intangible asset amortization ($) | (0.57) | (0.23) | ||||||
| Other ($) | (0.48) | 0.09 | ||||||
| Reported EPS (diluted) ($) | 5.26 | 5.26 | ||||||
(1)Our results are sensitive to long term interest rates given the nature of our business and to non-parallel yield curve movements (for example flattening, inversion, steepening, etc.).
(2)Amounts relate to acquisition costs for our SLC Management affiliates, BentallGreenOak, InfraRed Capital Partners, Crescent Capital Group LP and Advisors Asset Management, Inc, which include the unwinding of the discount for Other financial liabilities of $13 million in 2024 (2023 - $86 million).
(3)Primarily reflects a decrease of $334 million in estimated future payments for options to purchase the remaining ownership interests of SLC Management affiliates in 2024 (2023 - an increase of $42 million). For additional information, refer to Note 5 of our 2024 Annual Consolidated Financial Statements.
(4)Includes integration costs associated with DentaQuest, acquired on June 1, 2022.
(5)Includes a $65 million gain on the sale of the sponsored markets business in Canada in Q1'23 and a $19 million gain on the sale of Sun Life UK in Q2'23.
(6)To meet regulatory obligations, in Q1'24, we sold 6.3% of our ownership interest in ABSLAMC, generating a gain of $84 million. As a result of the transaction, our ownership interest in ABSLAMC was reduced from 36.5% to 30.2% for gross proceeds of $136 million. Subsequently in Q2'24, we sold an additional 0.2% of our ownership interest.
(7)Q2'24 includes a restructuring charge of $108 million in the Corporate business group.
(8)Includes an impairment charge of $186 million on an intangible asset related to bancassurance in Vietnam reflecting updates resulting from changes in regulatory and macro-economic factors in Q4'24.
(9)On December 27, 2023, Bermuda enacted its Corporate Income Tax Act 2023, which will apply a 15% income tax beginning on January 1, 2025 ("Bermuda Corporate Income Tax Change"). The enacted legislation provides an economic transition adjustment that aligns an entity’s starting point for the tax regime more closely with its economic position prior to the application of the Corporate Income Tax 2023. The benefit of this economic transition adjustment was recognized in 2023. As a result, reported net income increased by $51 million in 2023, reflected in Other adjustments.
(10)Includes the early termination of a distribution agreement in Asset Management in Q1'24.
(11)Includes a Pillar Two global minimum tax adjustment in Q2'24. For additional information, refer to Note 19 of our 2024 Annual Consolidated Financial Statements and section D - Profitability in this document.
(12)Includes a non-recurring provision in U.S. Dental in Q4'24.
(13)Includes an adjustment for lower tax exempt investment income of $234 million in the Corporate business group in Q4'24.
MANAGEMENT'S DISCUSSION & ANALYSIS Sun Life Financial Inc. December 31, 2024 95
The following table shows the pre-tax amount of underlying net income adjustments:
| ($ millions) | 2024 | 2023 | ||||||
| Underlying net income (after-tax) | 3,856 | 3,728 | ||||||
| Underlying net income adjustments (pre-tax): | ||||||||
Add: Market-related impacts | (428) | (726) | ||||||
Assumption changes and management actions(1) | 86 | 53 | ||||||
| Other adjustments | (345) | (373) | ||||||
| Total underlying net income adjustments (pre-tax) | (687) | (1,046) | ||||||
| Add: Taxes related to underlying net income adjustments | (120) | 404 | ||||||
| Reported net income - Common shareholders (after-tax) | 3,049 | 3,086 | ||||||
(1)In this document, the reported net income impact of ACMA excludes amounts attributable to participating policyholders and includes non-liability impacts. In contrast, Note 10.B.v of the 2024 Annual Consolidated Financial Statements shows the pre-tax net income impacts of method and assumption changes in aggregate, and CSM Impacts include amounts attributable to participating policyholders.
Taxes related to underlying net income adjustments may vary from the expected effective tax rate range reflecting the mix of business based on the Company's international operations and other tax-related adjustments.
3. Additional Non-IFRS Financial Measures
Management also uses the following non-IFRS financial measures:
After-tax profit margin for U.S. Group Benefits. This ratio expresses U.S. Group Benefits underlying net income as a percentage of net premiums. It assists in explaining our results from period to period and measures profitability. This ratio is calculated by dividing underlying net income (loss) by net premiums for the trailing four quarters. There is no directly comparable IFRS measure.
Assets under administration (in SLC Management). AUA represents Client assets for which Sun Life provides administrative services. In Asset Management, AUA includes assets distributed by SLC Management's affiliate, Advisors Asset Management, Inc. There is no directly comparable IFRS measure.
Assets under management. AUM is a non-IFRS financial measure that indicates the size of our Company's assets across asset management, wealth, and insurance. There is no standardized financial measure under IFRS. In addition to the most directly comparable IFRS measures, which are the balance of General funds and Segregated funds on our Statements of Financial Position, AUM also includes Third-party AUM and Consolidation adjustments. "Consolidation adjustments" is presented separately as consolidation adjustments apply to all components of total AUM.
AUM not yet earning fees. This measure represents the committed uninvested capital portion of total AUM not currently earning management fees. The amount depends on the specific terms and conditions of each fund. There is no directly comparable IFRS measure.
Capital raising. This measure consists of increases in SLC Management's commitments from fund raising activities for all real estate, infrastructure and alternative credit Clients excluding leverage. Investment-grade fixed income capital raising consists of sales made to new Clients. There is no directly comparable IFRS measure.
Cash and other liquid assets. This measure is comprised of cash, cash equivalents, short-term investments, and publicly traded securities, net of loans related to acquisitions and short-term loans that are held at SLF Inc. (the ultimate parent company), and its wholly owned holding companies. This measure is a key consideration of available funds for capital re-deployment to support business growth.
| ($ millions) | As at December 31, 2024 | As at December 31, 2023 | ||||||
| Cash and other liquid assets (held at SLF Inc. and its wholly owned holding companies): | ||||||||
| Cash, cash equivalents & short-term securities | 479 | 712 | ||||||
Debt securities(1) | 780 | 1,228 | ||||||
Equity securities(2) | 112 | 102 | ||||||
| Sub-total | 1,371 | 2,042 | ||||||
Less: Loans related to acquisitions and short-term loans(3) (held at SLF Inc. and its wholly owned holding companies) | (17) | (411) | ||||||
| Cash and other liquid assets (held at SLF Inc. and its wholly owned holding companies) | 1,354 | 1,631 | ||||||
(1)Includes publicly traded bonds.
(2)Includes ETF Investments.
(3)Includes drawdowns from credit facilities to manage timing of cash flows.
Constant currency. We remove the impacts of foreign exchange translation from certain IFRS and non-IFRS measures to assist in comparing our results from period to period. The impacts of foreign exchange translation is approximated by using the foreign exchange rates in effect during the comparative period, using the average or period end foreign exchange rates, as appropriate.
96 December 31, 2024 Sun Life Financial Inc. MANAGEMENT'S DISCUSSION & ANALYSIS
CSM Movement Analysis includes certain non-IFRS financial measures, detailed below, and also presents certain measures on a net basis to reflect how the business is managed, compared to a gross basis in the Consolidated Financial Statements. Examples include i) The impacts of insurance contracts issued is presented net of reinsurance; ii) Impact of new business is presented net of acquisition expense gain/loss; and iii) Certain methodology changes are presented as an impact of change in assumptions, whereas the Consolidated Financial Statement presentation is a contract modification.
•Organic CSM Movement is comprised of the Impact of new insurance business, Expected movements from asset returns & locked-in rates, Insurance experience gains/losses, and CSM recognized for services provided.
•Impact of new insurance business on CSM, also referred to as "new business CSM", represents growth from sales activity in the period, including individual protection sales (excluding joint ventures), and defined benefit solutions and segregated fund wealth sales in Canada. New business CSM is presented net of acquisition expense gain/loss.
•Expected movements from asset returns & locked-in rates applies to variable fee approach ("VFA") and general measurement approach ("GMA") contracts. For VFA contracts, this component of the CSM movement analysis is comprised of two factors: (i) the expected return on underlying assets and (ii) the measurement of financial guarantees. The difference between actual and expected results are reported as the impact of markets. For GMA contracts, this component of the CSM includes the accretion of the CSM balance at locked-in rates, which refer to the term structure associated with locked-in discount rates, set when the insurance contract was sold or on transition to IFRS 17. Average locked-in rates increase with the passage of time on in-force business and new business added at current rates.
•Impact of markets & other includes the difference between actual and expected movement for VFA contracts for: (i) the return on underlying assets and (ii) the measurement of financial guarantees. Also includes other amounts excluded from Organic CSM Movement.
•Insurance experience gains/losses represents the current period impacts of insurance experience, resulting in a change in future cash flows that adjust CSM.
•Impact of change in assumptions represents the future period impacts of changes in fulfilment cash flows that adjust CSM.
•CSM market sensitivities. CSM market sensitivities are non-IFRS financial measures for which there are no directly comparable measures under IFRS so it is not possible to provide a reconciliation of these amounts to the most directly comparable IFRS measures.
Deployment. This measure represents the amount of capital that has been invested in the period, including leverage where applicable. Deployment also includes capital committed in infrastructure deals to be invested in specific assets. There is no directly comparable IFRS measure.
Drivers of Earnings. The Drivers of Earnings ("DOE") analysis provides additional detail on the sources of earnings, primarily for protection and health businesses, and explains the actual results compared to the longer term expectations. The DOE is presented on a reported and underlying common shareholders' basis. Within the net insurance service result, the underlying DOE provides detail on expected insurance earnings, impact of new insurance business and experience gains (losses). Within the net investment result, the underlying DOE provides detail on expected investment earnings, credit experience, earnings on surplus, and joint ventures & other. For more information, refer to the headings "Underlying net income and Underlying EPS", "Earnings on surplus", "Notable items attributable to reported and underlying net income", in this document.
Certain amounts in the DOE are presented on a net basis to reflect how the business is managed, compared to a gross basis in the Consolidated Financial Statements. Examples include: i) Net investment result and Other expenses of the Asset Management operating segment are combined with Fee Income to report the net contribution to earnings; ii) Income for fee-based businesses is reported net of the associated expenses; iii) Carried interest in SLC Management within Fee Income excludes the carried interest that Sun Life does not participate in economically, and nets the non-controlling interest portion of the carried interest against fee income and expenses of consolidated funds; iv) Net investment results include assets returns net of the crediting rate for investment contract liabilities and the unwinding of and changes in the discount rate for insurance contract liabilities; v) Earnings on surplus reflects net spread earned from investment strategies; vi) Earnings attributable to the participating account are excluded; and vii) Assumption changes and management actions combines the amounts included in Net insurance service result and Net investment result.
Certain amounts in the DOE are presented on a net basis to reflect how the business is managed, compared to a gross basis in the Consolidated Financial Statements. Examples include: i) Net investment result and Other expenses of the Asset Management operating segment are combined with Fee Income to report the net contribution to earnings; ii) Income for fee-based businesses is reported net of the associated expenses; iii) Carried interest in SLC Management within Fee Income excludes the carried interest that Sun Life does not participate in economically, and nets the non-controlling interest portion of the carried interest against fee income and expenses of consolidated funds; iv) Net investment results include assets returns net of the crediting rate for investment contract liabilities and the unwinding of and changes in the discount rate for insurance contract liabilities; v) Earnings on surplus reflects net spread earned from investment strategies; vi) Earnings attributable to the participating account are excluded; and vii) Assumption changes and management actions combines the amounts included in Net insurance service result and Net investment result.
Earnings on Surplus. This component of the Drivers of Earnings represents the net income earned on a company’s surplus funds. Earnings on Surplus is comprised of realized gains on fair value through other comprehensive income assets, as well as net investment returns on surplus, such as investment income, gains (losses) on seed investments and investment properties mark-to-market, and also includes impacts from derivatives, currency and other items.
Experience-related items attributable to reported net income and underlying net income. These notable items attributable to reported net income and underlying net income are components of the Drivers of Earnings represents gains and losses that are due to differences between the actual results during the reporting period and management’s estimate of the expected longer-term returns on assets and liabilities (i.e. expected insurance earnings and expected investment earnings) at the start of the reporting period.
Fee earning AUM. FE AUM consists of assets managed by SLC Management, which are beneficially owned by Clients, on which we earn management fees for providing investment management, property management or advisory-related services. There is no directly comparable IFRS measure.
Fee-related earnings and Operating income. Fee-related earnings represent profitability of SLC Management's fee-related portfolios, and is calculated as Fee-related revenue less Fee-related expenses. Operating income represents profit realized from our business operations, and is calculated as the sum of Fee-related earnings, Investment income (loss) and performance fees, and Interest and other. Fee-related revenue represents all fee income, with the exception of performance fees, generated from third-party investors. Fee-related expenses represent all expenses directly related to generating fee revenue from third-party investors. Investment income (loss) and performance fees represent total income or loss from our seed investments, net of the related expenses. Interest and other represents performance fee compensation, our net interest income or expense and income from managing the General Account assets.
MANAGEMENT'S DISCUSSION & ANALYSIS Sun Life Financial Inc. December 31, 2024 97
Fee-related earnings and Operating income are non-IFRS financial measures within SLC Management's Supplemental Income Statement, which enhances the comparability of SLC Management's results with publicly traded alternative asset managers. For more details, see our Supplementary Financial Information package for the quarter.
The following table provides a reconciliation from Fee-related earnings and Operating income to SLC Management's Fee income and Total expenses based on IFRS.
| SLC Management | ||||||||
| ($ millions) | 2024 | 2023 | ||||||
Fee income (per IFRS) | 1,938 | 1,640 | ||||||
Less: Non-fee-related revenue adjustments(1)(2) | 700 | 444 | ||||||
| Fee-related revenue | 1,238 | 1,196 | ||||||
| Total expenses (per IFRS) | 1,480 | 1,603 | ||||||
Less: Non-fee-related expense adjustments(2)(3) | 527 | 697 | ||||||
| Fee-related expenses | 953 | 906 | ||||||
| Fee-related earnings | 285 | 290 | ||||||
Add: Investment income (loss) and performance fees(4) | 112 | 102 | ||||||
Add: Interest and other(5) | (112) | (110) | ||||||
| Operating income | 285 | 282 | ||||||
(1)Includes Interest and other - fee income, Investment income (loss) and performance fees - fee income, and Other - fee income.
(2)Excludes the income and related expenses for certain property management agreements to provide more accurate metrics on our fee-related business.
(3)Includes Interest and other, Placement fees - other, Amortization of intangibles, Acquisition, integration and restructuring, and Other - expenses.
(4)Investment income (loss) and performance fee in SLC Management's Supplemental Income Statement relates to the underlying results of our seed investments. As such, we have excluded non-underlying market-related impacts as well as the gains or losses of certain non-seed hedges that are reported under Net investment income (loss) under IFRS. The reconciliation is as follows (amounts have been adjusted for rounding):
| ($ millions) | 2024 | 2023 | ||||||
| Net investment income (loss) (per IFRS) | 138 | 55 | ||||||
| Less: Market-related impacts and Other - Investment income (loss) | 50 | (14) | ||||||
| Add: Investment income (loss) and performance fees - fee income | 24 | 33 | ||||||
| Investment income (loss) and performance fees | 112 | 102 | ||||||
(5)Includes Interest and other reported under Fee income under IFRS, net of Interest and other reported under Total expenses under IFRS.
Financial leverage ratio. This ratio is an indicator of the Company's balance sheet strength measured by its proportion of capital qualifying debt in accordance with OSFI guidelines. This is calculated as the ratio of total debt plus preferred shares to total capital including the contractual service margin net of taxes, where debt consists of all capital-qualifying debt securities. Capital-qualifying debt securities consist of subordinated debt and innovative capital instruments. The CSM is included net of taxes because debts are repaid and serviced from available after-tax funds.
Impacts of foreign exchange translation. To assist in comparing our results from period-to-period, the favourable or unfavourable impacts of foreign exchange translation are approximated using the foreign exchange rates, in effect during the comparative period, for several IFRS and Non-IFRS financial measures using the average or period end foreign exchange rates, as appropriate. Items impacting a reporting period, such as Revenue, Expenses, and Reported net income (loss) in our Consolidated Statements of Operations, as well as underlying net income (loss), and sales, are translated into Canadian dollars using average exchange rates for the appropriate daily, monthly, or quarterly period. For Assets and Liabilities in our Consolidated Statements of Financial Position, as well as the AUM and certain components of the Drivers of Earnings disclosure, period-end rates are used for currency translation purposes.
LICAT market sensitivities. LICAT market sensitivities are non-IFRS financial measures for which there are no directly comparable measures under IFRS so it is not possible to provide a reconciliation of these amounts to the most directly comparable IFRS measures.
Organic capital generation. This supplementary financial measure provides a view of the Company’s ability to generate excess capital under the normal course of business, excluding non-recurring items; where excess capital is defined as LICAT Available Capital and Surplus Allowance above LICAT Base Solvency Buffer at target ratio, as defined and calculated under OSFI-mandated guideline. This amount is determined as follows: underlying net income and organic CSM movement net of shareholder dividends and change in base solvency buffer for new business and aging of in-force. This amount excludes non-recurring impacts to available capital or base solvency buffer from markets, assumption changes, management actions, and other non-underlying items.
Pre-tax fee related earnings margin. This ratio is a measure of SLC Management's profitability in relation to funds that earn recurring fee revenues, while excluding investment income and performance fees. The ratio is calculated by dividing fee-related earnings by fee-related revenues and is based on the last twelve months. There is no directly comparable IFRS measure.
Pre-tax net operating margin. This ratio is a measure of the profitability and there is no directly comparable IFRS measure. For MFS, this ratio is calculated by excluding management's ownership of MFS shares and certain commission expenses that are offsetting. These commission expenses are excluded in order to neutralize the impact these items have on the pre-tax net operating margin and have no impact on the profitability of MFS. For SLC Management, the ratio is calculated by dividing the total operating income by fee-related revenue plus investment Income (loss) and performance fees, and is based on the last twelve months.
98 December 31, 2024 Sun Life Financial Inc. MANAGEMENT'S DISCUSSION & ANALYSIS
The following table provides a reconciliation to calculate MFS' pre-tax net operating margin:
| MFS | ||||||||
| (US$ millions) | 2024 | 2023 | ||||||
Revenue | ||||||||
| Fee income (per IFRS) | 3,370 | 3,196 | ||||||
| Less: Commissions | 399 | 395 | ||||||
Less: Other(1) | (57) | (53) | ||||||
| Adjusted revenue | 3,028 | 2,854 | ||||||
| Expenses | ||||||||
| Expenses (per IFRS) | 2,391 | 2,244 | ||||||
| Net investment (income)/loss (per IFRS) | (95) | (93) | ||||||
Less: Management's ownership of MFS shares (net of NCI)(2) | 57 | 34 | ||||||
Compensation-related equity plan adjustments | 36 | 16 | ||||||
Commissions | 399 | 395 | ||||||
Other(1) | (51) | (52) | ||||||
| Adjusted expenses | 1,855 | 1,758 | ||||||
| Pre-tax net operating margin | 38.7% | 38.4% | ||||||
(1)Other includes accounting basis differences, such as sub-advisory expenses and product allowances.
(2)Excluding non-controlling interest. For more information on Management's ownership of MFS shares, see the heading Underlying Net Income and Underlying EPS.
Return on equity. IFRS does not prescribe the calculation of ROE and therefore a comparable measure under IFRS is not available. To determine reported ROE and underlying ROE, respectively, reported net income (loss) and underlying net income (loss) is divided by the total weighted average common shareholders’ equity for the period. The ROE provides an indication of the overall profitability of the Company. The quarterly ROE is annualized.
Sales and flows. Asset Management gross flows includes funds from retail and institutional Clients; SLC Management gross flows include capital raising, such as uncalled capital commitments and fund leverage. Asset Management net flows consist of gross flows less gross outflows; SLC Management's net flows do not include Client distributions from the sale of underlying assets in closed-end funds. In Canada and in Asia, net sales consist of wealth sales & asset management gross flows less redemptions. In Canada, wealth sales & asset management gross flows consist of sales in Group Retirement Services (excluding retained sales) and Individual Wealth; group - health & protection sales consist of workplace benefits sold by Sun Life Health; and individual - protection sales refer to individual insurance sales. In the U.S., group - health & protection sales consist of sales by Group Benefits and Dental. In Asia, wealth sales & asset management gross flows consist of Hong Kong wealth sales & asset management gross flows, Philippines mutual fund sales, wealth sales & asset management gross flows by our India and China joint ventures and associates, and Aditya Birla Sun Life AMC Limited's equity and fixed income mutual fund sales based on our proportionate equity interest, including sales as reported by our bank distribution partners; individual - protection sales consist of the individual insurance sales, by our subsidiaries and joint ventures and associates, based on our proportionate equity interest, in the Philippines, Indonesia, India, China, Malaysia, Vietnam, International, Hong Kong and Singapore. Asia also has group - health & protection sales in the Philippines, Hong Kong and our joint ventures. To provide greater comparability across reporting periods, we exclude the impacts of foreign exchange translation from sales and gross flows. There is no directly comparable IFRS measure.
Third-party AUM. Third-party AUM is composed of retail, institutional, and other third party assets, which includes general fund and segregated fund assets managed by our joint ventures. In Asset Management, third-party AUM includes Client assets for retail and institutional Clients, as well as capital raising, such as uncalled commitments and fund leverage in SLC Management. In Canada, third-party AUM includes Client assets in retail mutual fund products of Sun Life Global Investments. In Asia, third-party AUM includes Client assets in Hong Kong managed fund products, International wealth & asset management products, Philippines mutual and managed fund products, Aditya Birla Sun Life AMC Limited equity and fixed income mutual fund products, Sun Life Everbright Asset Management products and our joint ventures’ general fund and segregated fund assets based on our proportionate equity interest. There is no directly comparable IFRS financial measure.
Total weighted premium income ("TWPI"). This measure consists of 100% renewal premiums, 100% of first year premiums, and 10% of single premiums. In contrast to sales, which only includes premiums from new business, TWPI includes renewal premiums, reflecting the strength of the in-force block and providing a better understanding of both new and existing business. There is no directly comparable IFRS measure.
Underlying dividend payout ratio. This is the ratio of dividends paid per share to diluted underlying EPS for the period. The ratio is utilized during the medium-term capital budgeting process to inform our planned capital initiatives. We target an underlying dividend payout ratio of between 40% and 50% based on underlying EPS. For more information, see Section J - Capital and Liquidity Management in this document.
Underlying effective tax rate. This measure is calculated using the pre-tax underlying net income and the income tax expense associated with it. Our statutory tax rate is normally reduced by various tax benefits, such as lower taxes on income subject to tax in foreign jurisdictions, a range of tax-exempt investment income, and other sustainable tax benefits. Our effective tax rate helps in the analysis of the income tax impacts in the period.
MANAGEMENT'S DISCUSSION & ANALYSIS Sun Life Financial Inc. December 31, 2024 99
4. Reconciliations of Select Non-IFRS Financial Measures
Underlying Net Income to Reported Net Income Reconciliation - Pre-tax by Business Group
Q4'24 | ||||||||||||||||||||
| ($ millions) | Asset Management | Canada | U.S. | Asia | Corporate | Total | ||||||||||||||
| Underlying net income (loss) | 360 | 366 | 161 | 175 | (97) | 965 | ||||||||||||||
| Add: Market-related impacts (pre-tax) | (18) | (142) | (74) | 27 | (14) | (221) | ||||||||||||||
| ACMA (pre-tax) | — | (1) | (1) | 15 | — | 13 | ||||||||||||||
| Other adjustments (pre-tax) | (34) | (8) | (143) | (193) | — | (378) | ||||||||||||||
Tax expense (benefit) | 18 | 38 | 50 | (13) | (235) | (142) | ||||||||||||||
| Reported net income (loss) - Common shareholders | 326 | 253 | (7) | 11 | (346) | 237 | ||||||||||||||
Q4'23 | ||||||||||||||||||||
| Underlying net income (loss) | 331 | 350 | 253 | 143 | (94) | 983 | ||||||||||||||
Add: Market-related impacts (pre-tax) | (11) | (223) | (60) | (142) | — | (436) | ||||||||||||||
| ACMA (pre-tax) | — | 72 | (65) | (1) | — | 6 | ||||||||||||||
| Other adjustments (pre-tax) | (39) | (6) | (65) | (8) | — | (118) | ||||||||||||||
Tax expense (benefit) | 16 | 155 | 38 | 52 | 53 | 314 | ||||||||||||||
| Reported net income (loss) - Common shareholders | 297 | 348 | 101 | 44 | (41) | 749 | ||||||||||||||
| 2024 | ||||||||||||||||||||
| ($ millions) | Asset Management | Canada | U.S. | Asia | Corporate | Total | ||||||||||||||
| Underlying net income (loss) | 1,293 | 1,453 | 773 | 701 | (364) | 3,856 | ||||||||||||||
| Add: Market-related impacts (pre-tax) | (25) | (211) | (148) | (47) | 3 | (428) | ||||||||||||||
| ACMA (pre-tax) | — | (47) | 181 | (52) | 4 | 86 | ||||||||||||||
| Other adjustments (pre-tax) | 263 | (33) | (323) | (114) | (138) | (345) | ||||||||||||||
Tax expense (benefit) | (3) | 55 | 73 | (59) | (186) | (120) | ||||||||||||||
| Reported net income (loss) - Common shareholders | 1,528 | 1,217 | 556 | 429 | (681) | 3,049 | ||||||||||||||
| 2023 | ||||||||||||||||||||
| Underlying net income (loss) | 1,239 | 1,376 | 890 | 600 | (377) | 3,728 | ||||||||||||||
Add: Market-related impacts (pre-tax) | (61) | (433) | (59) | (156) | (17) | (726) | ||||||||||||||
| ACMA (pre-tax) | — | 82 | (66) | 34 | 3 | 53 | ||||||||||||||
| Other adjustments (pre-tax) | (172) | 90 | (272) | (28) | 9 | (373) | ||||||||||||||
Tax expense (benefit) | 61 | 137 | 83 | 61 | 62 | 404 | ||||||||||||||
| Reported net income (loss) - Common shareholders | 1,067 | 1,252 | 576 | 511 | (320) | 3,086 | ||||||||||||||
100 December 31, 2024 Sun Life Financial Inc. MANAGEMENT'S DISCUSSION & ANALYSIS
Underlying Net Income to Reported Net Income Reconciliation - Pre-tax by Business Unit - Asset Management
Q4'24 | Q4'23 | |||||||||||||
| ($ millions) | MFS | SLC Management | MFS | SLC Management | ||||||||||
| Underlying net income (loss) | 301 | 59 | 261 | 70 | ||||||||||
| Add: Market-related impacts (pre-tax) | — | (18) | — | (11) | ||||||||||
Other adjustments (pre-tax) | 4 | (38) | (7) | (32) | ||||||||||
Tax expense (benefit) | (4) | 22 | (4) | 20 | ||||||||||
| Reported net income (loss) - Common shareholders | 301 | 25 | 250 | 47 | ||||||||||
| 2024 | 2023 | |||||||||||||
| ($ millions) | MFS | SLC Management | MFS | SLC Management | ||||||||||
| Underlying net income (loss) | 1,117 | 176 | 1,044 | 195 | ||||||||||
| Add: Market-related impacts (pre-tax) | — | (25) | — | (61) | ||||||||||
Other adjustments (pre-tax) | (4) | 267 | 30 | (202) | ||||||||||
| Tax expense (benefit) | (18) | 15 | (18) | 79 | ||||||||||
| Reported net income (loss) - Common shareholders | 1,095 | 433 | 1,056 | 11 | ||||||||||
Underlying Net Income to Reported Net Income Reconciliation - Pre-tax in U.S. dollars
Q4'24 | Q4'23 | |||||||||||||
| (US$ millions) | U.S. | MFS | U.S. | MFS | ||||||||||
| Underlying net income (loss) | 115 | 216 | 187 | 191 | ||||||||||
Add: Market-related impacts (pre-tax) | (52) | — | (42) | — | ||||||||||
| ACMA (pre-tax) | — | — | (49) | — | ||||||||||
| Other adjustments (pre-tax) | (103) | 3 | (47) | (5) | ||||||||||
Tax expense (benefit) | 39 | (3) | 28 | (3) | ||||||||||
| Reported net income (loss) - Common shareholders | (1) | 216 | 77 | 183 | ||||||||||
| 2024 | 2023 | |||||||||||||
| (US$ millions) | U.S. | MFS | U.S. | MFS | ||||||||||
| Underlying net income (loss) | 566 | 817 | 663 | 773 | ||||||||||
Add: Market-related impacts (pre-tax) | (112) | — | (40) | — | ||||||||||
| ACMA (pre-tax) | 136 | — | (48) | — | ||||||||||
| Other adjustments (pre-tax) | (235) | (4) | (200) | 22 | ||||||||||
Tax expense (benefit) | 56 | (13) | 65 | (13) | ||||||||||
| Reported net income (loss) - Common shareholders | 411 | 800 | 440 | 782 | ||||||||||
Underlying Net Income to Reported Net Income Reconciliation - U.S. Group Benefits - Pre-tax in U.S. dollars
The following table sets out the amounts that were excluded from our reported net income (loss) for U.S. Group Benefits, which is used to calculate the trailing four-quarter after-tax profit margin for U.S. Group Benefits.
| (US$ millions) | Q4'24 | Q3'24 | Q2'24 | Q1'24 | Q4'23 | Q3'23 | Q2'23 | Q1'23 | ||||||||||||||||||
Underlying net income (loss) for U.S. Group Benefits | 62 | 118 | 124 | 118 | 138 | 96 | 116 | 128 | ||||||||||||||||||
Add: Market-related impacts (pre-tax) | (18) | 17 | (11) | (8) | 14 | (10) | (6) | 4 | ||||||||||||||||||
| ACMA (pre-tax) | — | 8 | — | — | (11) | 47 | — | — | ||||||||||||||||||
| Other adjustments (pre-tax) | (5) | (5) | (6) | (7) | (9) | (6) | (6) | (5) | ||||||||||||||||||
Tax expense (benefit) | 5 | (4) | 3 | 3 | 1 | (6) | 2 | 1 | ||||||||||||||||||
Reported net income (loss) - Common shareholders | 44 | 134 | 110 | 106 | 133 | 121 | 106 | 128 | ||||||||||||||||||
MANAGEMENT'S DISCUSSION & ANALYSIS Sun Life Financial Inc. December 31, 2024 101
| N. Accounting and Control Matters | |||||
We have adopted amended IFRS standards in the current year, which had no material impact on our Consolidated Financial Statements. For additional information, refer to Note 2 in our 2024 Annual Consolidated Financial Statements.
1. Critical Accounting Policies and Estimates
Our significant accounting and actuarial policies are described in Notes 1 and 6 of our 2024 Annual Consolidated Financial Statements. Management must make judgments involving assumptions and estimates, some of which may relate to matters that are inherently uncertain, under these policies. The estimates described below are considered particularly significant to understanding our financial performance. As part of our financial control and reporting, judgments involving assumptions and estimates are reviewed by the independent auditor and by other independent advisors on a periodic basis. Accounting policies requiring estimates are applied consistently in the determination of our financial results.
1.A Insurance Contracts Summary and Methods and Assumptions
Summary
We sell a variety of insurance contracts that include many forms of life, health and critical illness insurance sold to individuals and groups, annuities, and segregated fund products with guarantees. We hold reinsurance contracts that transfer mortality and other risks following internal guidelines.
Insurance contracts with direct participation features are products where investments are managed on behalf of policyholders, and investment returns less a variable fee are passed through to policyholders with the insurance benefits they receive. Insurance contracts with direct participation features are measured using the VFA, and include segregated funds, unit-linked contracts, variable universal life contracts, and most participating insurance contracts. Reinsurance contracts (both issued and held) cannot be measured using the VFA.
Insurance contracts without direct participation features are eligible to use the PAA if the coverage period is one year or less, or if the result of applying the PAA is not expected to be a materially different result than applying the GMA in each reporting period over the life of the contract. Insurance contracts eligible to use the PAA include most group life and health contracts and the associated reinsurance contracts held.
Other insurance contracts are measured using the GMA. This includes most individual life and health insurance contracts and annuities and the associated reinsurance contracts held.
The Consolidated Statements of Financial Position present insurance contracts issued and reinsurance contracts held as both assets and liabilities, depending on whether the portfolio is in an asset or liability position.
For more information about insurance contracts issued and reinsurance contracts held, and Insurance contract liabilities for account of segregated fund holders, see Note 1, Note 10 and Note 21 of our 2024 Annual Consolidated Financial Statements.
Methods and Assumptions
General
A group of insurance contracts is measured as the total of FCF, which is the present value of future cash flows plus the risk adjustment for
non-financial risk, and, for groups measured using the GMA or VFA, the CSM. In measuring the present value of future cash flows, assumptions must be made about mortality and morbidity rates, lapse and other policyholder behaviour ("policyholder behaviour"), expenses and other factors over the life of our products, and the prevailing market view of the cost of financial risk in our products. Many of these assumptions relate to events that are anticipated to occur many years in the future. Assumptions require significant judgment and regular review and, where appropriate, revision.
The RA is the compensation we require for the uncertainty related to non-financial risk in the estimates of future cash flows. This compensation is measured by discounting cash flows from applying margins to the non-financial assumptions used in the estimate of future cash flows.
The CSM represents the unearned profit that will be recognized as insurance contract services are provided.
The methods and assumptions used in the measurement of insurance contracts are reviewed regularly and are subject to external actuarial peer review.
Present Value of Future Cash Flows
Assumptions for non-financial risk variables in the present value of future cash flows are intended to be current, neutral estimates of the expected outcome, as guided by both IFRS and accepted actuarial practice in Canada. The choice of assumptions takes into account current circumstances, past experience data from our own experience or from the industry, the relationship of past to expected future experience, anti-selection, the relationship among assumptions (including those for financial risk variables), and other relevant factors.
Assumptions for financial risk variables in the present value of future cash flows are based on current observable market prices, adjusted to account for differences between the financial risk embedded in our products and those in the corresponding observed market instrument. Where no relevant market instrument is available, we use the best information available as guided by both IFRS and accepted actuarial practice in Canada.
102 December 31, 2024 Sun Life Financial Inc. MANAGEMENT'S DISCUSSION & ANALYSIS
Mortality
Mortality refers to the rates at which death occurs for defined groups of people. Mortality assumptions are generally based on the past five to ten years of experience. Our experience is combined with industry experience or experience from reinsurers where our own experience is insufficient to be statistically valid. Assumed mortality rates for life insurance and annuity contracts include assumptions about future mortality improvement based on recent trends in population mortality and our outlook for future trends.
Morbidity
Morbidity refers to the rate of being unhealthy or disabled and the rates of recovery therefrom. Most of our disability insurance is marketed on a group basis. We offer critical illness policies on an individual basis in Canada and Asia, long-term care on an individual basis in Canada, and medical stop-loss insurance is offered on a group basis in the U.S. In Canada, group morbidity assumptions are based on our five-year average experience, modified to reflect any emerging trend in recovery rates. For Canadian long-term care and critical illness insurance in Canada and Asia, assumptions are developed in collaboration with our reinsurers and are largely based on their experience. In the U.S., our experience is used for both medical stop-loss and disability assumptions, with some consideration of industry or reinsurer experience.
Policyholder Behaviour
Lapse or surrender
Policyholders may allow their policies to lapse prior to the end of the contractual coverage period by choosing not to continue to pay premiums or by surrendering their policy for the cash surrender value. Assumptions for lapse or surrender experience on life insurance are generally based on our five-year average experience. Lapse or surrender rates vary by plan, age at issue, method of premium payment, policy duration and financial risk variables.
Premium payment patterns
For universal life contracts, it is necessary to set assumptions about premium payment patterns. Studies prepared by industry or the actuarial profession are used for products where our experience is insufficient to be statistically valid. Premium payment patterns usually vary by plan, age at issue, method of premium payment, policy duration and financial risk variables.
Expense
Future expenses directly attributable to the fulfilment of our insurance contracts include the costs of premium collection, claims adjudication and processing, actuarial calculations, preparation and mailing of policy statements, and related overhead. Future expense assumptions are mainly based on our recent experience using an internal expense allocation methodology. Inflationary increases assumed in future expenses are based on long-term expectations.
Acquisition expenses directly attributable to portfolios of insurance contracts include the costs of selling, underwriting and issuing insurance contracts. For new insurance contracts measured using the GMA or VFA, actual or estimated directly attributable acquisition expenses are recognized in the initial measurement of the contract. If estimates are used, the difference between estimated and actual acquisition expenses adjusts the CSM when the group of insurance contracts is closed to new contracts.
Current Discount Rates
Current discount rates are used to discount estimates of future cash flows in determining the present value of future cash flows. Current discount rates reflect the time value of money, the characteristics of the cash flows, and the liquidity characteristics of the insurance contracts.
Current discount rates for cash flows that do not vary based on returns on underlying items
Cash flows that do not vary at all based on the returns on any underlying items are discounted at rates that reflect the timing and currency of cash flows and the liquidity characteristics of the insurance contracts.
The timing of cash flows is reflected by constructing a discount curve, so that each cash flow is discounted consistent with the timing of the cash flow. In constructing the discount curve, a portion is based on market information (the observable period) and beyond that period, the discount rates are estimated (the unobservable period). The observable period, which varies by currency, is the time period where information on risk-free interest rates is deep and liquid. In the unobservable period, risk-free rates are interpolated between the last observable point and an ultimate risk-free rate at year 70. The ultimate risk-free rate is estimated using historical averages as guided by both IFRS and accepted actuarial practice in Canada.
The currency of cash flows is reflected by using different discount curves for different currencies.
Liquidity is reflected by adding a liquidity premium to risk-free discount rates that is consistent with the liquidity characteristics of the insurance contracts. The liquidity premium in the observable period is based on the liquidity premium on assets with similar liquidity characteristics, which is estimated from the spread inherent in current market yields less a deduction for expected and unexpected credit losses. The deduction for expected and unexpected credit losses is estimated using historical rating agency data and current market conditions, and varies by asset type, quality, and duration. The liquidity premium in the unobservable period is interpolated between the last observable liquidity premium and an ultimate liquidity premium (at year 70) specific to liquid or illiquid contracts as guided by both IFRS and accepted actuarial practice in Canada. See Note 10.A in the 2024 Annual Consolidated Financial Statements for further details, which provides a weighted average summary of the discount curves used to present value cash flows for all major products that do not vary based on the returns on underlying items.
Current discount rates for cash flows that vary with returns on underlying items
Discount rates for cash flows that vary directly with returns on underlying items reflect that variability. For the portion of cash flows that is a pass through of returns on underlying items to policyholders, the discount rate is such that the present value of cash flows equals the portion of the underlying items that is passed through to policyholders. For cash flows that vary, but not directly, with underlying items (e.g., financial guarantees), scenario testing may be necessary. If so, discount rates used in the scenario projections are scenario-specific and based on the projected risk-free rates in the scenario plus liquidity premiums consistent with the liquidity characteristics of the contracts being measured.
MANAGEMENT'S DISCUSSION & ANALYSIS Sun Life Financial Inc. December 31, 2024 103
Scenario Testing
Scenario testing may be required when the relationship between cash flows and financial risk variables is non-linear, or where there are complex interdependencies among cash flows. In scenario testing of financial risk variables, future cash flows are projected for each scenario path and discounted at the scenario-specific discount rates, resulting in a present value of future cash flows for each scenario. The provision for the projected cash flows is the average of the scenario-specific values. Assumptions for non-financial risk variables are the best estimate assumptions consistent with the scenario.
Scenarios are consistent with the current market environment. Our Economic Scenario Generator calibration process produces integrated stochastic scenarios of financial risk variables (e.g., risk-free interest rates, bond fund returns, equity returns) with parameters calibrated to replicate observable market prices of financial instruments available in the market. Adjustments are made when the insurance contracts being measured are illiquid but the financial instruments to which the scenarios are calibrated to are liquid.
Risk Adjustment for Non-Financial Risk
The RA for insurance contracts issued is the compensation we require for bearing uncertainty about the amount and timing of the cash flows that arises from non-financial risk. This amount is measured as the present value of the difference between estimated future cash flows with a margin applied to non-financial assumptions and estimated future cash flows without this adjustment. Margins generally range from 5% to 20% depending on the uncertainty in the determination of the assumption. The level of uncertainty, and hence the margin chosen, varies by assumption and by line of business and other factors. Considerations that would generally lead to a choice of margin at the higher end of the range are as follows:
•The statistical credibility of our experience is too low to be the primary source of data for choosing the assumption;
•Future experience is difficult to estimate;
•The cohort of risks lacks homogeneity;
•Operational risks adversely impact the ability to estimate the assumption; or
•Past experience may not be representative of future experience and the experience may deteriorate.
Margins are generally stable over time and are revised only to reflect changes in the level of uncertainty in the assumptions. Our margins tend to be at mid-range.
The RA for reinsurance contracts held represents the amount of risk transferred to the reinsurer. This is measured as the difference between the RA on the underlying insurance contracts without reinsurance and what the RA on the underlying insurance contracts would be with reinsurance. The RA for reinsurance contracts held increases the asset or reduces the liability for reinsurance contracts held.
The RA for insurance contracts corresponds to a confidence level of approximately 85-90% overall.
Contractual Service Margin
The initial and subsequent measurement of CSM is described in Note 1 in our 2024 Annual Consolidated Financial Statements. Additional detail about certain components of the measurement of CSM is provided below.
Interest accretion
For insurance contracts measured using the GMA, locked-in discount rates are used to accrete interest on the CSM. The locked-in discount rate for a group of insurance contracts is the weighted average of the current discount rates at initial recognition of the contracts in the group.
For insurance contracts measured using the VFA, there is no accretion of interest. Rather, the CSM is adjusted by the change in our share of the fair value of underlying items.
Changes in FCF relating to future service
For insurance contracts measured using the GMA, locked-in discount rates are used to measure changes in FCF relating to future service. Changes in FCF relating to future service reflect changes in non-financial assumptions but not changes in assumptions related to financial risk.
For insurance contracts measured using the VFA, current discount rates are used to measure the change in FCF relating to future service. Changes in FCF relating to future service reflect both changes in non-financial assumptions and changes in assumptions related to financial risk.
Changes in FCF relating to future service include (Liability for Remaining Coverage only):
•All changes related to investment component payments (including current period payments);
•Changes arising from changes in assumptions used to derive the present value of future cash flows - limited to non-financial assumptions for insurance contracts measured using the GMA;
•Changes in future cash flows arising from claims in the current period; and
•For insurance contracts measured using the GMA, changes related to discretionary cash flows on some universal life and adjustable products. Discretionary cash flows are cash flows outside the guaranteed payments to the policyholder, and are described as a spread on earned rates (in the case of some universal life contracts) and in the policy on criteria for changes to adjustable policies for adjustable policies.
CSM recognized for services provided
The amount of CSM recognized as insurance revenue in each period to reflect the insurance contract services provided for a group of contracts in the period is determined by:
•Identifying the total coverage units in the group (for services in current and future periods) – based on the quantity of insurance contract services;
•Allocating the CSM at the end of the period equally to each coverage unit in the current period and expected to be provided in the future (i.e., coverage units "unitize" the services provided); then
104 December 31, 2024 Sun Life Financial Inc. MANAGEMENT'S DISCUSSION & ANALYSIS
•Recognizing in insurance revenue the amount allocated to coverage units provided in the period.
Total coverage units for services expected to be provided in future periods is the present value of projected coverage units. The present value is measured using locked-in discount rates for groups measured using the GMA and current discount rates for groups measured using the VFA.
The coverage unit for a group is based on the nature of the insurance contract services provided. Insurance contract services comprise services for providing insurance coverage and, for some contracts, investment-return or investment-related services. It does not include services related to performing functions such as claims adjudication. Where more than one type of service is provided to insurance contracts in a group, the coverage unit reflects the primary service provided.
For insurance contracts measured using the VFA, coverage units are based on the policyholder's account value or the policyholders' share of the fair value of underlying items. For insurance contracts measured using the GMA, coverage units are based on the expected claim amount (excluding any investment component) for life and health insurance contracts, and the payment due in a period for annuity contracts.
For reinsurance contracts held, the amount of CSM recognized reflects the services received in the period.
Sensitivities to Insurance Methods and Assumptions
In addition to the insurance risks factors and risk management governance and controls described in section K - Risk Management in this document and the Risk Factors section of the 2024 AIF, we also note that on adoption of IFRS 17 and 9, the tables below include sensitivities of contractual service margins to insurance and other non-financial assumption risks.
The following table sets out the estimated immediate impact on, or sensitivity of, the CSM and net income to certain instantaneous changes in the insurance and other non-financial assumptions used in the calculation of our insurance contract liabilities, based on a starting point and business mix as at December 31, 2024 and December 31, 2023. These sensitivities are calculated independently for each risk factor, generally assuming that all other risk variables stay constant. The estimates are illustrative and different starting points for best estimate assumptions, CSM balances and business mix will result in different estimated sensitivities. These sensitivities represent the Company's estimate of changes in best estimate assumptions that are reasonably likely based on the Company's and/or the industry's historical experience and industry standards and best practices as at December 31, 2024 and December 31, 2023.
The impact on CSM is attributable to insurance contracts measured under the GMA and VFA. For insurance contracts measured under the GMA, the impact flows through the CSM at locked-in discount rates. For insurance contracts measured under the VFA, the impact flows through the CSM at current discount rates.
The impact on net income is attributable to any portion of the sensitivities for insurance contracts measured under the GMA and VFA that cannot be absorbed by CSM, the full impact for insurance contracts measured under the PAA, and the difference in impact between locked-in and current discount rates for insurance contracts measured under the GMA. If current discount rates are higher than locked-in rates, this generally results in a favourable impact to net income from contracts measured under the GMA.
| ($ millions) | As at December 31, 2024 | As at December 31, 2023 | ||||||||||||
Sensitivity(1) | Potential impact on CSM (pre-tax) | Potential impact on net income/equity (after-tax) | Potential impact on CSM (pre-tax) | Potential impact on net income/equity (after-tax) | ||||||||||
| Policyholder Behaviour (10% increase/decrease, where adverse) | (800) | (25) | (950) | 100 | ||||||||||
| Life Mortality rates (2% increase) | 25 | (75) | (75) | (25) | ||||||||||
| Annuity Mortality rates (2% decrease) | (175) | — | (175) | — | ||||||||||
| Morbidity rates (5% incidence increase and 5% termination decrease) | (125) | (225) | (100) | (175) | ||||||||||
| Expenses (5% increase) | (150) | (25) | (175) | — | ||||||||||
(1) Sensitivities to insurance assumptions refer to insurance contracts issued net of reinsurance contracts held. Net income and CSM sensitivities have been rounded in increments of $25 million. The sensitivities exclude the impacts on the income from our joint ventures and associates in China and India, which we account for on an equity basis.
Fair Value of Assets and Liabilities
Debt securities, equity securities, most mortgages and loans and certain other invested assets are measured FVTPL or FVOCI and are recorded at fair value in our Consolidated Statements of Financial Position. Changes in fair value of assets measured FVTPL, and realized gains and losses on sale of FVTPL assets are recognized in income. Changes in fair value of FVOCI assets are recorded in OCI. For foreign currency translation, exchange differences calculated on the amortized cost of FVOCI assets are recognized in income and other changes in the carrying amount are recognized in OCI. Net impairment losses and realized gains and losses on sale of FVOCI assets (except for FVOCI equity securities as they remain in OCI) are reclassified from OCI to income.
The fair value of government and corporate debt securities is primarily determined using unadjusted quoted prices in active markets for identical or similar securities, where available. When quoted prices in active markets are not available, fair value is determined using market standard valuation methodologies, which include a discounted cash flow method, consensus pricing from various broker dealers that are typically the market makers, or other similar techniques. The assumptions and valuation inputs in applying these market standard valuation methodologies are determined primarily using observable market inputs, which include, but are not limited to, benchmark yields, reported trades of identical or similar instruments, broker-dealer quotes, issuer spreads, bid prices, and reference data including market research publications. In limited circumstances, non-binding broker quotes are used.
MANAGEMENT'S DISCUSSION & ANALYSIS Sun Life Financial Inc. December 31, 2024 105
The fair value of asset-backed securities is primarily determined using unadjusted quoted prices in active markets for identical or similar securities, where available, or valuation methodologies and valuation inputs similar to those used for government and corporate debt securities. Additional valuation inputs include structural characteristics of the securities, and the underlying collateral performance, such as prepayment speeds and delinquencies. Expected prepayment speeds are based primarily on those previously experienced in the market at projected future interest rate levels. In limited circumstances where there is a lack of sufficient observable market data to value the securities, non-binding broker quotes are used.
The fair value of equity securities is determined using unadjusted quoted prices in active markets for identical securities or similar securities. When quoted prices in active markets are not available, fair value is determined using equity valuation models, which include a discounted cash flow method and other techniques that involve benchmark comparison. Valuation inputs primarily include projected future operating cash flows and earnings, dividends, market discount rates, and earnings multiples of comparable companies. Where equity securities are less frequently traded, the most recent exchange-quoted pricing is used to determine fair value.
The fair value of mortgages and loans is determined by discounting the expected future contractual cash flows using a current market interest rate applicable to financial instruments with a similar yield, credit quality, and maturity characteristics. Valuation inputs typically include benchmark yields and risk-adjusted spreads from current internal lending activities or loan issuances. Beginning in the fourth quarter of 2022, valuation inputs also include external lending activities or loan issuances from both public and private markets, enhancing the market observability of inputs. The risk-adjusted spreads are determined based on the borrower’s credit and liquidity, as well as term and other loan-specific features.
The fair value of other financial liabilities is determined by using the discounted cash flow methodology at the incremental borrowing rate or the effective interest rate. Other financial liabilities categorized as Level 3 represent the present value of the estimated price we would pay to acquire any remaining outstanding shares upon exercise of a put option and any mandatory income distributions. The fair value of the liabilities is based on the average earnings before income tax, depreciation and amortization ("EBITDA") for the preceding years before the options’ exercise dates and EBITDA multiples in accordance with the put agreements as well as the expected amount of any mandatory income distributions. A change in EBITDA would impact the fair value of other financial liabilities and our net income (loss).
Derivative financial instruments are recorded at fair value with changes in fair value recorded in income unless the derivative is part of a qualifying hedging relationship for accounting purposes. The fair value of derivative financial instruments depends upon derivative types. The fair value of exchange-traded futures and options is determined using unadjusted quoted prices in active markets, while the fair value of OTC derivatives is determined using pricing models, such as a discounted cash flow method or other market standard valuation techniques, with primarily observable market inputs.
Valuation inputs used to price OTC derivatives may include swap interest rate curves, foreign exchange spot and forward rates, index prices, the value of underlying securities, projected dividends, volatility surfaces, and in limited circumstances, counterparty quotes.
The fair value of OTC derivative instruments also includes credit valuation adjustments to reflect the credit risk of both the derivative counterparty and ourselves as well as the impact of contractual factors designed to reduce our credit exposure, such as collateral and legal rights of offset under master netting agreements. Inputs into determining the appropriate credit valuation adjustments are typically obtained from publicly available information and include credit default swap spreads when available, credit spreads derived from specific bond yields, or published cumulative default experience data adjusted for current trends when credit default swap spreads are not available.
The fair value of other financial invested assets consists primarily of limited partnership investments which is based on net asset value ("NAV") provided by management of the limited partnership investments. Based on the unobservable nature of these NAVs, we do not assess whether applying reasonably possible alternative assumptions would have an impact on the fair value of the limited partnership investments.
Investment properties are recorded at fair value with changes in fair value recorded in income. The fair value of investment properties is generally determined using property valuation models that are based on expected capitalization rates and models that discount expected future net cash flows at current market interest rates reflective of the characteristics, location, and market of each property. Expected future net cash flows include contractual and projected cash flows and forecasted operating expenses, and take into account interest, rental and occupancy rates derived from market surveys. The estimates of future cash inflows, in addition to expected rental income from current leases, include projected income from future leases based on significant assumptions that are consistent with current market conditions. The future rental rates are estimated based on the location, type and quality of the properties, and take into account market data and projections at the valuation date. The fair values are typically compared to market-based information for reasonability, including recent transactions involving comparable assets. The methodologies and inputs used in these models are in accordance with real estate industry valuation standards. Valuations are prepared externally or internally by professionally accredited real estate appraisers.
Cash, cash equivalents and short-term securities are classified as held for trading for the purpose of meeting short-term cash requirements and accounted for at FVTPL due to their short-term nature or because they are frequently repriced to current market rates.
Investments for accounts of segregated fund holders are recorded at fair value with changes in fair value recorded in net realized and unrealized gains (losses) within the segregated fund and are not recorded in our Consolidated Statements of Operations. The fair value of investments for accounts of segregated fund holders is determined using unadjusted quoted prices in active markets or independent valuation information provided by investment managers. The fair value of direct investments within investments for accounts of segregated fund holders, such as short-term securities and government and corporate debt securities, is determined according to valuation methodologies and inputs described above in the respective asset type sections. The fair value of the secured borrowings from mortgage securitization is based on the methodologies and assumptions as described above for asset-backed securities.
The fair value of investment contracts is measured through the use of prospective discounted cash flow method. For unit-linked contracts, the fair value is equal to the current unit fund value, plus additional non-unit liability amounts on a fair value basis if required. For non-unit-linked contracts, the fair value is equal to the present value of contractual cash flow. The fair value of the investment contract liabilities approximate their carrying values due to the nature of the contracts.
106 December 31, 2024 Sun Life Financial Inc. MANAGEMENT'S DISCUSSION & ANALYSIS
The fair values of these obligations are based on the fair value of the underlying securities, which can include debt or equity securities. The method used to determine fair value is based on the quoted market prices where available in an active market.
The fair value of underlying assets within our CLOs is determined primarily using observable market inputs, such as quoted prices for similar assets in active markets and other observable market data.
The fair value of underlying liabilities within our CLOs is determined by discounting expected future contractual cash flows using a current market interest rate applicable to financial instruments with a similar yield, credit quality, maturity characteristics, and structural credit protections. The valuation technique maximizes the use of observable inputs that incorporates comparable securities’ prices and other market intelligence.
The methodologies and assumptions for determining the fair values of investment contract liabilities are included in Note 10.A of the 2024 Annual Consolidated Financial Statements.
We categorize our assets and liabilities carried at fair value, based on the priority of the inputs to the valuation techniques used to measure fair value, into a three-level fair value hierarchy as follows:
Level 1: Fair value is based on the unadjusted quoted prices for identical assets or liabilities in an active market. The types of assets and liabilities classified as Level 1 generally include cash and cash equivalents, certain U.S. government and agency securities, exchange-traded equity securities, and certain segregated and mutual fund units held for account of segregated fund holders.
Level 2: Fair value is based on quoted prices for similar assets or liabilities traded in active markets, or prices from valuation techniques that use significant observable inputs, or inputs that are derived principally from or corroborated with observable market data through correlation or other means. The types of assets and liabilities classified as Level 2 generally include Canadian federal, provincial and municipal government, other foreign government and corporate debt securities, certain asset-backed securities, OTC derivatives, and certain segregated and mutual fund units held for account of segregated fund holders.
Level 3: Fair value is based on valuation techniques that require one or more significant inputs that are not based on observable market inputs. These unobservable inputs reflect our expectations about the assumptions market participants would use in pricing the asset or liability. The types of assets and liabilities classified as Level 3 generally include certain corporate bonds, certain other invested assets, and investment properties.
As pricing inputs become more or less observable, assets are transferred between levels in the hierarchy. Total gains and losses in income and OCI are calculated assuming transfers into or out of Level 3 occur at the beginning of the period. For a financial instrument that transfers into Level 3 during the reporting period, the entire change in fair value for the period is included in the Level 3 reconciliation schedule in Note 5 of our 2024 Annual Consolidated Financial Statements. For transfers out of Level 3 during the reporting period, the change in fair value for the period is excluded from the Level 3 reconciliation schedule in Note 5 of our 2024 Annual Consolidated Financial Statements. Transfers into Level 3 occur when the inputs used to price the financial instrument lack observable market data and as a result, no longer meet the Level 1 or 2 criteria at the reporting date. Transfers out of Level 3 occur when the pricing inputs become more transparent and satisfy the Level 1 or 2 criteria at the reporting date.
Transfers into and out of Level 3 for financial assets were $624 million and $1,058 million for the year ended December 31, 2024, respectively, (December 31, 2023 - $390 million and $918 million, respectively). The total amount of the net realized/unrealized gains (losses) related to financial instruments transferred out of Level 3 during the period, which were excluded from the Level 3 reconciliation, was a gain of $2 million as at December 31, 2024 (December 31, 2023 - gain of $31 million).
Additional information on the fair value measurement of investments can be found in Note 5 of our 2024 Annual Consolidated Financial Statements.
Goodwill
Goodwill represents the excess of the cost of an acquisition over the fair value of the net identifiable tangible and intangible assets of the acquired businesses. Goodwill is carried at original cost less any impairment subsequently incurred. Goodwill is assessed for impairment annually or more frequently if events or circumstances occur that may result in the recoverable amount of a cash generating unit ("CGU") falling below its carrying value. A CGU is the smallest identifiable group of assets that generates cash inflows that are largely independent of cash inflows from other groups of assets. The goodwill balances are allocated to either individual or groups of CGUs that are expected to benefit from the synergies of the business combination. Goodwill impairment is quantified by comparing a CGU's or a group of CGU's carrying value to its recoverable amount, which is the higher of fair value less cost to sell and value in use. Impairment losses are recognized immediately and cannot be reversed in future periods.
There was no impairment charges on goodwill recognized in 2024. We had a carrying value of $9,456 million in goodwill as at December 31, 2024. Additional information on goodwill can be found in Note 9 of our 2024 Annual Consolidated Financial Statements.
Intangible Assets
Intangible assets consist of finite life and indefinite life intangible assets. Finite life intangible assets are amortized on a straight-line basis or using a units-of-production method, over the useful economic lives: i) Distribution, sales potential of field force, client relationships and asset administration contracts - 3 to 40 years ii) and internally generated software - 3 to 10 years. Amortization is charged through operating expenses. The useful lives of finite life intangible assets are reviewed annually, and the amortization is adjusted as necessary. Indefinite life intangibles are not amortized, and are assessed for impairment annually or more frequently if events or changes in circumstances indicate that the asset may be impaired. Impairment is assessed by comparing the carrying values of the indefinite life intangible assets to their recoverable amounts. The recoverable amount is the higher of an asset's fair value less costs to sell and its value in use. If the carrying values of the indefinite life intangibles exceed their recoverable amounts, these assets are considered impaired, and a charge for impairment is recognized in our Consolidated Statements of Operations. The recoverable amount of intangible assets is determined using various valuation models, which require management to make certain judgments and assumptions that could affect the estimates of the recoverable amount.
MANAGEMENT'S DISCUSSION & ANALYSIS Sun Life Financial Inc. December 31, 2024 107
Impairment charges on intangible assets of $201 million were recognized in 2024 (2023 - $5 million) primarily related to an intangible asset related to bancassurance in Vietnam reflecting updates resulting from changes in regulatory and macro-economic factors.
As at December 31, 2024, our finite life intangible assets had a carrying value of $3.8 billion, which reflected the value of the field force, asset administration contracts, and Client relationships acquired as part of the AAM, BGO, Crescent, Clarica, Dialogue, DentaQuest, U.S. employee benefits, and CMG Asia business acquisitions, the ACB and Dah Sing bancassurance partnerships, as well as software costs. Our indefinite life intangible assets had a carrying value of $1.2 billion as at December 31, 2024. The value of the indefinite life intangible assets reflected fund management contracts of MFS, BGO, InfraRed, Crescent and AAM. Additional information on intangible assets can be found in Note 9 of our 2024 Annual Consolidated Financial Statements.
Income Taxes
Income tax assets and liabilities for the current and prior periods are measured at the amount expected to be recovered from or paid to the taxation authorities. Deferred income tax is provided using the liability method. Our provision for income taxes is calculated based on the tax rates and tax laws that have been enacted or substantially enacted by the end of the reporting period.
As a multinational organization, we are subject to taxation in numerous jurisdictions. We seek to operate in a tax efficient manner while ensuring that we are in compliance with all laws and regulations. The determination of the required provision for current and deferred income taxes requires that we interpret tax legislation in the jurisdictions in which we operate and that we make assumptions about the expected timing of realization of deferred income tax assets and liabilities. Tax laws are complex and their interpretation requires significant judgment. The provision for income taxes reflects management's interpretation of the relevant tax laws and its best estimate of the income tax implications of the transactions and events during the period. We believe that our provisions for uncertain tax positions appropriately reflect the risk of tax positions that are under audit, dispute or appeal with tax authorities, or which are otherwise considered to involve uncertainty. The adequacy of our tax provision is reviewed at the end of each reporting period. To the extent that our interpretations differ from those of tax authorities or the timing of realization is not as expected, the provision for income taxes may increase or decrease in future periods to reflect actual experience. The amount of any increase or decrease cannot be reasonably estimated.
Deferred income tax assets are recognized for all deductible temporary differences, carry forward of unused tax losses and unused tax credits to the extent that it is probable that taxable profit will be available against which the temporary differences, unused tax losses and unused tax credits can be utilized. At each reporting period, we assess all available evidence, both positive and negative, to determine the amount of deferred income tax assets to be recorded. If it is probable that the benefit of tax losses and tax deductions will not be realized, a deferred income tax asset is not recognized. The assessment requires significant estimates and judgment about future events based on the information available at the reporting date.
From time to time, local governments, in countries in which we operate, enact changes to statutory corporate income tax rates. These changes require us to review and re-measure our deferred tax assets and liabilities as of the date of enactment. As at December 31, 2024, our net deferred tax asset in the Consolidated Statements of Financial Position was $3,624 million, primarily in Canada. Any future tax rate reductions in jurisdictions where we carry a net deferred tax asset, could result in a reduction in the carrying value of the deferred tax asset and a corresponding income tax expense at the time of substantial enactment of a rate reduction.
The Pillar Two global minimum tax rules apply to us effective January 1, 2024 and have been substantively enacted in several jurisdictions in which we operate, including Canada, whose Global Minimum Tax Act became enacted in June 2024. The Pillar Two legislation requires the ultimate parent entity of a group to pay top-up tax, on a jurisdiction-by-jurisdiction basis, on profits of its subsidiaries that are taxed below 15%. Our subsidiaries that are currently subject to a statutory rate or to a tax regime that could result in taxing profits at a rate below 15% include those in Bermuda, Hong Kong and Ireland. The Pillar Two legislation increased the effective tax rate on underlying net income by approximately one to two percentage points in 2024. The Q1'24 impacts, which were recorded in Q2'24 due to the timing of the legislation's enactment, are recorded in reported net income in Other adjustments and are not reflected in underlying net income. For additional information, refer to Note 19 of our Consolidated Financial Statements.
On December 27, 2023, Bermuda enacted its Corporate Income Tax Act 2023, which will apply a 15% income tax beginning on January 1, 2025. The enacted legislation provides an economic transition adjustment that aligns an entity’s starting point for the tax regime more closely with its economic position prior to the application of the Corporate Income Tax Act 2023. The benefit of this economic transition adjustment was recognized in 2023. The Bermuda Corporate Income Tax is not expected to have a material impact on Sun Life’s consolidated financial statements when it becomes effective in 2025.
Pension Plans and Other Post-Retirement Benefits
The Company sponsors defined benefit pension plans and defined contribution plans for eligible employees. All of our significant defined benefit plans worldwide are closed to new entrants with new hires participating in defined contribution plans. Our defined benefit pension plans offer benefits based on length of service and final average earnings and certain plans offer some indexation of benefits. We maintain certain supplementary non-contributory defined benefit pension arrangements for eligible employees, which are primarily for benefits which are in excess of local tax limits. In addition to these plans, in some countries the Company sponsors certain post-retirement benefit plans (for medical, dental and/or life insurance benefits) for eligible qualifying employees and their dependents who meet certain requirements.
In Canada, since January 1, 2009, all new employees participate in a defined contribution plan, while existing employees continue to accrue future benefits in the prior plan which provides a defined benefit plan and an optional contributory defined contribution plan.
With the closure of the Canadian defined benefit plans to new entrants, the volatility associated with future service accruals for active members has been limited and will decline over time. As at December 31, 2024, there are no active employees accruing future service benefits in the U.S. defined benefit plans.
The major risks remaining in relation to past service obligations are increases in liabilities due to a decline in discount rates, greater life expectancy than assumed and adverse asset returns. We have significantly de-risked the investments of our material defined benefit pension plans Company-wide by systematically shifting the pension asset mix towards liability matching investments. The target for our significant plans is to minimize volatility in funded status arising from changes in discount rates and exposure to equity markets.
108 December 31, 2024 Sun Life Financial Inc. MANAGEMENT'S DISCUSSION & ANALYSIS
Due to the long-term nature of these defined benefit plans, the calculation of benefit expenses and accrued benefit obligations depends on various assumptions, including discount rates, rates of compensation increases, health care cost trend rates, retirement ages, mortality rates and termination rates. Based upon consultation with external pension actuaries, management determines the assumptions used for these plans on an annual basis. The discount rate used for our significant defined benefit plans is determined with reference to market yields of high-quality corporate bonds that are denominated in the same currency in which the benefits will be paid, and that have terms to maturity approximating the terms of obligations.
Actual experience may differ from that assumed, which would impact the valuation of defined benefit plans and the level of benefit expenses recognized in future years. Details of our pension and post-retirement benefit plans and the key assumptions used for the valuation these plans are included in Note 24 of our 2024 Annual Consolidated Financial Statements.
2. Changes in Accounting Policies
We have included in this section a summary of changes in accounting policies. Where there are references to Notes, these are part of our 2024 Annual Consolidated Financial Statements.
We have included in this section a summary of changes in accounting policies. Where there are references to Notes, these are part of our 2024 Annual Consolidated Financial Statements.
2.A New and Amended International Financial Reporting Standards Adopted in 2024
In September 2022, the IASB issued amendments to IFRS 16 Leases to add subsequent measurement requirements for sale and leaseback transactions that satisfy the requirements in IFRS 15 Revenue from Contracts with Customers to be accounted for as a sale. The amendments require a seller-lessee to subsequently measure lease liabilities arising from a leaseback in a way that it does not recognize any amount of the gain or loss that relates to the right of use it retains. The adoption of this amendment, effective January 1, 2024, did not have a material impact on our Consolidated Financial Statements.
2.B New and Amended International Financial Reporting Standards to be Adopted in 2025 or Later
In April 2024, the IASB issued IFRS 18 Presentation and Disclosure in Financial Statements ("IFRS 18") which replaces IAS 1 Presentation of Financial Statements. IFRS 18 introduces new requirements on presentation within the statement of profit or loss, disclosure of management-defined performance measures, and principles for aggregation and disaggregation of financial information in the financial statements and the notes. IFRS 18 will be effective for annual reporting periods beginning on or after January 1, 2027. IFRS 18 is to be applied retrospectively. We are currently assessing the impact that IFRS 18 will have on our Consolidated Financial Statements.
In May 2024, the IASB issued amendments to IFRS 9 and IFRS 7 Financial Instruments: Disclosures. The amendments clarify the derecognition of a financial liability settled through electronic transfer and introduces an accounting policy option to derecognize a financial liability settled through electronic transfer before the settlement date, if specific criteria are met. The amendments additionally clarify the classification of financial assets with environmental, social and corporate governance and similar features and also required additional disclosures for certain financial instruments. The amendments will be effective for annual reporting periods beginning on or after January 1, 2026. The amendments are to be applied retrospectively. We are currently assessing the impact of these amendments on our Consolidated Financial Statements.
3. Disclosure Controls and Procedures
The Company has established disclosure controls and procedures that are designed to provide reasonable assurance that all relevant information is gathered and reported to senior management, including the Company's President and CEO, Executive Vice-President and Chief Financial Officer ("CFO"), and Executive Vice-President, Chief Legal Officer and Public Affairs, on a timely basis so that appropriate decisions can be made regarding public disclosure.
An evaluation of the effectiveness of our disclosure controls and procedures, as defined under rules adopted by the Canadian securities regulatory authorities and the SEC, as at December 31, 2024, was carried out under the supervision of and with the participation of the Company's management, including the CEO and the CFO. Based on our evaluation, the CEO and the CFO concluded that the design and operation of these disclosure controls and procedures were effective as at December 31, 2024.
Management's Report on Internal Control over Financial Reporting
Management is responsible for establishing and maintaining adequate internal control over financial reporting to provide reasonable assurance regarding the reliability of our financial reporting and the preparation of our financial statements in accordance with IFRS.
Due to its inherent limitations, internal control over financial reporting may not prevent or detect misstatements on a timely basis. Projections of any evaluation of the effectiveness of internal control over financial reporting to future periods are subject to the risk that the controls may become inadequate because of changes in conditions, or that the degree of compliance with the policies or procedures may deteriorate.
We conducted an assessment of the effectiveness of our internal control over financial reporting, as of December 31, 2024, based on the framework and criteria established in Internal Control-Integrated Framework (2013), issued by the Committee of Sponsoring Organizations of the Treadway Commission. Based on that assessment, we have concluded that our internal control over financial reporting was effective as of December 31, 2024.
Our internal control over financial reporting, as of December 31, 2024, has been audited by the Company's external auditor, Deloitte LLP, Independent Registered Public Accounting Firm, who also audited our Annual Consolidated Financial Statements for the year ended December 31, 2024. As stated in the Report of Independent Registered Public Accounting Firm, they have expressed an unqualified opinion on our internal control over financial reporting as of December 31, 2024.
MANAGEMENT'S DISCUSSION & ANALYSIS Sun Life Financial Inc. December 31, 2024 109
Changes in Internal Control over Financial Reporting
No changes were made in our internal control over financial reporting for the period which began on January 1, 2024 and ended December 31, 2024 that have materially affected or are reasonably likely to materially affect our internal control over financial reporting.
| O. Legal and Regulatory Proceedings | |||||
Information concerning legal and regulatory matters is provided in our Annual Consolidated Financial Statements and the AIF, in each case for the year ended December 31, 2024.
| P. Forward-looking Statements | |||||
From time to time, the Company makes written or oral forward-looking statements within the meaning of certain securities laws, including the “safe harbour” provisions of the United States Private Securities Litigation Reform Act of 1995 and applicable Canadian securities legislation. Forward-looking statements contained in this document include statements (i) relating to our strategies, plans, targets, goals and priorities; (ii) relating to our growth initiatives and other business objectives; (iii) relating to estimated future payments for acquisition-related contingent considerations and options to purchase the remaining ownership interests of SLC Management affiliates; (iv) relating to the actions reflected in the restructuring charge recorded in Q2'24 (including expected annual savings resulting from such actions); (v) relating to the expected impact of the Pillar Two legislation on the effective tax rate on underlying net income; (vi) relating to the use of proceeds from the offering of the Series 2024-1 Subordinated Unsecured 5.12% Fixed/Floating Debentures due 2036; (vii) set out in this document under the heading I - Risk Management - Market Risk Sensitivities - Interest Rate Sensitivities; (viii) relating to expected changes in our LICAT ratio; (ix) that are predictive in nature or that depend upon or refer to future events or conditions; and (x) that include words such as “achieve”, “aim”, “ambition”, “anticipate”, “aspiration”, “assumption”, “believe”, “could”, “estimate”, “expect”, “goal”, “initiatives”, “intend”, “may”, “objective”, “outlook”, “plan”, “project”, “seek”, “should”, “strategy”, “strive”, “target”, “will”, and similar expressions. Forward-looking statements include the information concerning our possible or assumed future results of operations. These statements represent our current expectations, estimates, and projections regarding future events and are not historical facts, and remain subject to change.
Forward-looking statements are not a guarantee of future performance and involve risks and uncertainties that are difficult to predict. Future results and shareholder value may differ materially from those expressed in these forward-looking statements due to, among other factors, the matters set out in this document under the headings C - Profitability - 5 - Income taxes, F - Financial Strength and K - Risk Management and in SLF Inc.’s 2024 AIF under the heading Risk Factors, and the factors detailed in SLF Inc.’s other filings with Canadian and U.S. securities regulators, which are available for review at www.sedarplus.ca and www.sec.gov, respectively.
Medium-Term Financial Objectives
The Company's medium-term financial objectives set out in section B - Overview - 2 - Financial Objectives are forward-looking non-IFRS financial measures. Our ability to achieve those objectives is dependent on our success in achieving growth initiatives and business objectives and on certain key assumptions that include: (i) no significant changes in the level of interest rates; (ii) average total return on real estate and equity investments of approximately 8% per annum; (iii) credit experience in line with expectations; (iv) no significant changes in the level of our regulatory capital requirements; (v) no significant changes to our effective tax rate; (vi) no significant increase in the number of shares outstanding; and (vii) other key assumptions include: no material changes to our hedging program, hedging costs that are consistent with our expectations, no material assumption changes and no material accounting standard changes. Our underlying ROE is dependent upon capital levels and options for deployment of excess capital. Our medium-term financial objectives do not reflect the indirect effects of interest rate and equity market movements including the potential impacts on goodwill or the current valuation allowance on deferred tax assets as well as other items that may be non-operational in nature.
Our target dividend payout ratio of 40%-50% of our underlying net income assumes that economic conditions and our results will enable us to maintain our payout ratio in the target range, while maintaining a strong capital position. The declaration, amount and payment of dividends is subject to the approval of SLF Inc.'s Board of Directors and our compliance with the capital requirements in the Insurance Companies Act (Canada). Additional information on dividends is provided in the section J - Capital and Liquidity Management - 3 - Shareholder Dividends in this MD&A.
Although considered reasonable by the Company, we may not be able to achieve our medium-term financial objectives as the assumptions on which these objectives were based may prove to be inaccurate. Accordingly, our actual results could differ materially from our medium-term financial objectives as described in the section B - Overview - 2 - Financial Objectives in this MD&A. Our medium-term financial objectives do not constitute guidance.
Risk Factors
Important risk factors that could cause our assumptions and estimates, and expectations and projections to be inaccurate and our actual results or events to differ materially from those expressed in or implied by the forward-looking statements contained in this document, are set out below. The realization of our forward-looking statements essentially depends on our business performance which, in turn, is subject to many risks. Factors that could cause actual results to differ materially from expectations include, but are not limited to: market risks - related to the performance of equity markets; changes or volatility in interest rates or credit spreads or swap spreads; real estate investments; fluctuations in foreign currency exchange rates; and inflation; insurance risks - related to mortality experience, morbidity experience and longevity; policyholder behaviour; product design and pricing; the impact of higher-than-expected future expenses; and the availability, cost and effectiveness of reinsurance; credit risks - related to issuers of securities held in our investment portfolio, debtors, structured securities, reinsurers, counterparties, other financial institutions and other entities; business and strategic risks - related to global economic and geopolitical conditions; the design and implementation of business strategies; changes in distribution channels or Client behaviour including risks relating to market conduct by intermediaries and agents; the impact of competition; the performance of our investments and investment portfolios managed for Clients such as segregated and mutual funds; shifts in investing trends and Client preference towards products that differ from our investment products and strategies; changes in the legal or regulatory environment, including capital requirements and tax laws; environmental and social issues and their related laws and regulations; operational risks - related to breaches or
110 December 31, 2024 Sun Life Financial Inc. MANAGEMENT'S DISCUSSION & ANALYSIS
failure of information system security and privacy, including cyber-attacks; our ability to attract and retain employees; legal, regulatory compliance and market conduct, including the impact of regulatory inquiries and investigations; the execution and integration of mergers, acquisitions, strategic investments and divestitures; our information technology infrastructure; a failure of information systems and Internet-enabled technology; dependence on third-party relationships, including outsourcing arrangements; business continuity; model errors; information management; liquidity risks - the possibility that we will not be able to fund all cash outflow commitments as they fall due; and other risks - changes to accounting standards in the jurisdictions in which we operate; risks associated with our international operations, including our joint ventures; market conditions that affect our capital position or ability to raise capital; downgrades in financial strength or credit ratings; and tax matters, including estimates and judgements used in calculating taxes.
The Company does not undertake any obligation to update or revise its forward-looking statements to reflect events or circumstances after the date of this document or to reflect the occurrence of unanticipated events, except as required by law.
MANAGEMENT'S DISCUSSION & ANALYSIS Sun Life Financial Inc. December 31, 2024 111