附件 (C)(5)

董事會特別委員會2024年7月28日私人及機密簡報
這些資料和此處所載的信息是由Craig-Hallum Capital Group LLC("我們"或"Craig-Hallum")為Cepton, Inc.("Cepton"或"公司")的董事會特別委員會("特別委員會")受益和使用而準備的,涉及Cepton與KOITO MANUFACTURING CO. , LTD.("母公司")之間拟议交易的考慮。這些材料和此處所包含的信息屬於保密信息,僅供討論之用,任何人或實體都不得依靠它們,除非按照我們參與條件的書面同意提供;未經我們事先書面同意,不得公開披露。這些材料並未根據任何證券法或其他法律、規則或法規的任何披露標準準備,Craig-Hallum對特別委員會以外的人使用材料不承擔任何責任。這裡所載的材料和信息僅針對Cepton的特別委員會,目的是在2024年7月28日Cepton特別委員會的會議上提供Craig-Hallum的意見。在過去,我們曾向該公司提供投資銀行和財務顧問服務,並收取了提供該等服務的費用。這些服務包括作為資本市場顧問,協助Growth Capital Acquisition Corporation("GCAC")與Cepton之間於2022年2月完成的業務組合有關,我們按照慣例收取相應的報酬。此處所載的信息是由Craig-Hallum根據Cepton管理層提供的信息和公開信息準備的,並且此處所載的信息或所依賴的部分信息可能基於Cepton管理層就Cepton預期未來業務表現提供的某些聲明、估計、預測,包括但不限於財務預測、純營業虧損利益的估計以及未來利用率的預測。我們倚賴並假設準確性和完整性,並未獨立驗證此類信息。對於我們分析所依賴或使用的任何估計或預測信息,我們依賴於Cepton的保證,即此類信息是根據行業慣例合理準備的,反映出管理層對未來業務表現或利用率的最佳目前可用估計和判斷,我們對此類估計或預測或其基礎假設不承擔責任。我們並未對Cepton任何資產或負債進行任何獨立的估值或評估,也未收到任何此類估值或評估的報告。此處所載的信息是基於截至此處的經濟、市場和其他情況,和在此處的資訊壩前我們獲得的資訊,除非另有說明。儘管後續發展可能會影響材料,Craig-Hallum沒有義務更新、修訂或重申材料。這些材料不涉及Cepton特別委員會或任何其他方決定繼續進行拟议交易的基本業務決策,或者相對於可能對Cepton存在的任何替代交易的交易優點。這些材料不構成任何意見,也不構成對Cepton特別委員會、Cepton的非關聯股東或任何其他人如何行動或投票有所建議,或者是否買入或賣出任何公司的資產或證券。Craig-Hallum的唯一意見(如果有)是實際交付給Cepton特別委員會的意見。這些材料的準備是一個複雜的過程,涉及質量和定量判斷和擬定,涉及財務、比較和其他分析方法,以及适用這些方法到所提出的獨特事實和情況,並且不容易進行部分分析或簡要描述。Craig-Hallum未給予其考慮的任何分析或因素特定權重,而是對每個分析或因素的重要性和相關性做出質量判斷。所包含的分析必須全面考慮,挑選部分分析、分析方法和因素而不考慮所有分析和因素可能會產生一個誤導或不完整的觀點。此處所載的材料反映了對行業表現、一般業務、經濟、監管、市場和財務狀況等事项的判斷和假設,其中許多事项超出了拟议交易參與者的控制。材料中包含的任何價值估計不一定反映實際價值或對未來結果或價值的預測,後者可能會明顯比預期更有利或不利。此外,任何與資產、業務或證券價值有關的分析並不是估價,也不反映任何資產、業務或證券可能實際出售的價格。本演示文稿中使用但未另行定義的大寫術語的含義應當是指定於2024年7月26日由母公司、Cepton和Merger子公司("合併協議")提供給Craig-Hallum的2024年7月29日簽署的合併协议。
目錄 I. 拟议交易简介和概述 4 II. 分析范围和公司财务概况 8 III. 估值分析 21 附录 A. 选定上市公司描述 b. 加权平均成本資本 21 24 3

私密且機密⼀。本⽂會扼要介紹並概述擬議交易。
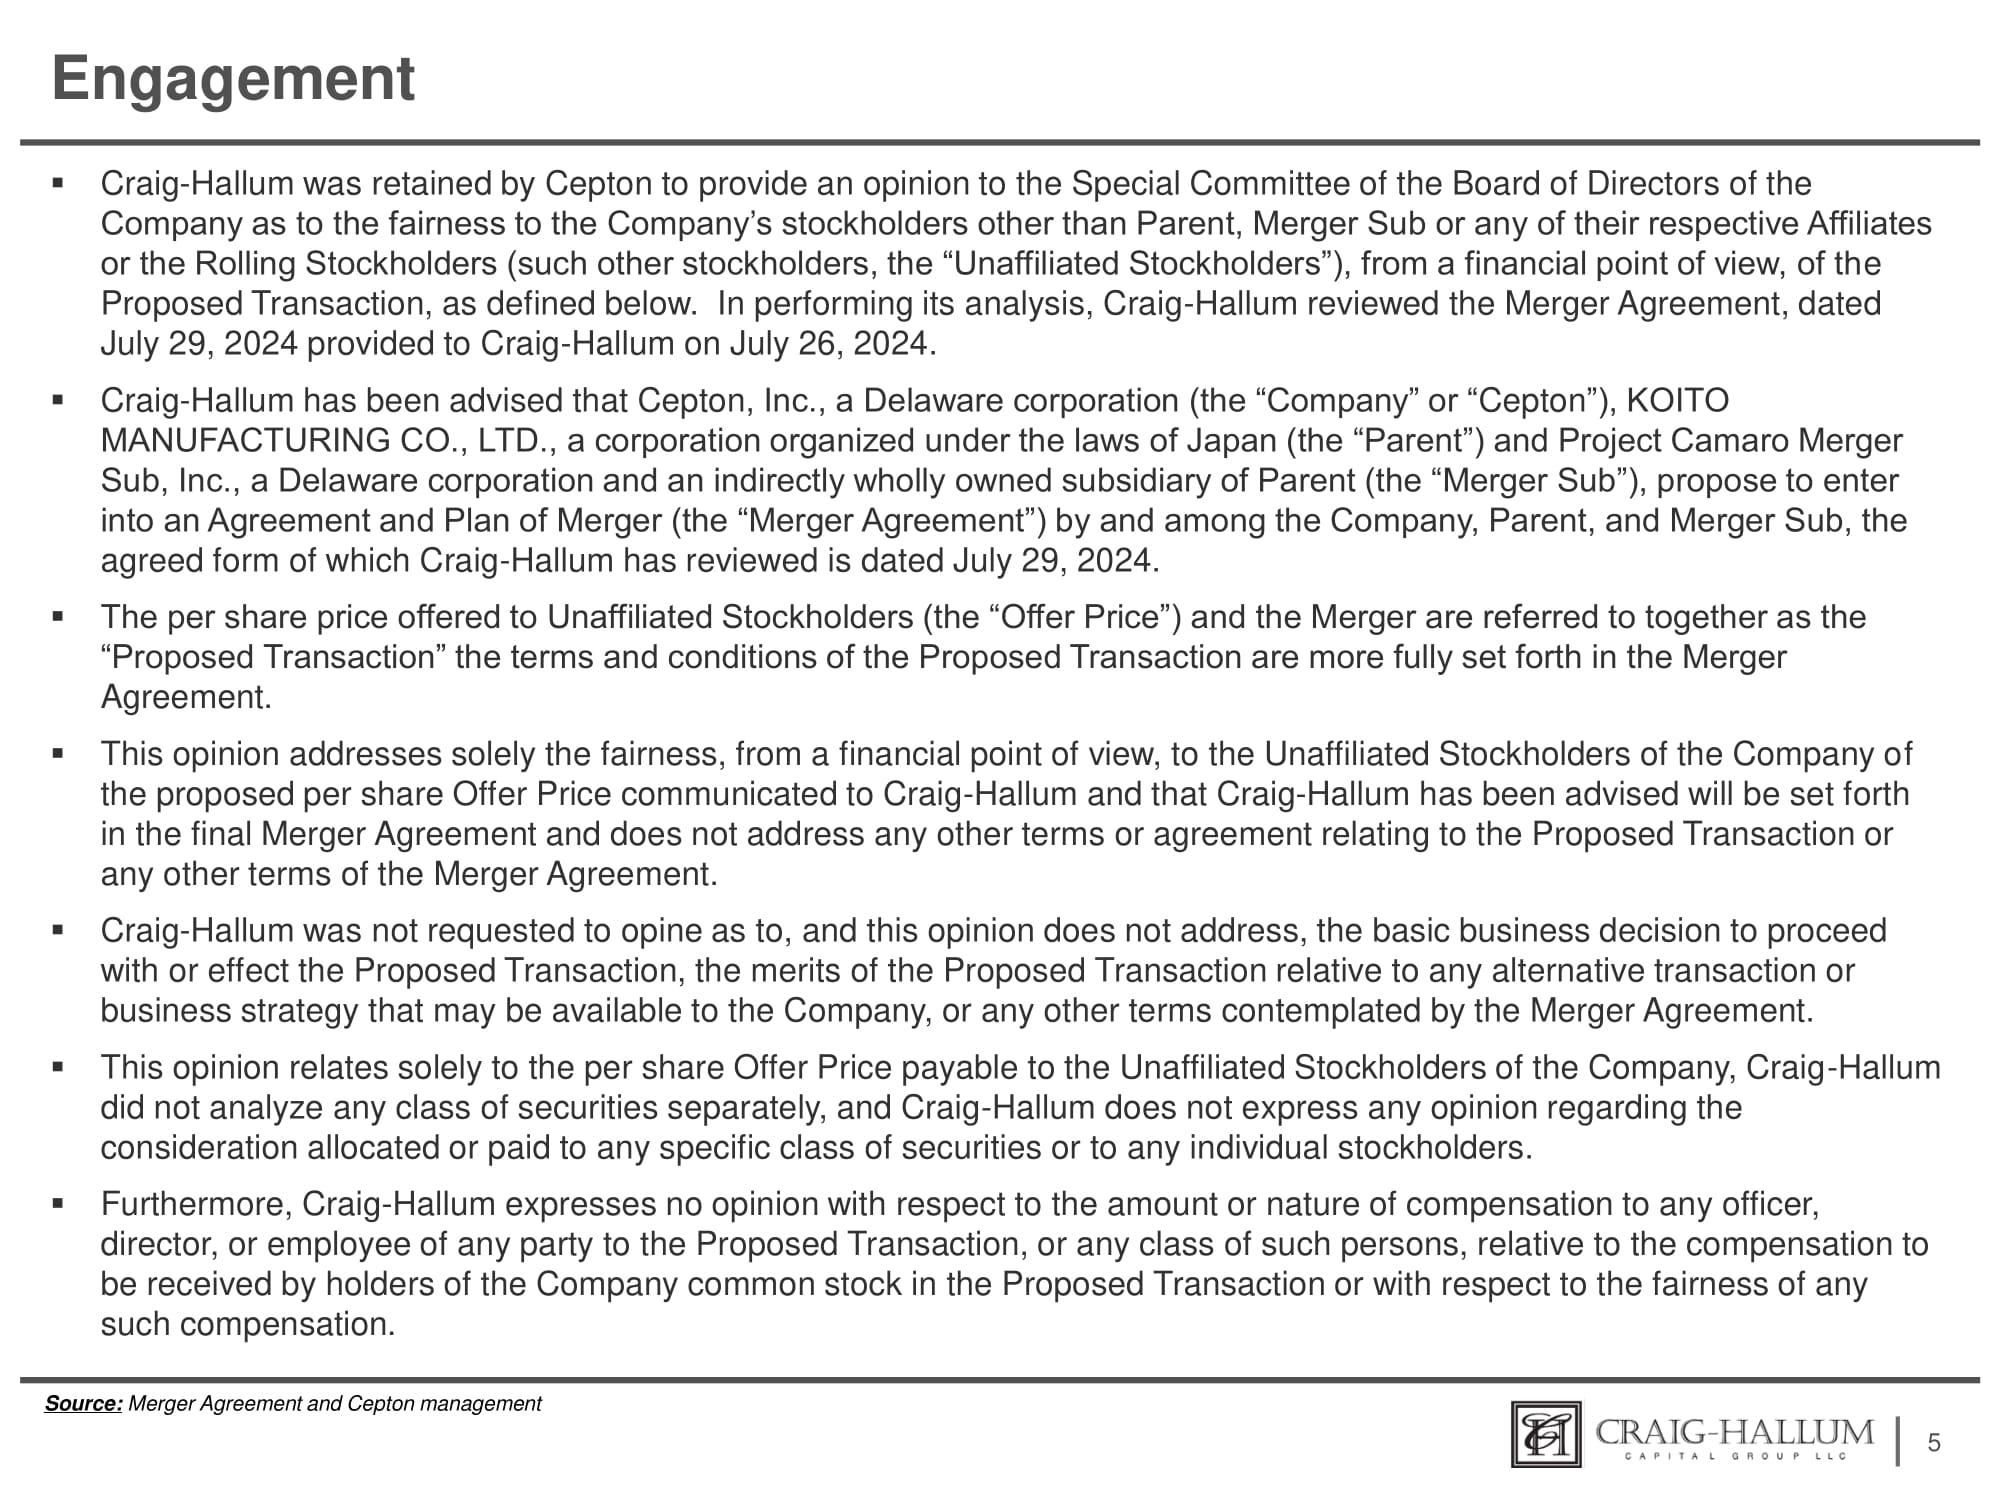
Engagement ▪ Craig - Hallum被Cepton聘請,以提供對董事會特別委員會的意見,該意見關於公司股東(父母公司、併購子公司或任何相關聯公司以外的其他股東,即“非相關股東”)在財務角度上對所提交的交易的公平性,如下所定義。在進行分析時,Craig - Hallum查閱了2024年7月26日提交給Craig - Hallum的併購協議,併購協議擬定版本的日期為2024年7月29日。▪ Craig - Hallum已獲知,特定交易(以下定義)的Cepton公司(以下簡稱“公司”或“Cepton”)是一家德拉瓦州公司,KOITO MANUFACTURING CO.,LTD.是根據日本法律組織成立的公司(以下簡稱“母公司”),而Project Camaro Merger Sub, Inc.是母公司間接完全擁有的一家德拉瓦州公司,並計劃進行合併(以下簡稱“Merger Sub”),合併協議及計劃(以下簡稱“合併協議”)由公司、母公司和Merger Sub共同簽署,Craig - Hallum查閱的版本日期為2024年7月29日。▪此處向非相關股東提供的每股價格(“收購價”)和合併一起被稱為“特定交易”,特定交易的條件和條款在合併協議中有更詳盡說明。▪此意見僅就公司的非相關股東對以提供給Craig - Hallum並且據悉將在最終合併協議中確定的每股收購價的公平性,從財務角度來看進行。並且不涉及與特定交易相關的任何其他條款或協議,或合併協議的任何其他條款。▪Craig - Hallum並未要求對進行或實施特定交易的基本業務決策發表意見,也未評估與可能對公司可用的任何其他交易或業務策略相比,特定交易的價值,或合併協議所涉及的其他任何條款。▪此意見僅涉及支付給公司的非相關股東的每股收購價,Craig - Hallum未對任何證券類別進行分析,並且Craig - Hallum不對分配給或支付給任何特定證券類別或任何個別股東的考慮表達任何意見。▪此外,Craig - Hallum對於任何交易各方的任何高階主管、董事或員工或任何此類人員類別相對於預計在該交易中收到公司普通股持有人的報酬的報酬金額或性質,不表達任何意見,亦不對任何此類報酬的公平性表達意見。5來源:併購協議及Cepton管理
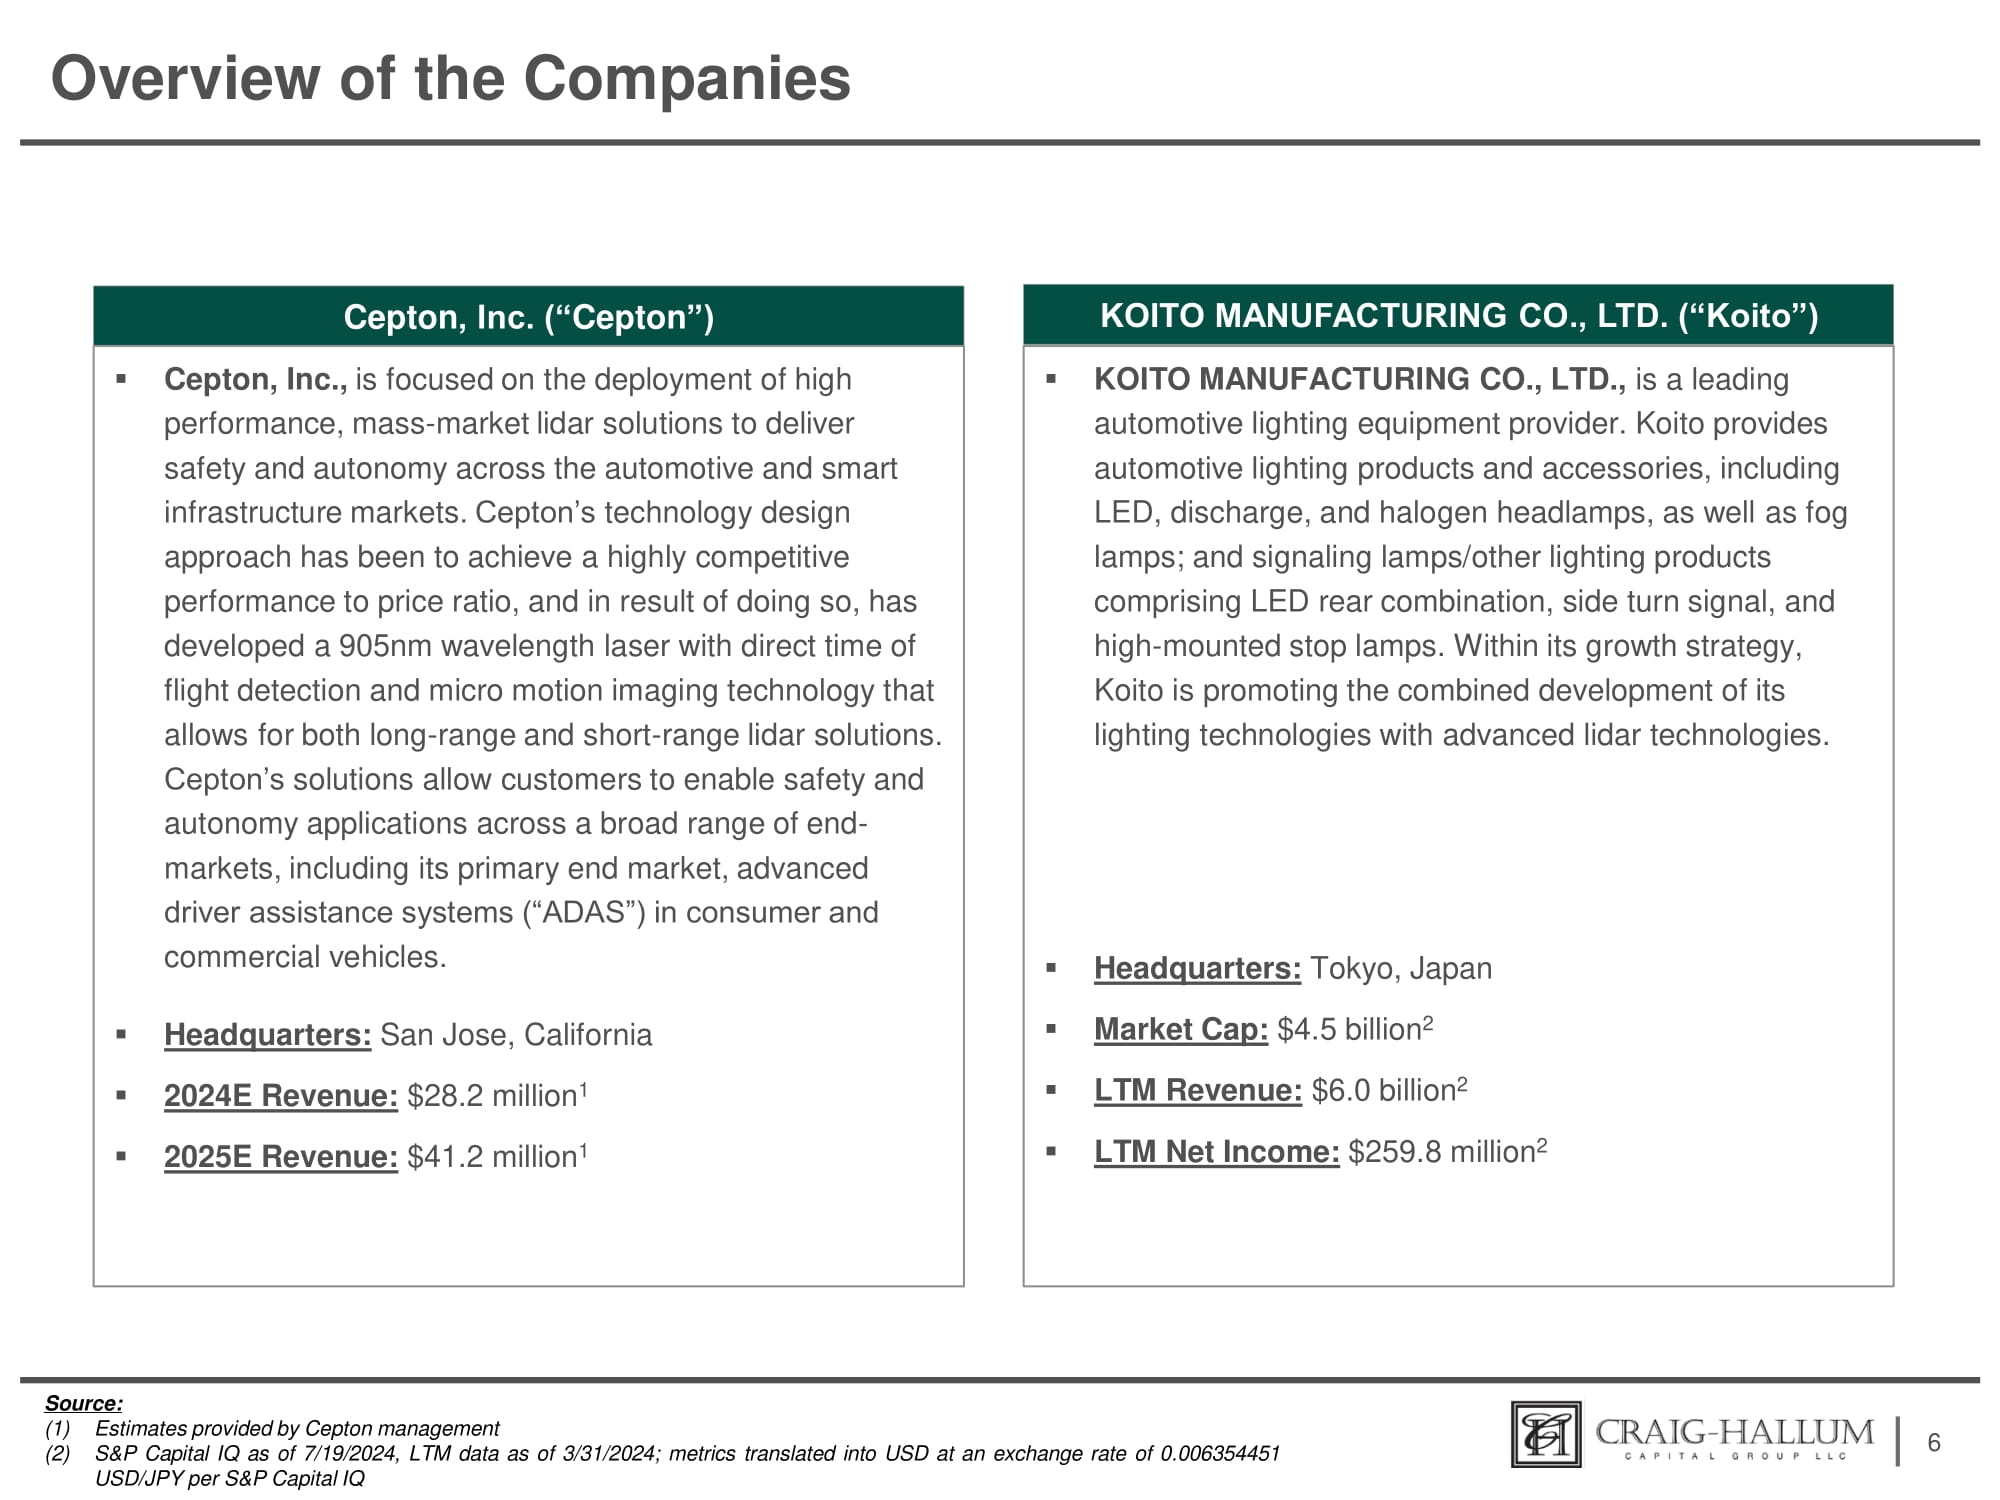
公司概況6 Cepton, Inc.(Cepton)小糠製造業株式會社(Koito) • Cepton, Inc.專注於部署高性能、大衆市場激光雷達解決方案,以在汽車和智能基礎設施市場實現安全和自主性。 Cepton的技術設計方法是實現極具競爭力的性能價格比,由此而產生了一款具有直接飛行時間檢測和微運動成像技術的905納米波長激光器,可實現長距離和短距離激光雷達解決方案。 Cepton的解決方案使客戶能夠在廣泛的終端市場中實現安全性和自主應用,包括其主要終端市場,消費和商用車輛中的先進駕駛輔助系統(ADAS)。 • 總部:加利福尼亞州聖何塞 • 2024財年營業收入:2820萬美元 1 • 2025財年營業收入:4120萬美元 1 • 小糠製造業株式會社(Koito)是領先的汽車照明設備供應商。小糠提供汽車照明產品和配件,包括LED、放電和鹵素大燈,以及霧燈;以及信號燈/其他照明產品,包括LED後組合、側轉向信號和高位剎車燈。在其增長戰略中,小糠正在推動其照明技術與先進激光雷達技術的聯合發展。 • 總部:日本東京 • 市值:450億美元 2 • 最近12個月營業收入:600億美元 2 • 最近12個月淨利潤:25980萬美元 2 資料來源:(1)Cepton管理層提供的估計數據(2)截至2024年7月19日的S&P Capital IQ數據,截至2024年3月31日的最近12個月數據;根據S&P Capital IQ每美元兌換日元0.006354451美元的匯率轉換的指標。
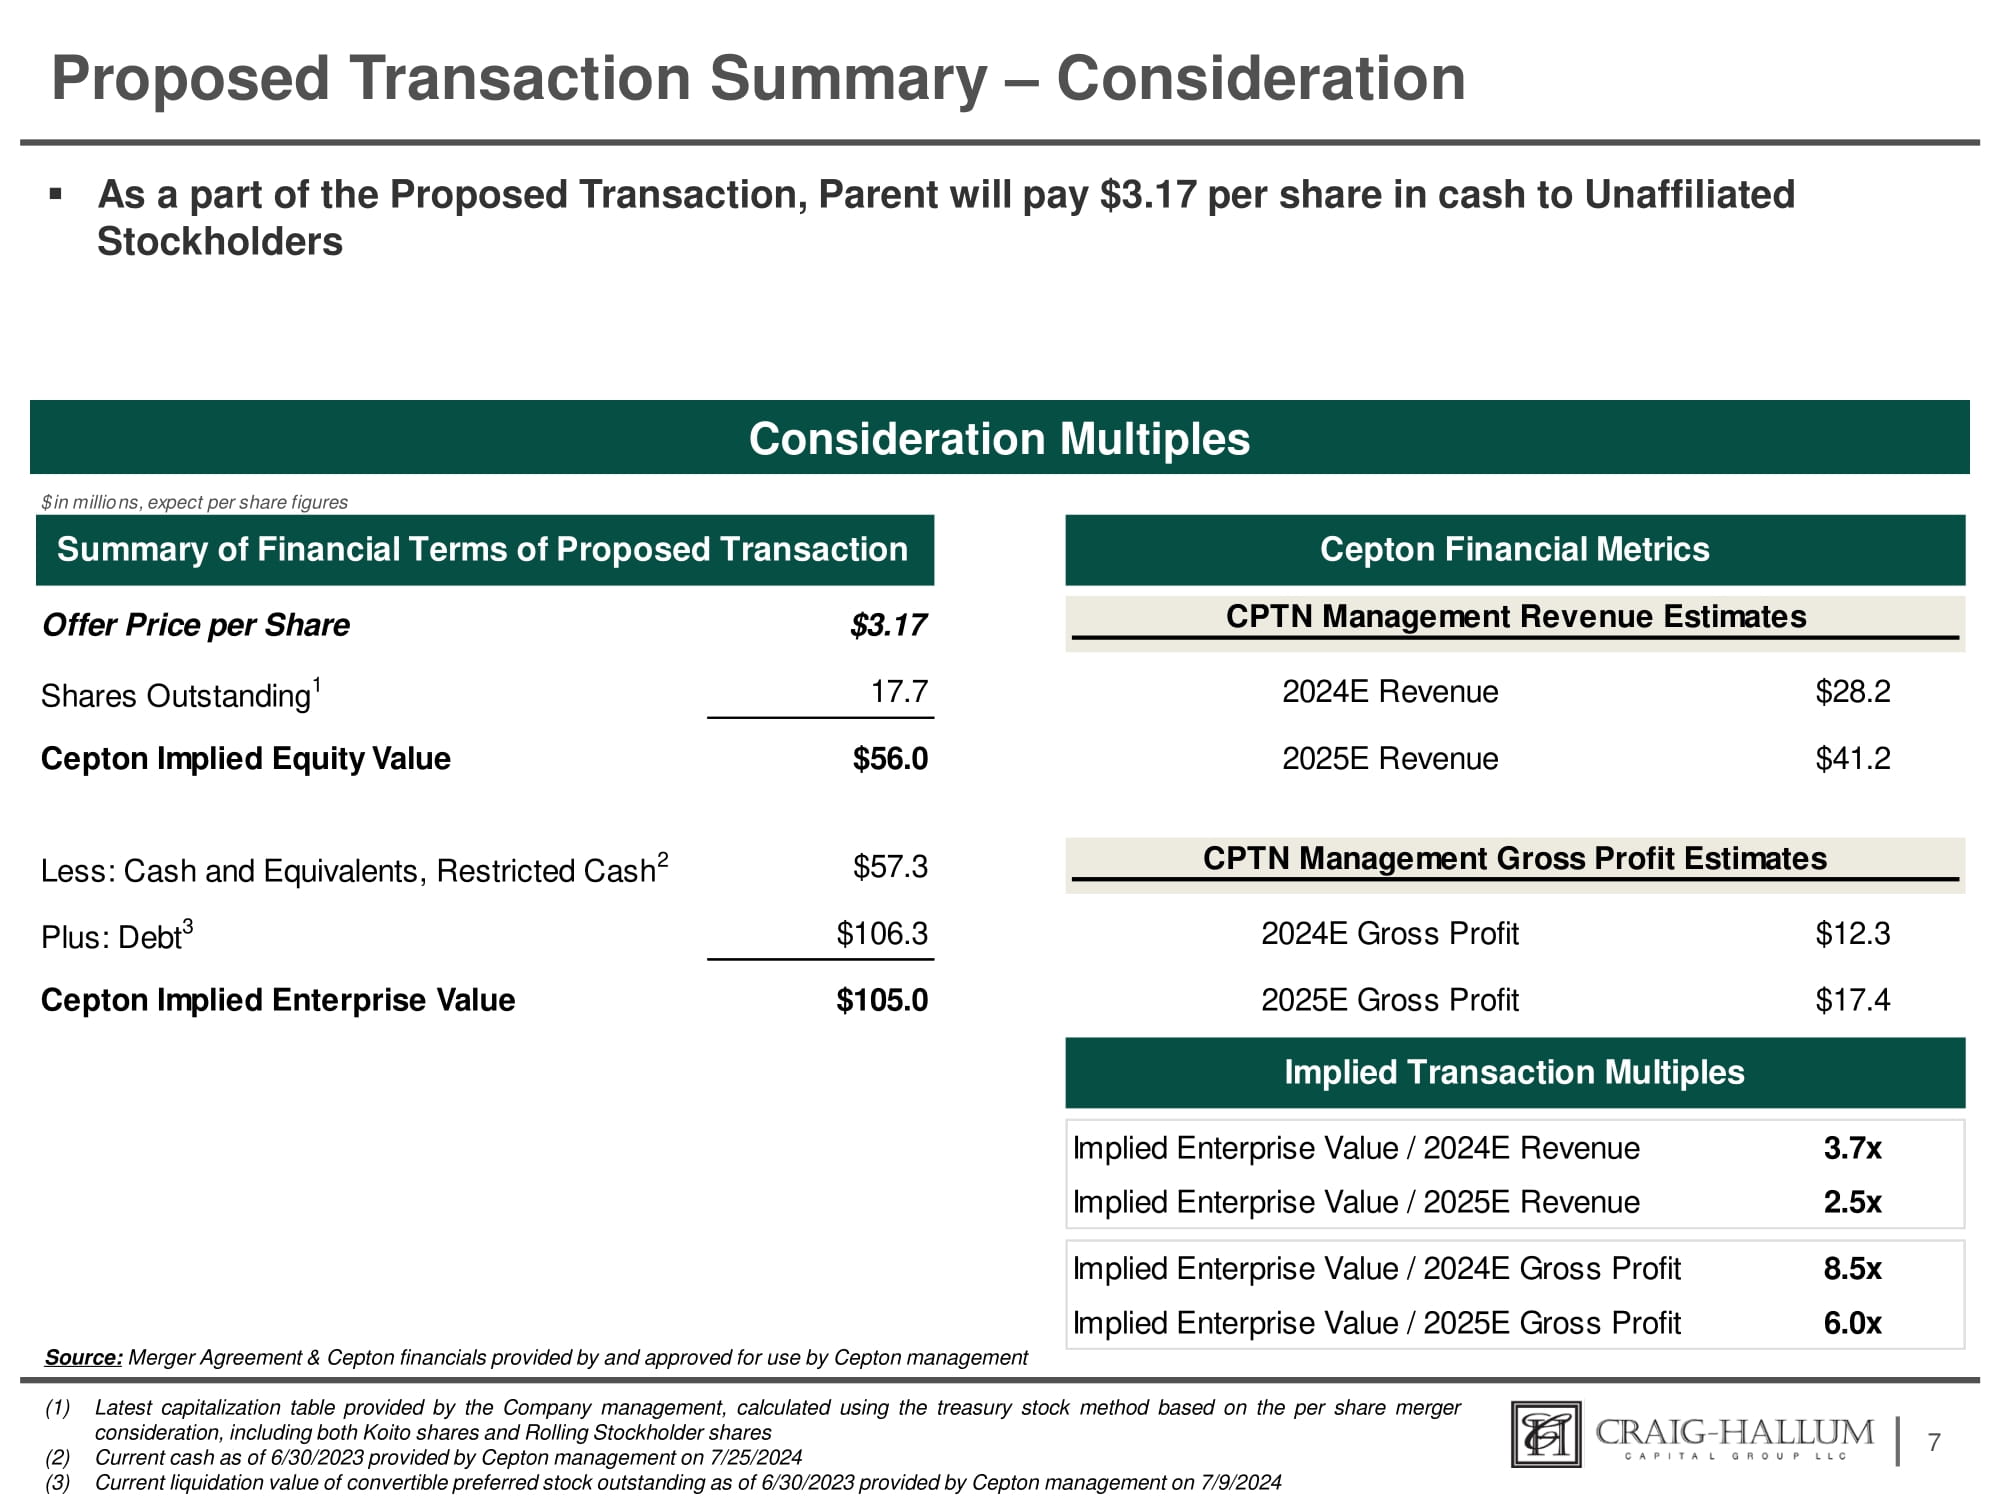
擬議交易摘要 - 對價 ▪ 作爲擬議交易的一部分,母公司將向非關聯股東支付每股3.17美元現金 7 對價倍數來源:合併協議和Cepton管理層提供並獲批准使用的財務數據 1. 最新股本結構表由公司管理層提供,根據每股併購對價使用庫藏股法計算,包括Koito股份和Rolling股東股份 2. 截至2023年6月30日Cepton管理層於2024年7月25日提供的當前現金 3. 2023年6月30日的當前可轉換優先股清算價值由Cepton管理層於2024年7月9日提供 CPTN管理層估算的收入$3.17 每股報價$28.2 2024E收入17.7 流通股數1 $41.2 2025E收入$56.0 Cepton隱含股權價值(以百萬美元爲單位,期望每股數據 減:現金及等價物、限制性現金2 $57.3 $12.3 2024E毛利潤$106.3 加:債務3 $17.4 2025E毛利潤$105.0 Cepton暗示企業價值 暗示企業價值/2024E收入 暗示企業價值/2025E收入3.7x 2.5x 暗示企業價值/2024E毛利潤 暗示企業價值/2025E毛利潤8.5x 6.0x 擬議交易財務條款摘要 暗示交易倍數 Cepton財務指標 CPTN管理層毛利潤估算
私密且機密 II. 分析範圍和公司財務概覽
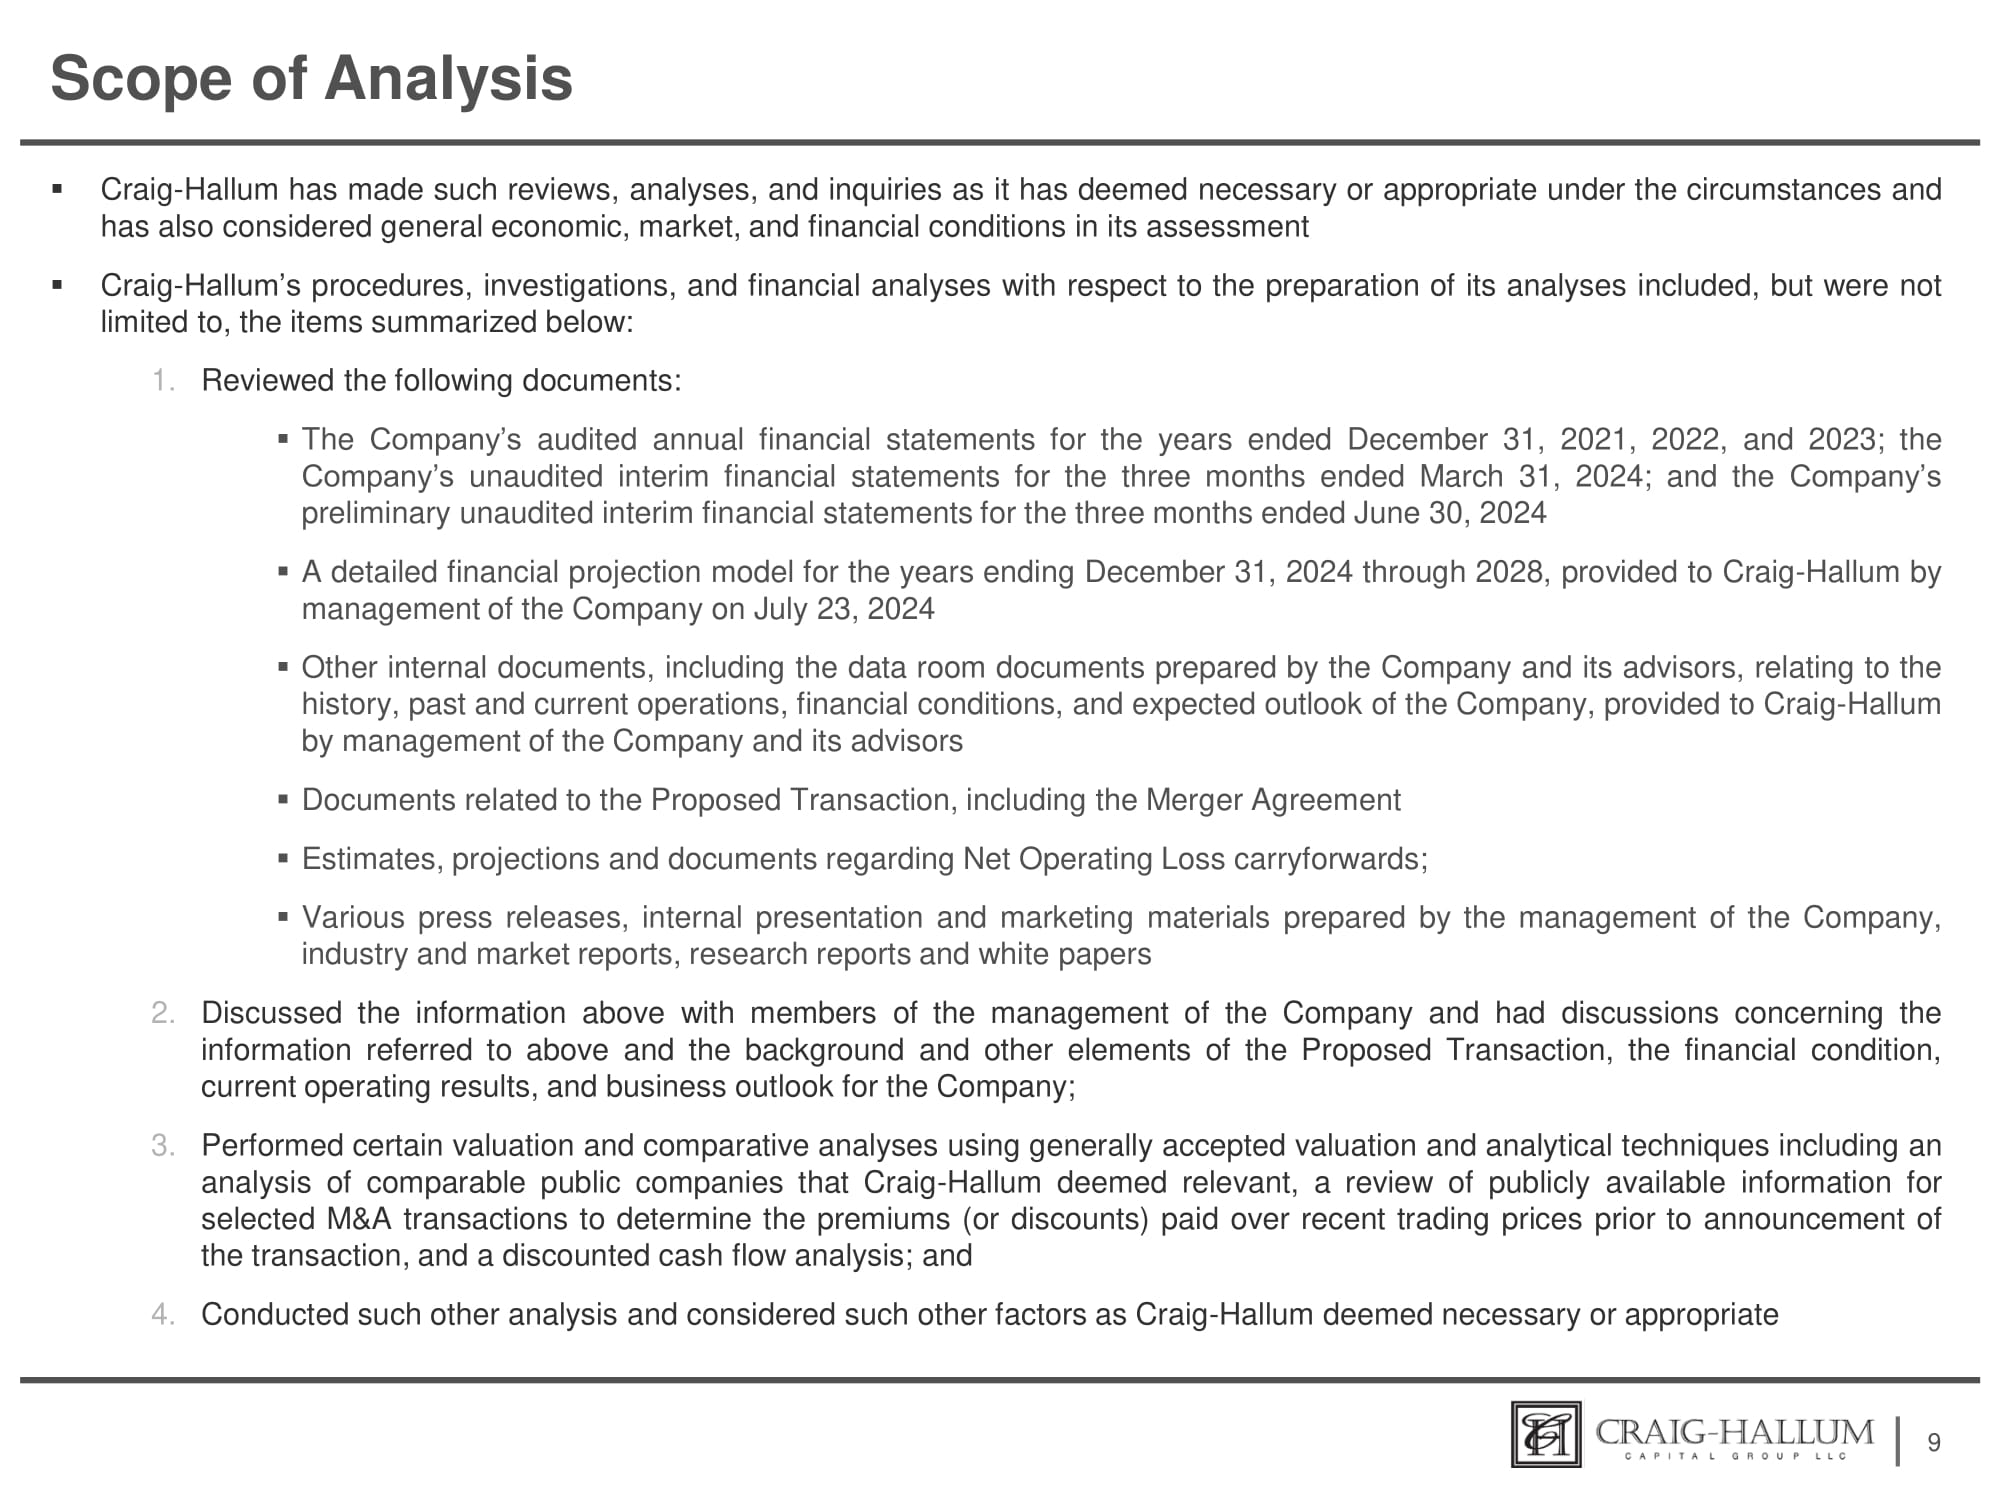
分析範圍 ▪ Craig - Hallum已進行了其認爲在相關情況下必要或適當的審查、分析和查詢,同時還考慮了一般經濟、市場和財務條件 ▪ Craig - Hallum關於準備其分析的程序、調查和財務分析包括但不限於下面總結的項目:1. 審查了以下文件:▪ 截至2021年12月31日、2022年、2023年的公司經過審計的年度財務報表;截至2024年3月31日的公司未經審計的季度財務報表;截至2024年6月30日的公司初步未經審計的季度財務報表 ▪ 公司管理層於2024年7月23日向Craig - Hallum提供的截至2024年12月31日至2028年的詳細財務預測模型 ▪ 公司及其顧問準備的數據室文件、涉及公司歷史、過去和當前業務運作、財務狀況和預期前景的其他內部文件,由公司管理層及其顧問提供給Craig - Hallum ▪ 與擬議交易相關的文件,包括併購協議 ▪ 關於淨經營虧損結轉額的估計、預測和文件;▪ 公司管理層、行業和市場報告、研究報告和白皮書準備的各種新聞稿、內部演示和營銷材料等文件資料 2. 與公司管理層成員討論上述信息,並就上述信息以及擬議交易的背景和其他要素、公司的財務狀況、當前運營結果和業務前景進行討論;3. 使用普遍接受的估值和分析技術進行一定的估值和比較分析,包括Craig - Hallum認爲相關的可比公開公司分析,審查選定的M&A交易的公開信息,以確定該交易公告前最近交易價格的溢價(或折扣)支付情況,並進行折現現金流分析;4. 進行其他分析和考慮Craig - Hallum認爲必要或適當的其他因素
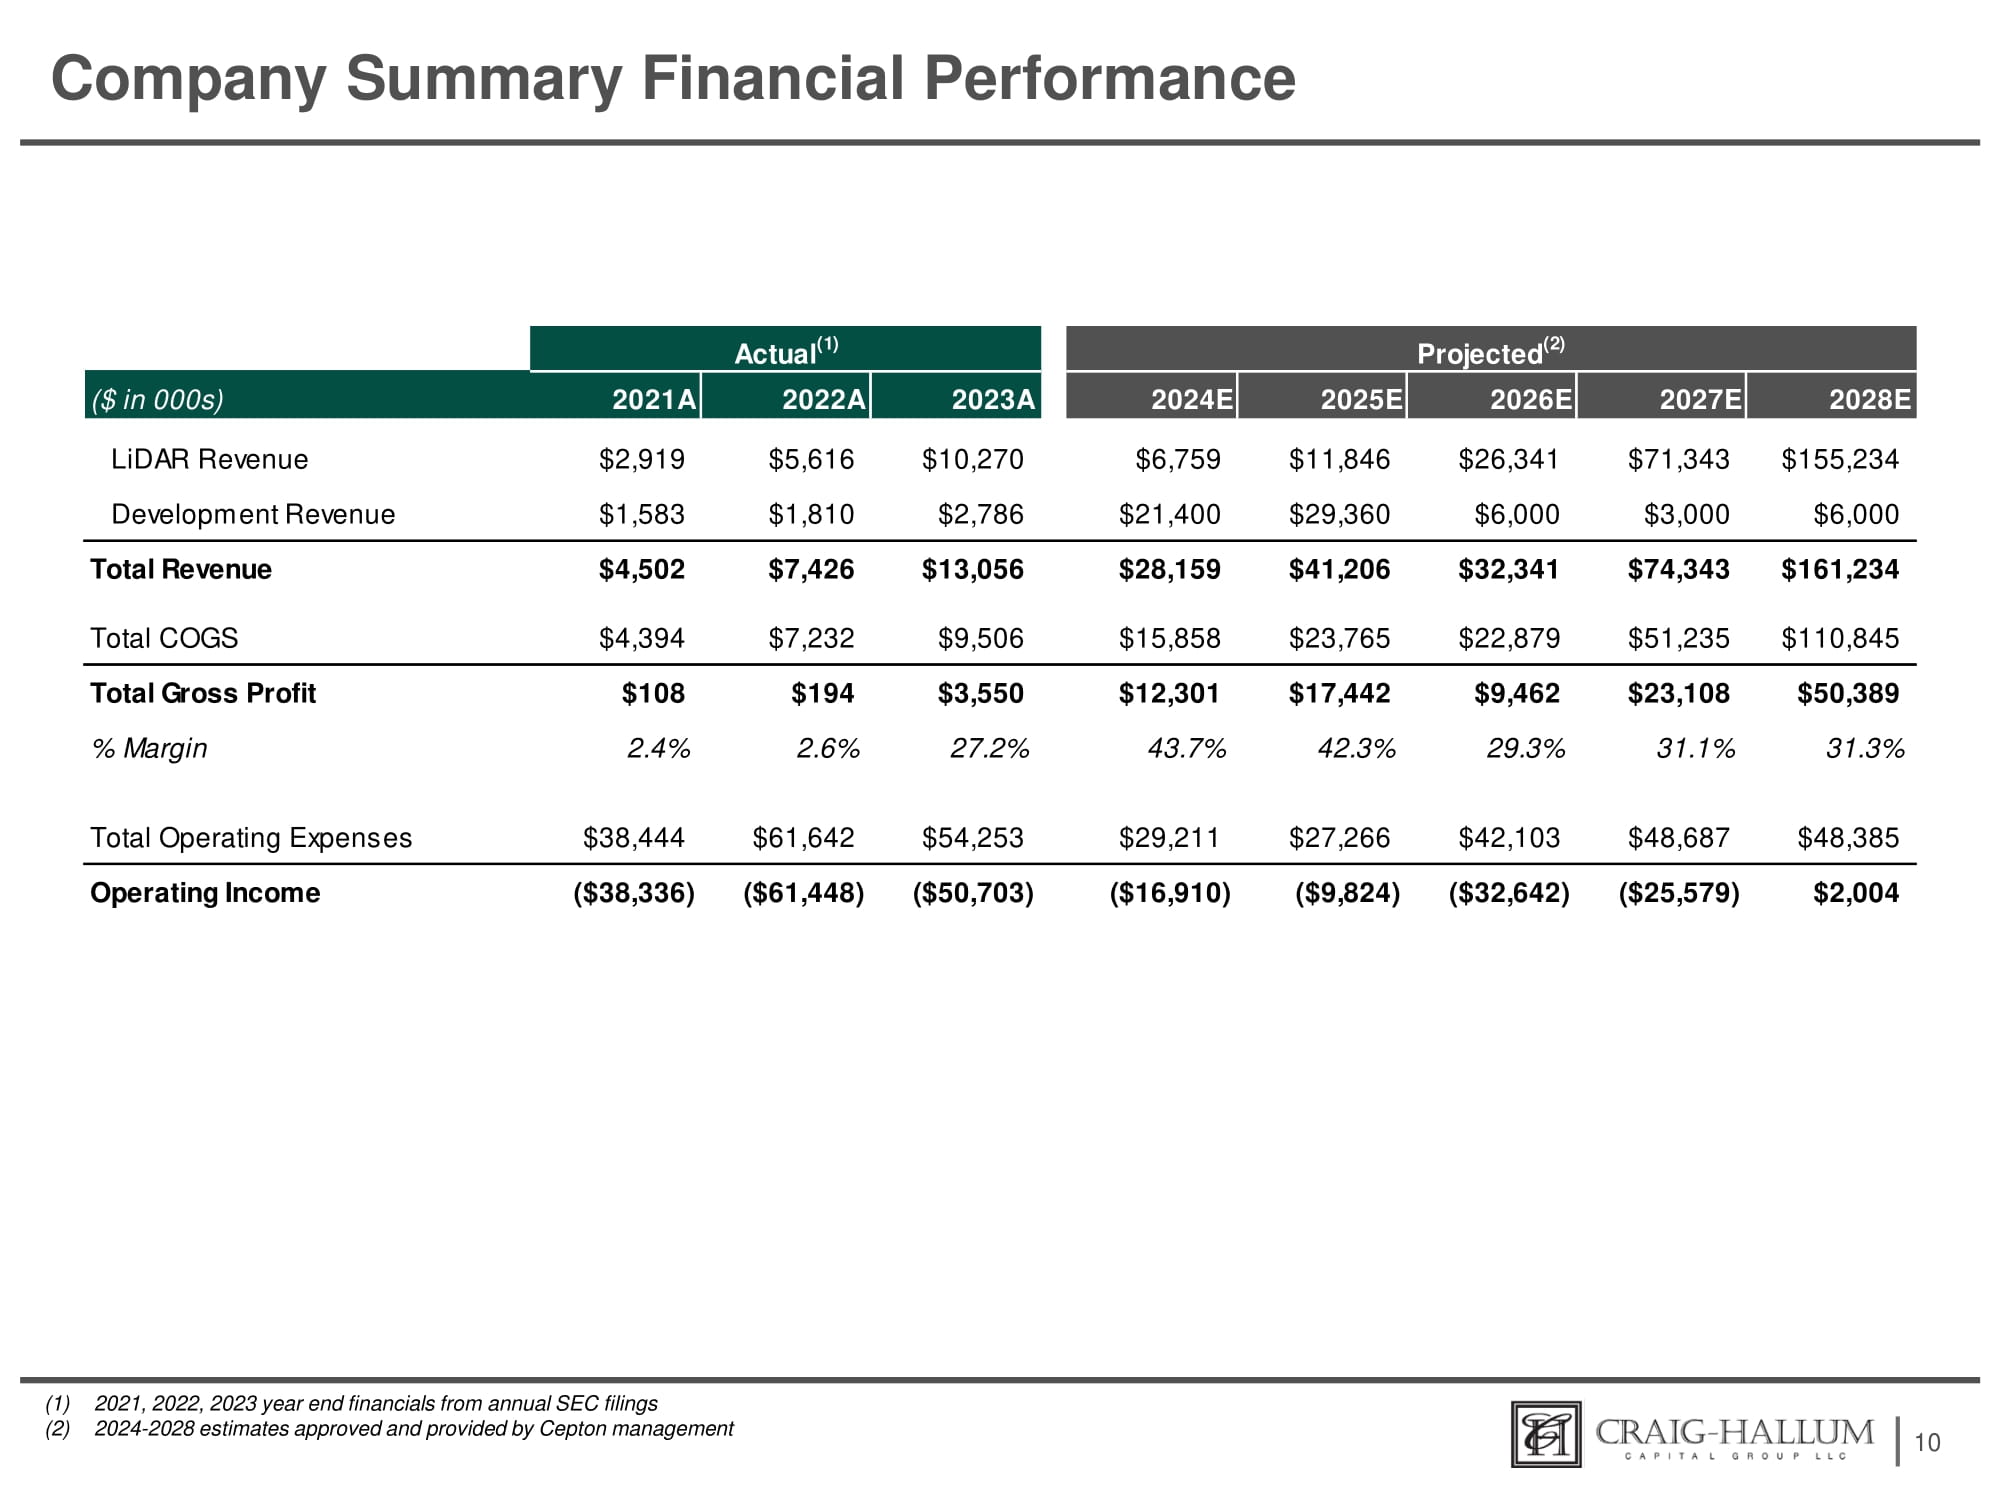
公司概況財務表現10 (1) 2021年、2022年、2023年年末財務報告來自年度SEC備案 (2) 2024年至2028年的估算已獲Cepton管理層批准並提供 實際 (1) 預測 (2)(單位:千美元) 2021A 2022A 2023A 2024E 2025E 2026E 2027E 2028E 激光雷達營業收入發展收入 $2,919 $1,583 $5,616 $1,810 $10,270 $2,786 $6,759 $21,400 $11,846 $29,360 $26,341 $6,000 $71,343 $3,000 $155,234 $6,000 總營業收入 $4,502 $7,426 $13,056 $28,159 $41,206 $32,341 $74,343 $161,234 總成本費用 $4,394 $7,232 $9,506 $15,858 $23,765 $22,879 $51,235 $110,845 總毛利潤 % 毛利率 $108 2.4% $194 2.6% $3,550 27.2% $12,301 43.7% $17,442 42.3% $9,462 29.3% $23,108 31.1% $50,389 31.3% 總營業費用 $38,444 $61,642 $54,253 $29,211 $27,266 $42,103 $48,687 $48,385 營業利潤 ($38,336) ($61,448) ($50,703) ($16,910) ($9,824) ($32,642) ($25,579) $2,004
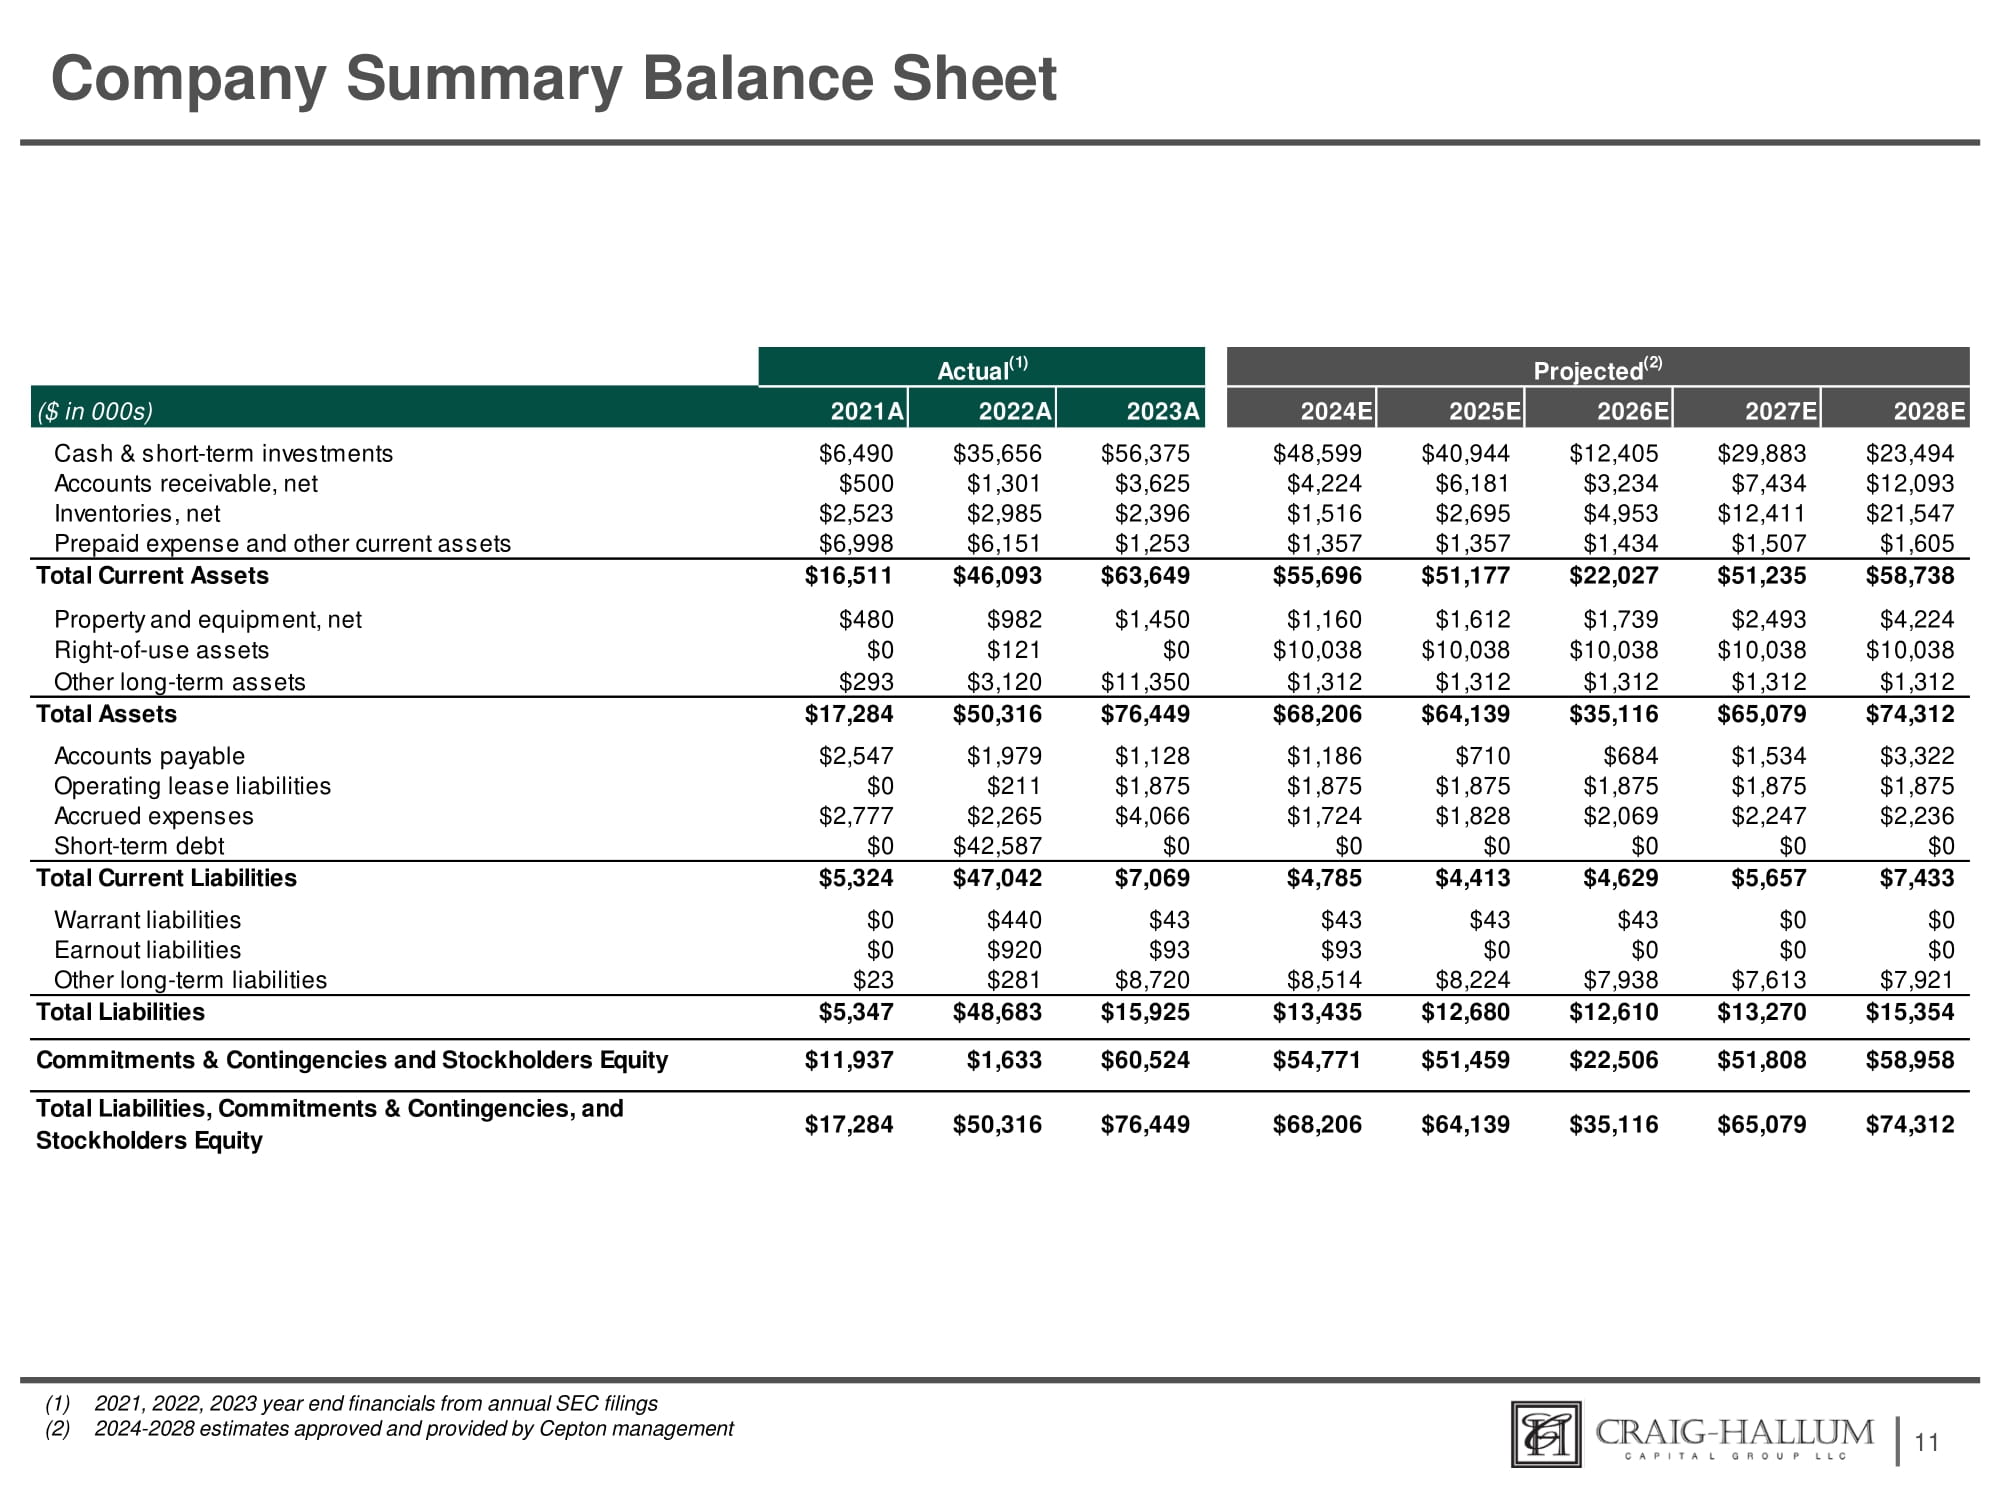
公司概要資產負債表 11 (1) 2021年、2022年、2023年年末來自年度SEC備案的財務數據 (2) 2024年 - 2028年由Cepton管理層批准並提供的預估數據 實際 (1) 預測 (2) (以千美元計) 2021A 2022A 2023A 2024E 2025E 2026E 2027E 2028E 現金及短期投資應收賬款,淨存貨,淨預付款及其他流動資產 $6,490 $500 $2,523 $6,998 $35,656 $1,301 $2,985 $6,151 $56,375 $3,625 $2,396 $1,253 $48,599 $4,224 $1,516 $1,357 $40,944 $6,181 $2,695 $1,357 $12,405 $3,234 $4,953 $1,434 $29,883 $7,434 $12,411 $1,507 $23,494 $12,093 $21,547 $1,605 總流動資產固定資產,淨租賃資產 其他長期資產 $16,511 $480 $0 $293 $46,093 $982 $121 $3,120 $63,649 $1,450 $0 $11,350 $55,696 $1,160 $10,038 $1,312 $51,177 $1,612 $10,038 $1,312 $22,027 $1,739 $10,038 $1,312 $51,235 $2,493 $10,038 $1,312 $58,738 $4,224 $10,038 $1,312 總資產應付賬款 運營租賃負債 應計費用 短期債務 $17,284 $2,547 $0 $2,777 $0 $50,316 $1,979 $211 $2,265 $42,587 $76,449 $1,128 $1,875 $4,066 $0 $68,206 $1,186 $1,875 $1,724 $0 $64,139 $710 $1,875 $1,828 $0 $35,116 $684 $1,875 $2,069 $0 $65,079 $1,534 $1,875 $2,247 $0 $74,312 $3,322 $1,875 $2,236 $0 總流動負債權證負債 贖回權負債 其他長期負債 $5,324 $0 $0 $23 $47,042 $440 $920 $281 $7,069 $43 $93 $8,720 $4,785 $43 $93 $8,514 $4,413 $43 $0 $8,224 $4,629 $43 $0 $7,938 $5,657 $0 $0 $7,613 $7,433 $0 $0 $7,921 總負債 $5,347 $48,683 $15,925 $13,435 $12,680 $12,610 $13,270 $15,354 承諾和待處理事項及股東權益 $11,937 $1,633 $60,524 $54,771 $51,459 $22,506 $51,808 $58,958 總負債、承諾及股東權益 $74,312 $65,079 $35,116 $64,139 $68,206 $76,449 $50,316 處理事項和 $17,284
機密三 計值分析
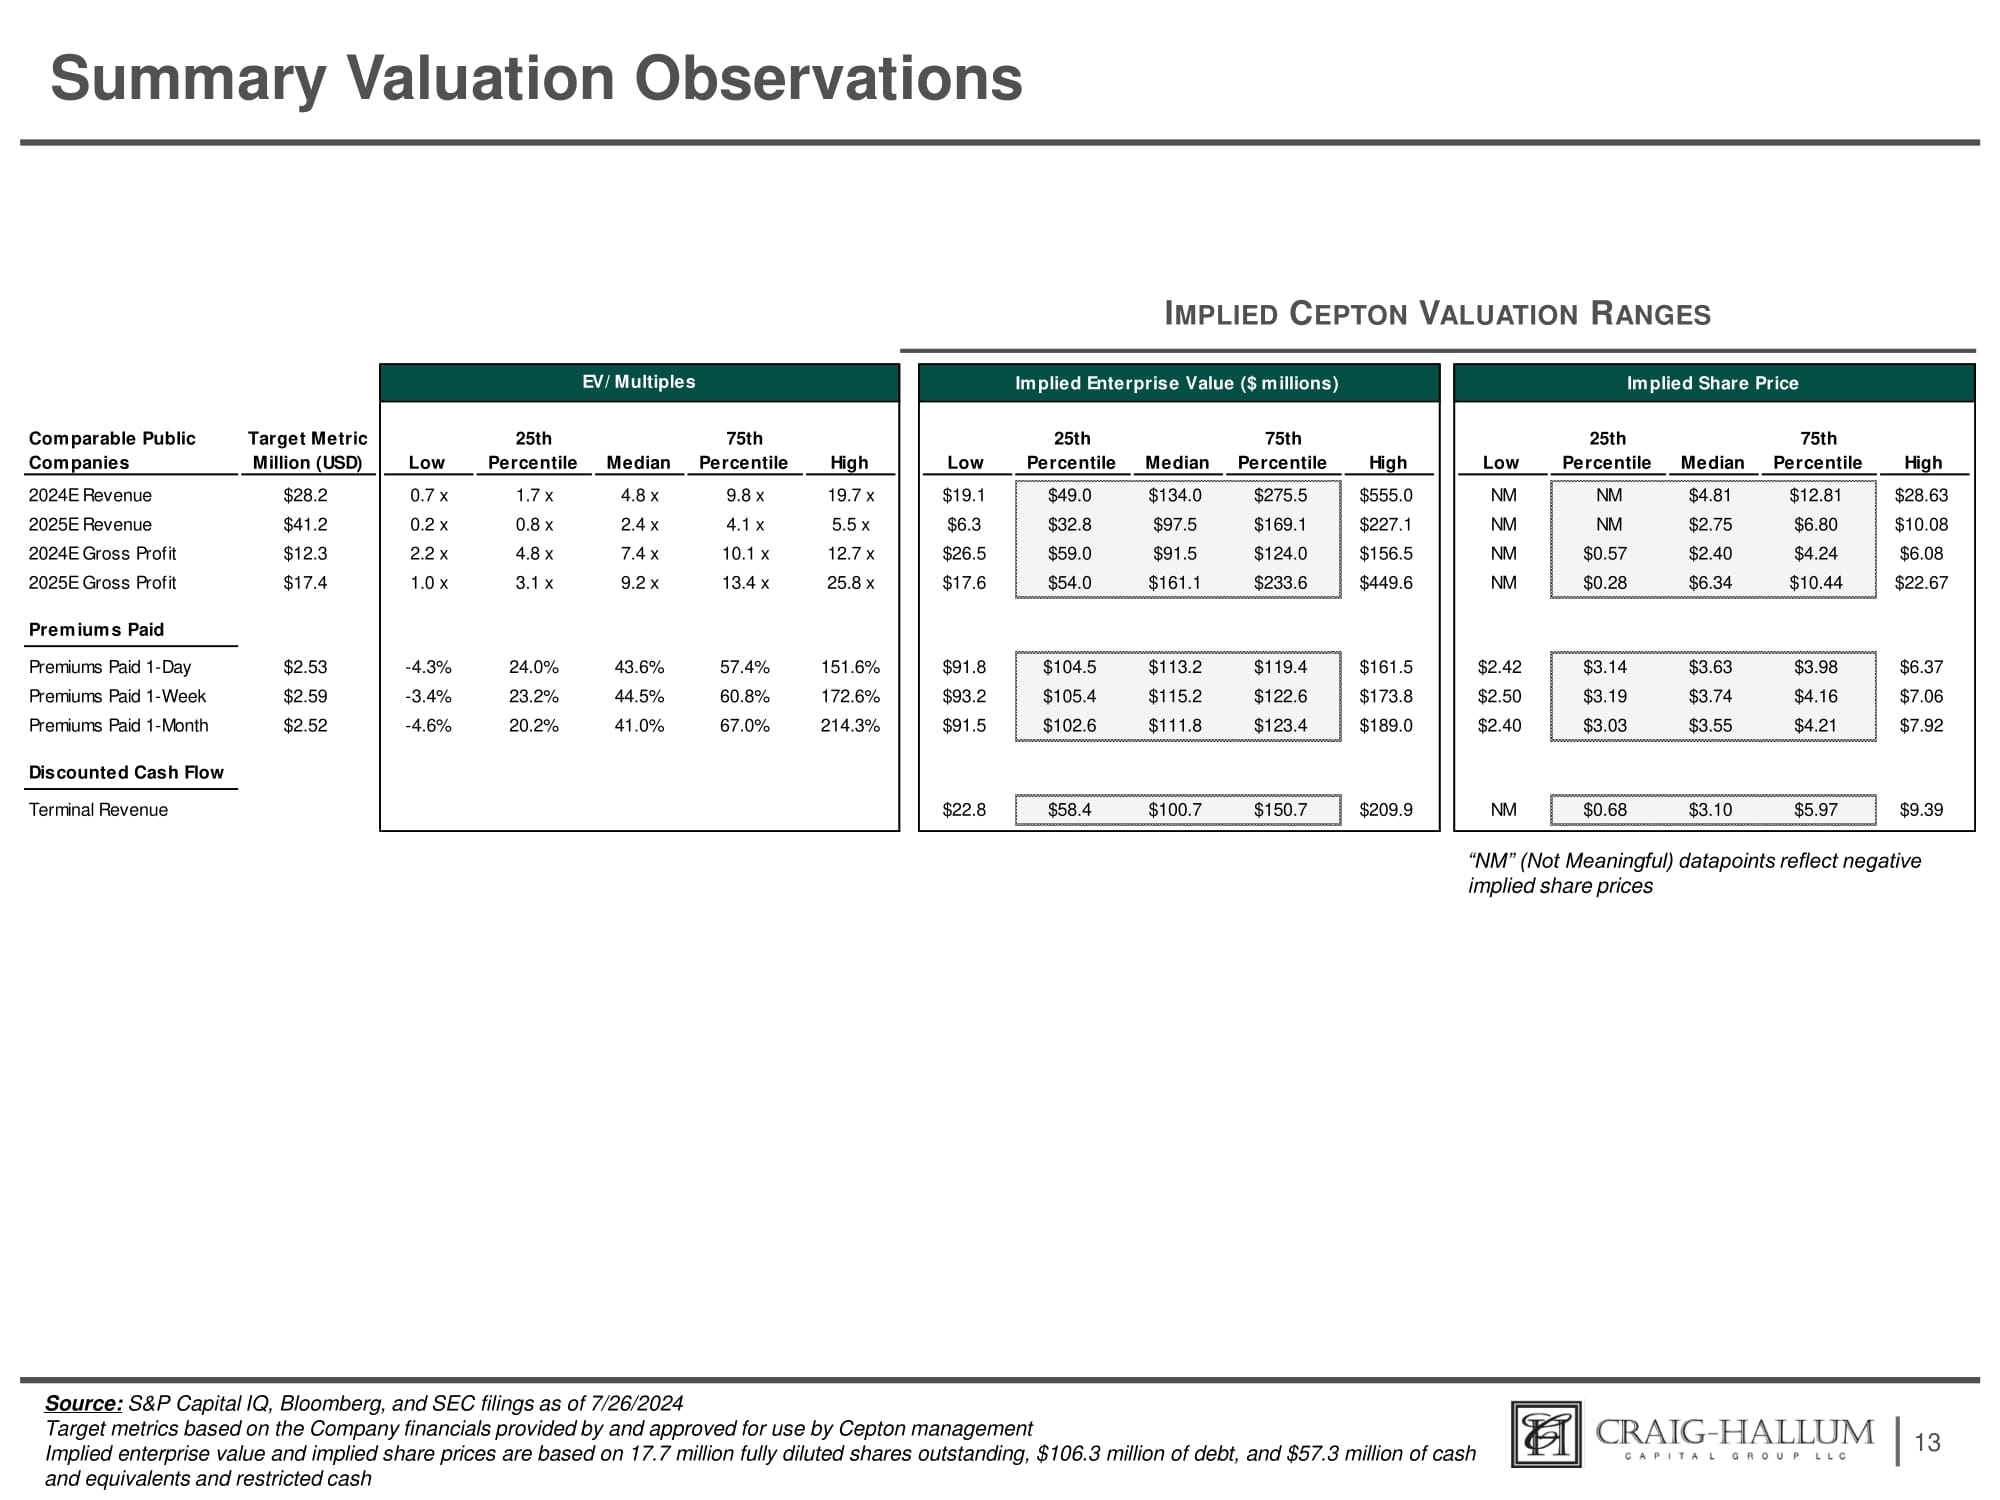
總結估值觀察 暗示Cepton估值範圍來源:標普資本智慧、彭博社和美國證監會報告截至2024年7月26日公司財務提供的目標指標,經Cepton管理層批准使用 暗示企業價值和暗示股價基於1770萬全攤薄股份、10630萬美元的債務和5730萬美元的現金及等值現金「NM」(無意義)數據點反映負暗示股價 暗示企業價值(百萬美元)第25位75位25th和75th中位數中位數前25%中位數最高 55.0美元 227.1美元 156.5美元 449.6美元 49.0美元 134.0美元 275.5美元 32.8美元 97.5美元 169.1美元 59.0美元 91.5美元 124.0美元 54.0美元 161.1美元 233.6美元 19.1美元 6.3美元 26.5美元 17.6美元 91.8美元 104.5美元 113.2美元 119.4美元 161.5美元 93.2美元 105.4美元 115.2美元 122.6美元 173.8美元 91.5美元 102.6美元 111.8美元 123.4美元 189.0美元 209.9美元 58.4美元 100.7美元 150.7美元 22.8美元 暗示股價最高 75th百分位數中位數第25%前百分之25最低 28.63美元 12.81美元 4.81美元 Nm Nm 10.08美元 6.80美元 2.75美元 Nm Nm 6.08美元 4.24美元 2.40美元 0.57美元 Nm 22.67美元 10.44美元 6.34美元 0.28美元 Nm 6.37美元 7.06美元 7.92美元 3.98美元 4.16美元 4.21美元 3.63美元 3.74美元 3.55美元 3.14美元 3.19美元 3.03美元 2.42美元 2.50美元 2.40美元 9.39美元 5.97美元 3.10美元 0.68美元 Nm 可比上市公司目標指標百萬美元25th75th低百分位數中位數百分位數最高 2024年營業收入2025年營業收入2024年毛利潤2025年毛利潤 28.2美元 41.2美元 12.3美元 17.4美元 0.7倍 0.2倍 2.2倍 1.0倍 1.7倍 0.8倍 4.8倍 3.1倍 4.8倍 2.4倍 7.4倍 9.2倍 9.8倍 4.1倍 10.1倍 13.4倍 19.7倍 5.5倍 12.7倍 25.8倍 溢價支付支付的溢價支付1天內支付的溢價支付1周支付的溢價支付1個月 2.53美元 2.59美元 2.52美元 -4.3% -3.4% -4.6% 24.0% 43.6% 57.4% 151.6% 23.2% 44.5% 60.8% 172.6% 20.2% 41.0% 67.0% 214.3% 貼現現金流終端收入EV/倍數
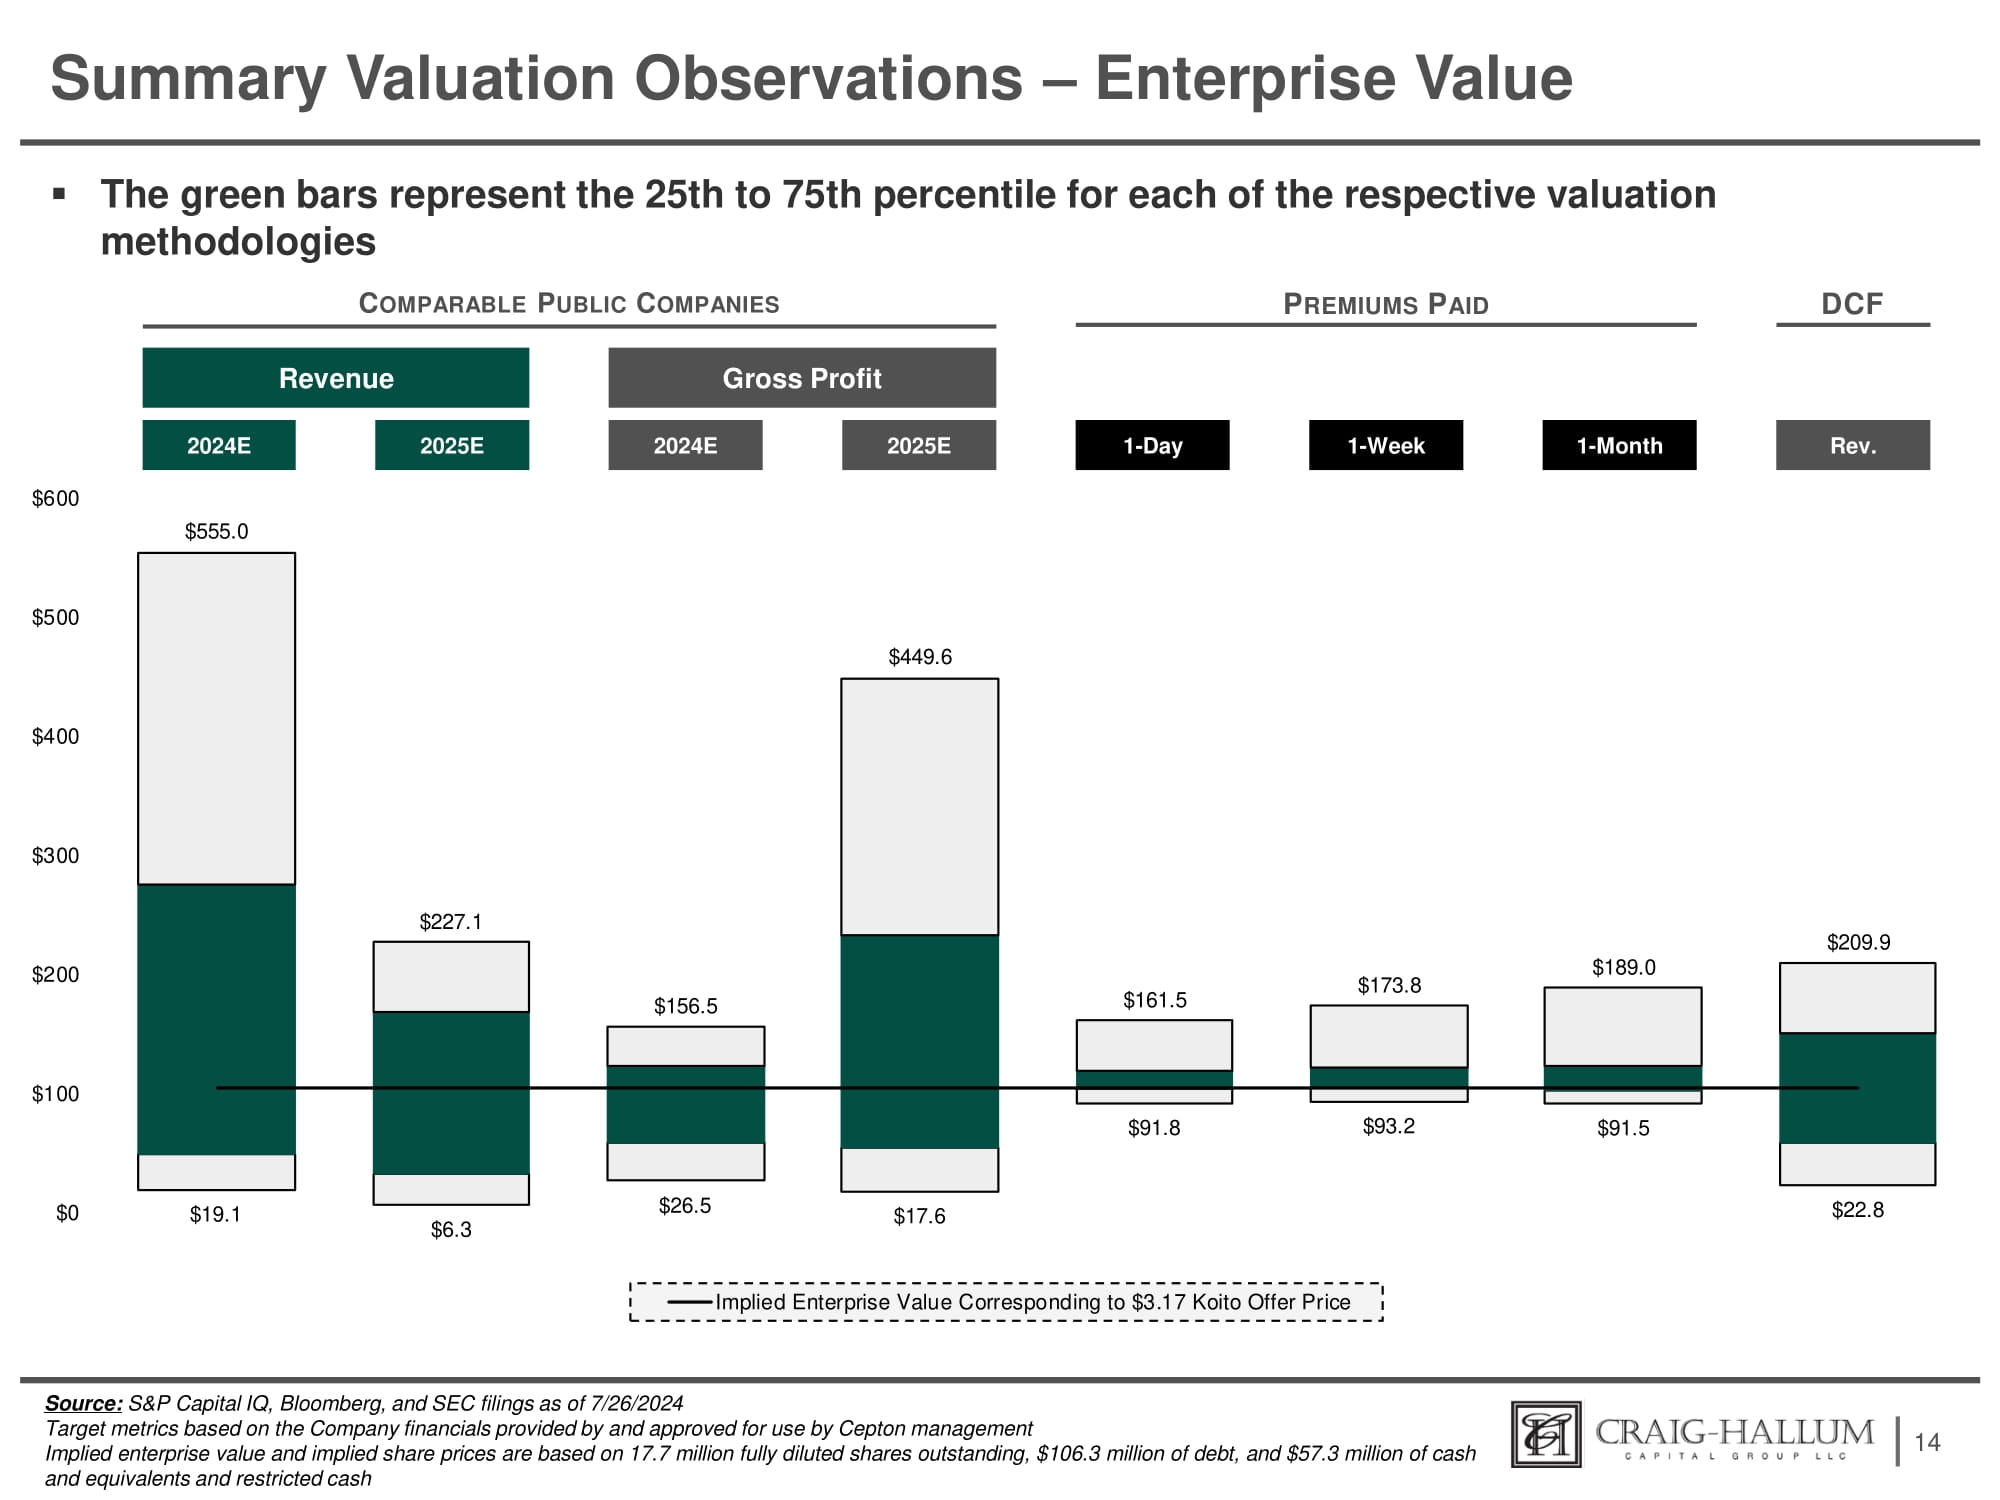
總估值觀察-企業價值▪ 綠色條表示各自估值方法的25th至75th百分位數 C OMPARABLE P UBLIC C OMPANIES P REMIUMS P AID 14 營業收入 2024E 2025E 毛利潤 2024E 2025E DCF Rev. 1 - Day 1 - Month 1 - Week 資料來源:S&P Capital IQ, 彭博社和SEC申報截至2024年7月26日 根據Cepton管理層提供並批准使用的公司財務數據,推導的企業價值和隱含股價基於1770萬全攤薄股、10630萬美元的債務以及5730萬美元的現金及等價物和受限現金 19.1 6.3 26.5 17.6 91.8 93.2 91.5 22.8 227.1 156.5 449.6 161.5 173.8 189.0 209.9 600 555.0 500 0 100 200 300 400 與3.17元小糸株式收購價對應的隱含企業價值
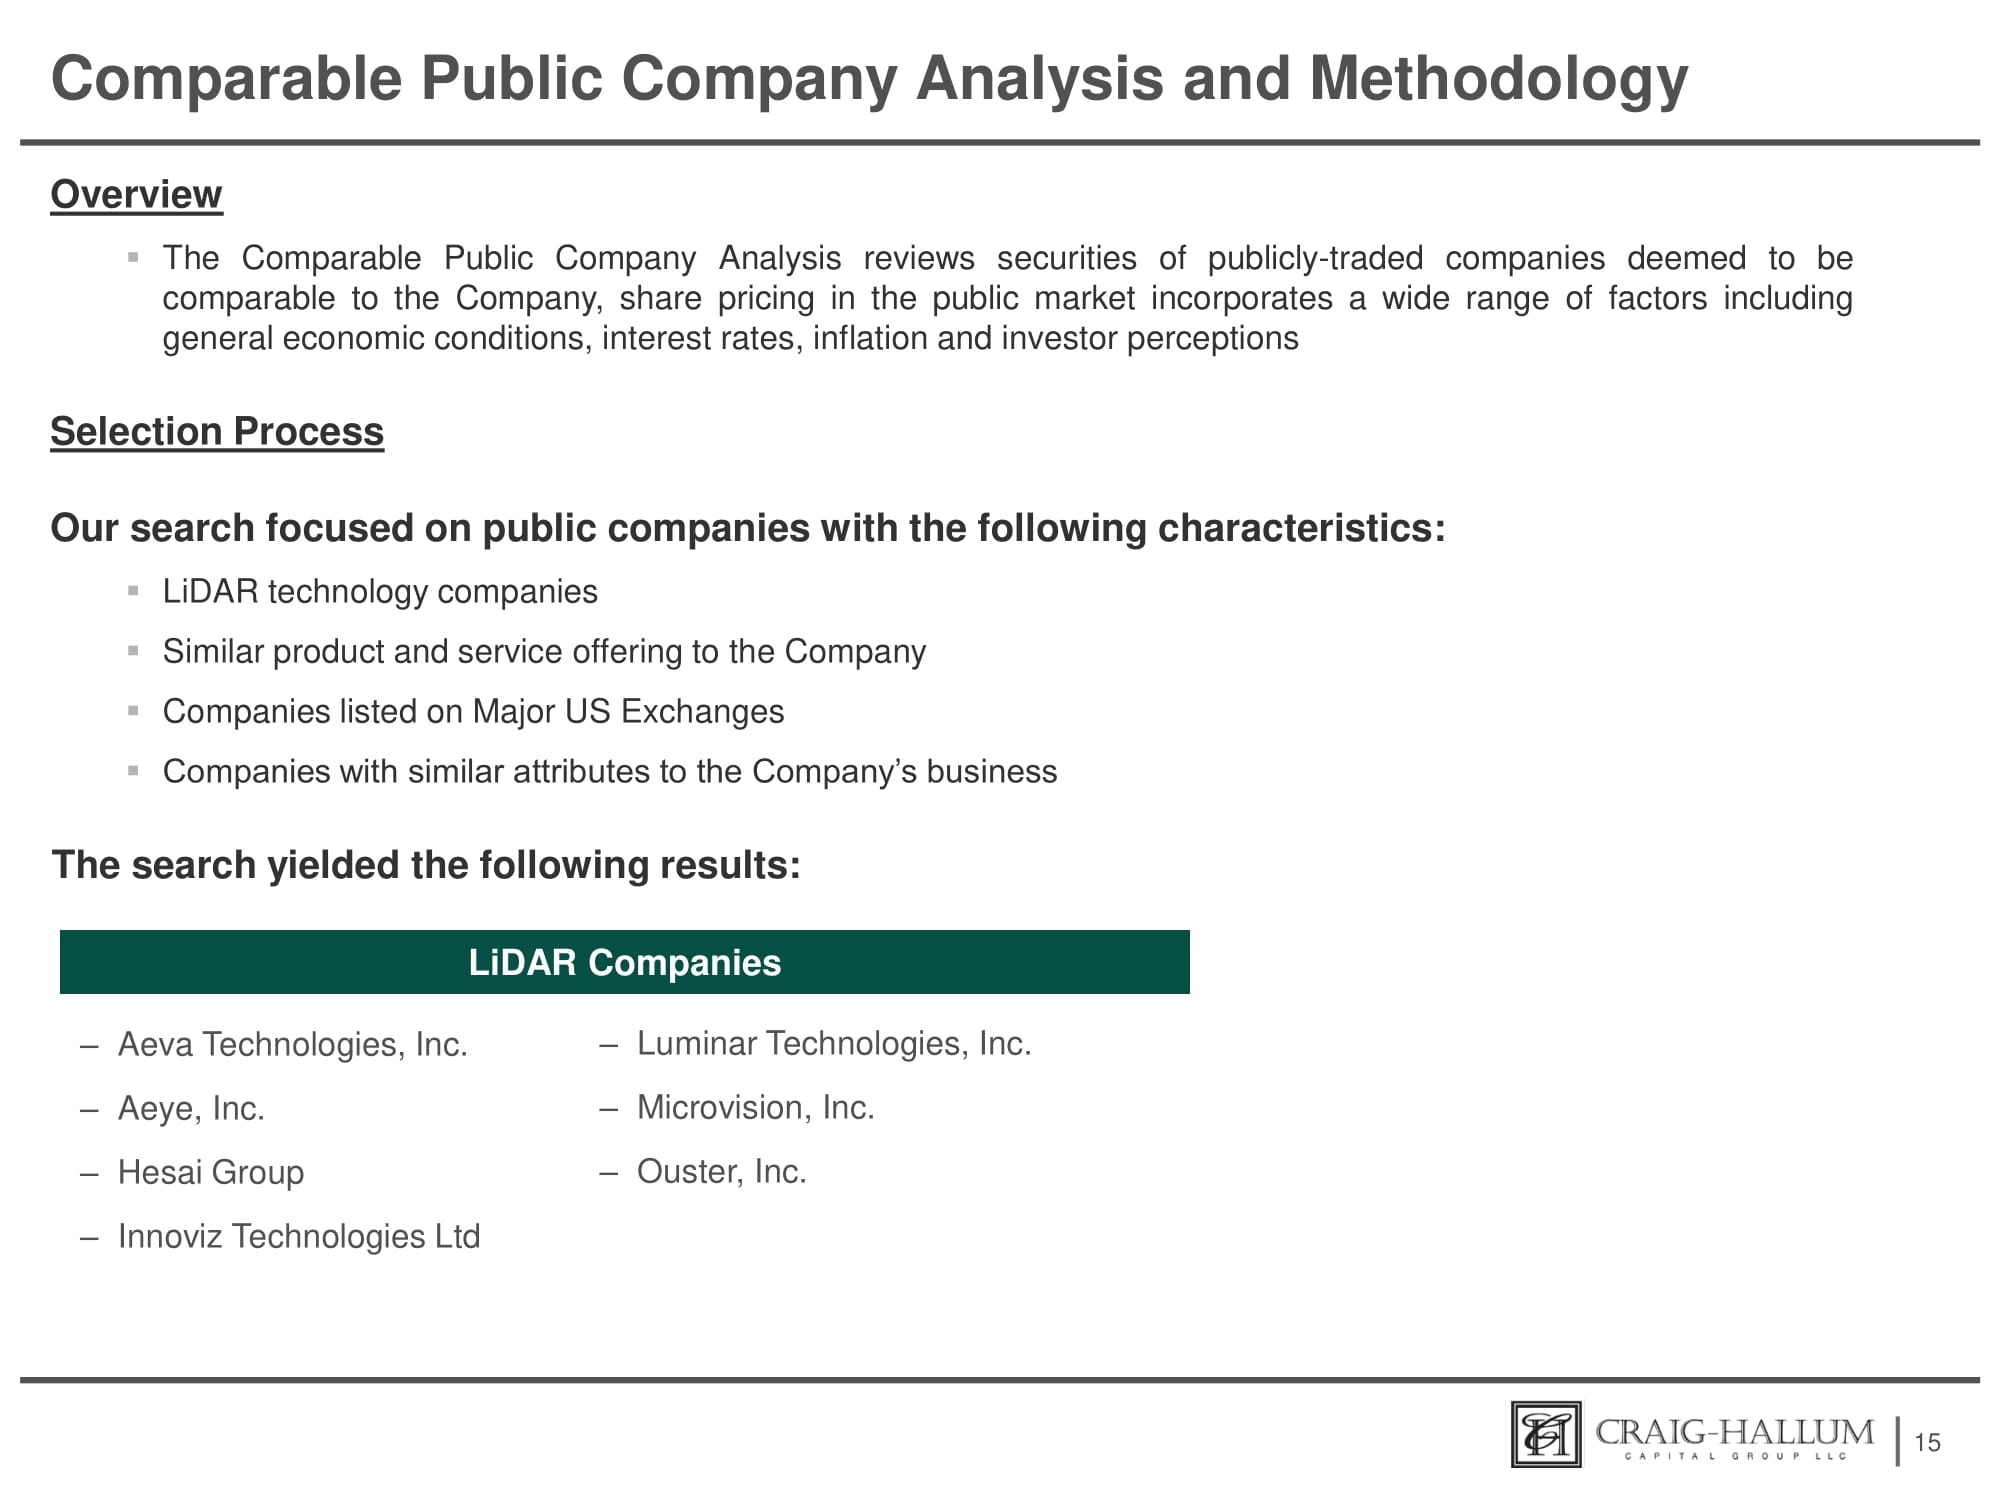
可比公司分析及方法概述 ▪ 可比公司分析審查被視爲與公司可比的上市公司證券,公開市場的股價涵蓋包括一系列因素,如普遍經濟狀況、利率期貨、通貨膨脹和投資者看法 選擇過程 我們的搜索重點放在具有以下特點的上市公司:▪ 激光雷達概念公司 ▪ 與公司具有類似產品和服務的公司 ▪ 在主要美國交易所上市的公司 ▪ 具有與公司業務相似屬性的公司 搜索結果如下:15 - Aeva Technologies, Inc. - Aeye, Inc. - Hesai Group - Innoviz Technologies Ltd - Luminar Technologies, Inc. - Microvision, Inc. - Ouster, Inc. 激光雷達公司
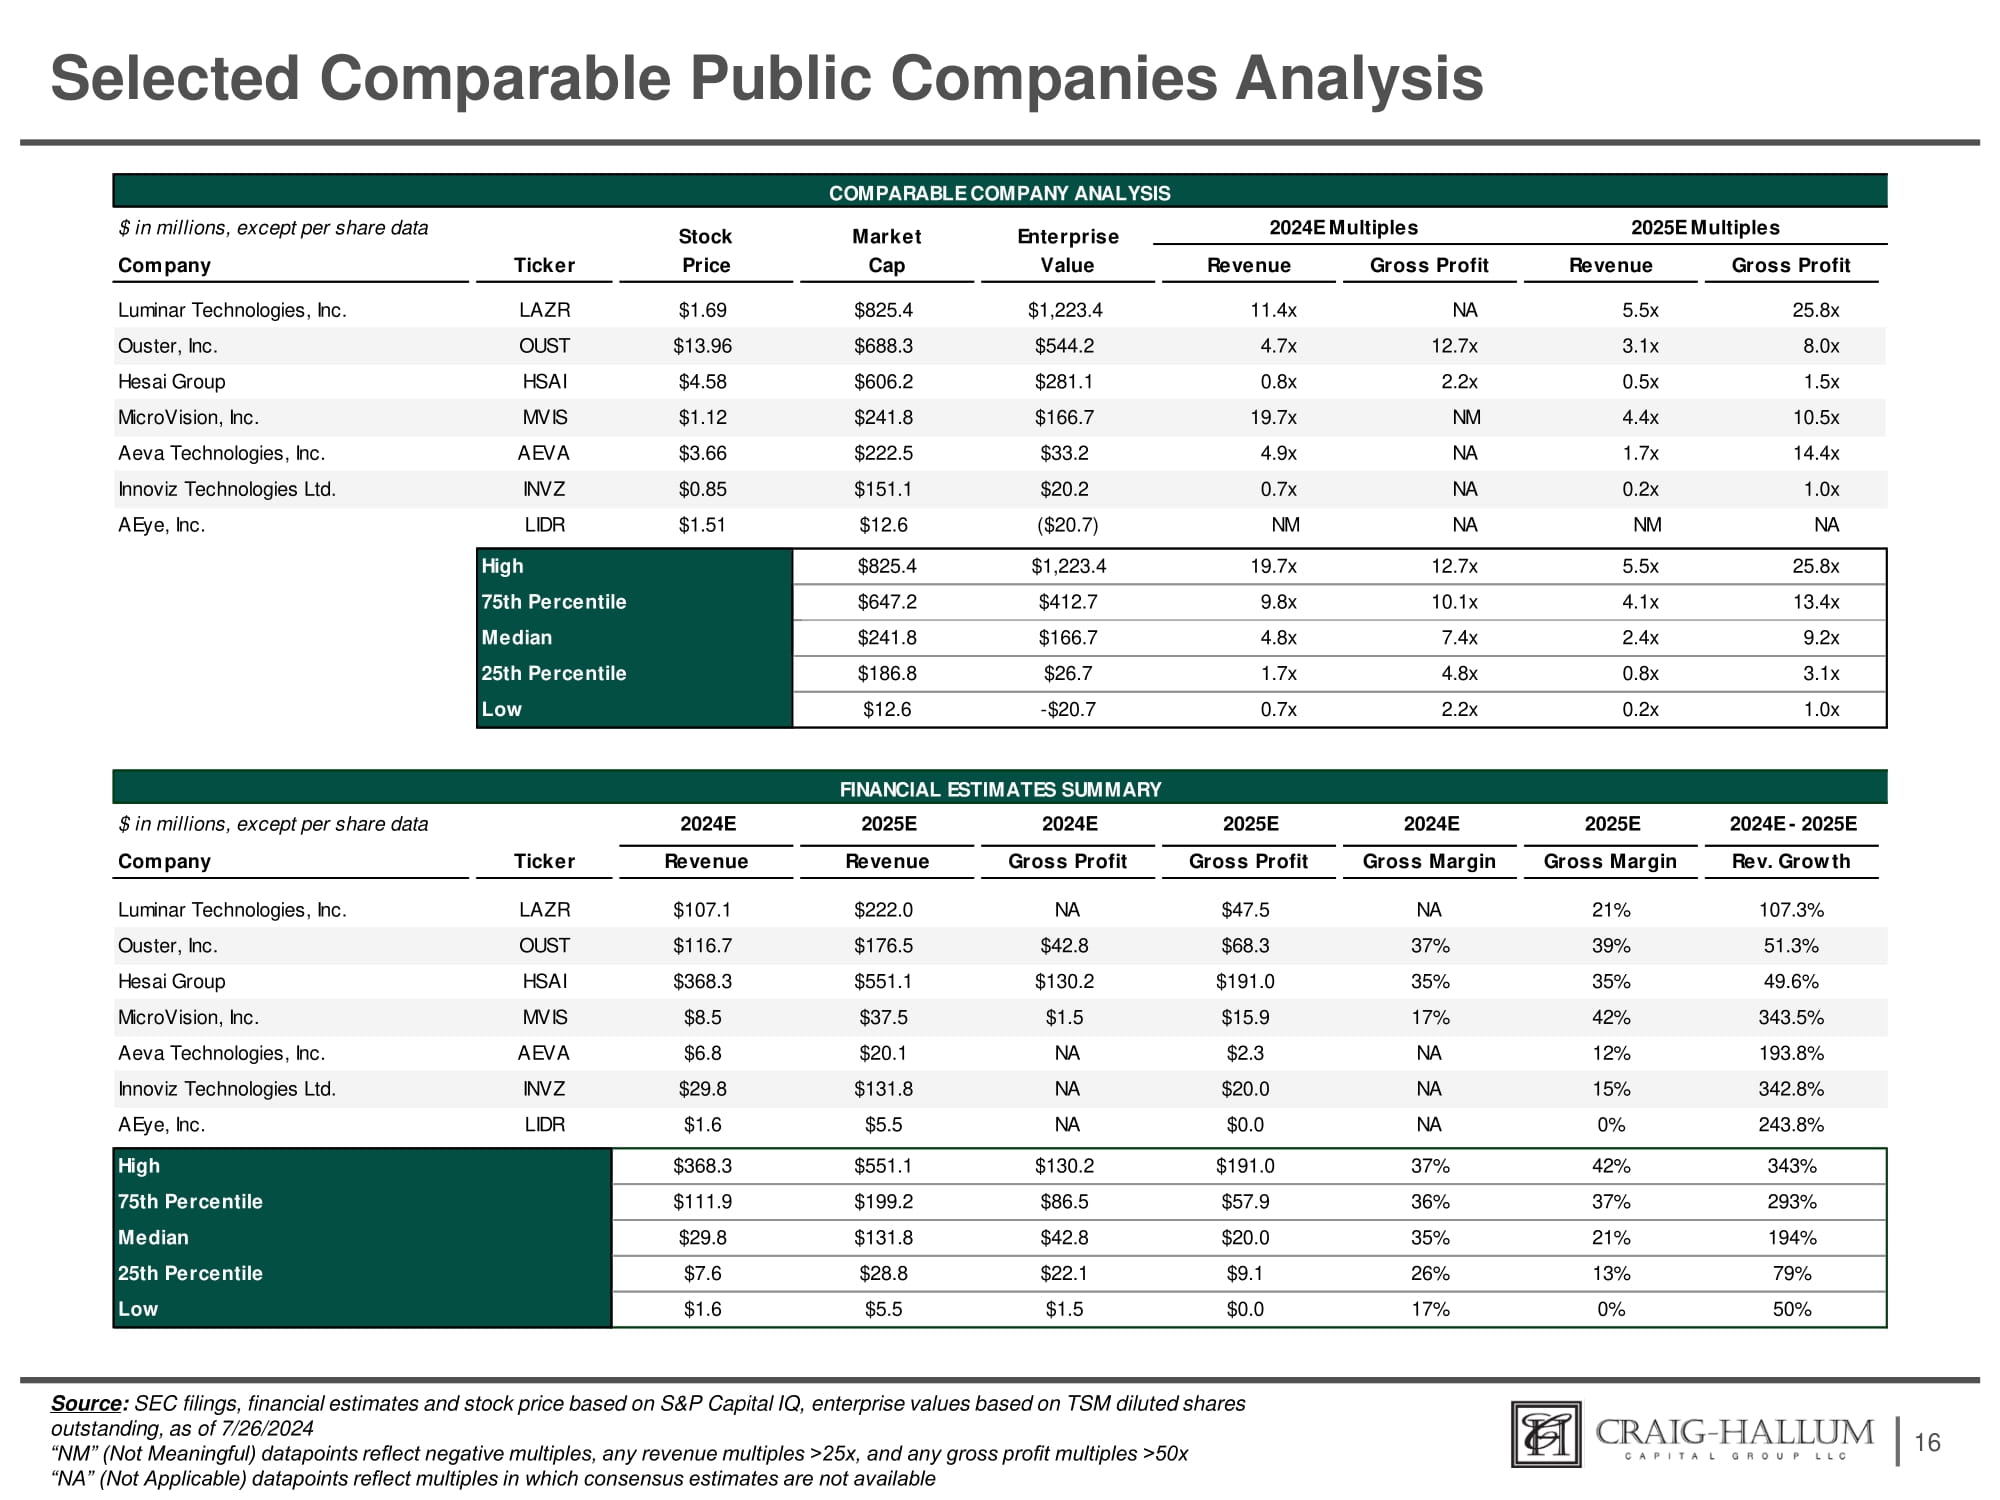
選定的可比公司分析 16來源:SEC備案、財務預測和S&P Capital IQ的股價,基於TSm攤薄流通股數,截至2024年7月26日。「NM」(無意義)數據點反映負面倍數,任何營業收入倍數>25倍,任何毛利潤倍數>50倍。「NA」(不適用)數據點反映一致預測不可用 25.8倍 5.5倍 12.7倍 19.7倍 $1,223.4 $825.4 最高 13.4倍 4.1倍 10.1倍 9.8倍 $412.7 $647.2 第75百分位數 9.2倍 2.4倍 7.4倍 4.8倍 $166.7 $241.8 中位數 3.1倍 0.8倍 4.8倍 1.7倍 $26.7 $186.8 第25百分位數 1.0倍 0.2倍 2.2倍 0.7倍 - $20.7 $12.6 最低 2024E - 2025E 2025E 2024E 2025E 2024E 2025E 2024E 百萬美元,除每股數據外 Rev. Grow th 毛利率 毛利率 毛利潤 毛利潤 營業收入 營業收入 逐筆明細 公司 107.3% 21% NA $47.5 NA $222.0 $107.1 LAZR Luminar Technologies, Inc. 51.3% 39% 37% $68.3 $42.8 $176.5 $116.7 OUSt Ouster, Inc. 49.6% 35% 35% $191.0 $130.2 $551.1 $368.3 HSAI Hesai Group 343.5% 42% 17% $15.9 $1.5 $37.5 $8.5 MVIS MicroVision, Inc. 193.8% 12% NA $2.3 NA $20.1 $6.8 AEVA Aeva Technologies, Inc. 342.8% 15% NA $20.0 NA $131.8 $29.8 INVZ Innoviz Technologies Ltd. 243.8% 0% NA $0.0 NA $5.5 $1.6 LIDR AEye, Inc. 343% 42% 37% $191.0 $130.2 $551.1 $368.3 最高 293% 37% 36% $57.9 $86.5 $199.2 $111.9 第75百分位數 194% 21% 35% $20.0 $42.8 $131.8 $29.8 中位數 79% 13% 26% $9.1 $22.1 $28.8 $7.6 第25百分位數 50% 0% 17% $0.0 $1.5 $5.5 $1.6 最低 百萬美元,除每股數據外 2024E 倍數 2025E 倍數 毛利率 營業收入 毛利率 營業收入 值 價格 逐筆明細 公司 25.8倍 5.5倍 NA 11.4倍 $1,223.4 $825.4 $1.69 LAZR Luminar Technologies, Inc. 8.0倍 3.1倍 12.7倍 4.7倍 $544.2 $688.3 $13.96 OUSt Ouster, Inc. 1.5倍 0.5倍 2.2倍 0.8倍 $281.1 $606.2 $4.58 HSAI Hesai Group 10.5倍 4.4倍 Nm 19.7倍 $166.7 $241.8 $1.12 MVIS MicroVision, Inc. 14.4倍 1.7倍 NA 4.9倍 $33.2 $222.5 $3.66 AEVA Aeva Technologies, Inc. 1.0倍 0.2倍 NA 0.7倍 $20.2 $151.1 $0.85 INVZ Innoviz Technologies Ltd. NA Nm NA Nm ($20.7) $12.6 $1.51 LIDR AEye, Inc. 財務預測摘要 股票 可比公司分析 市場 企業
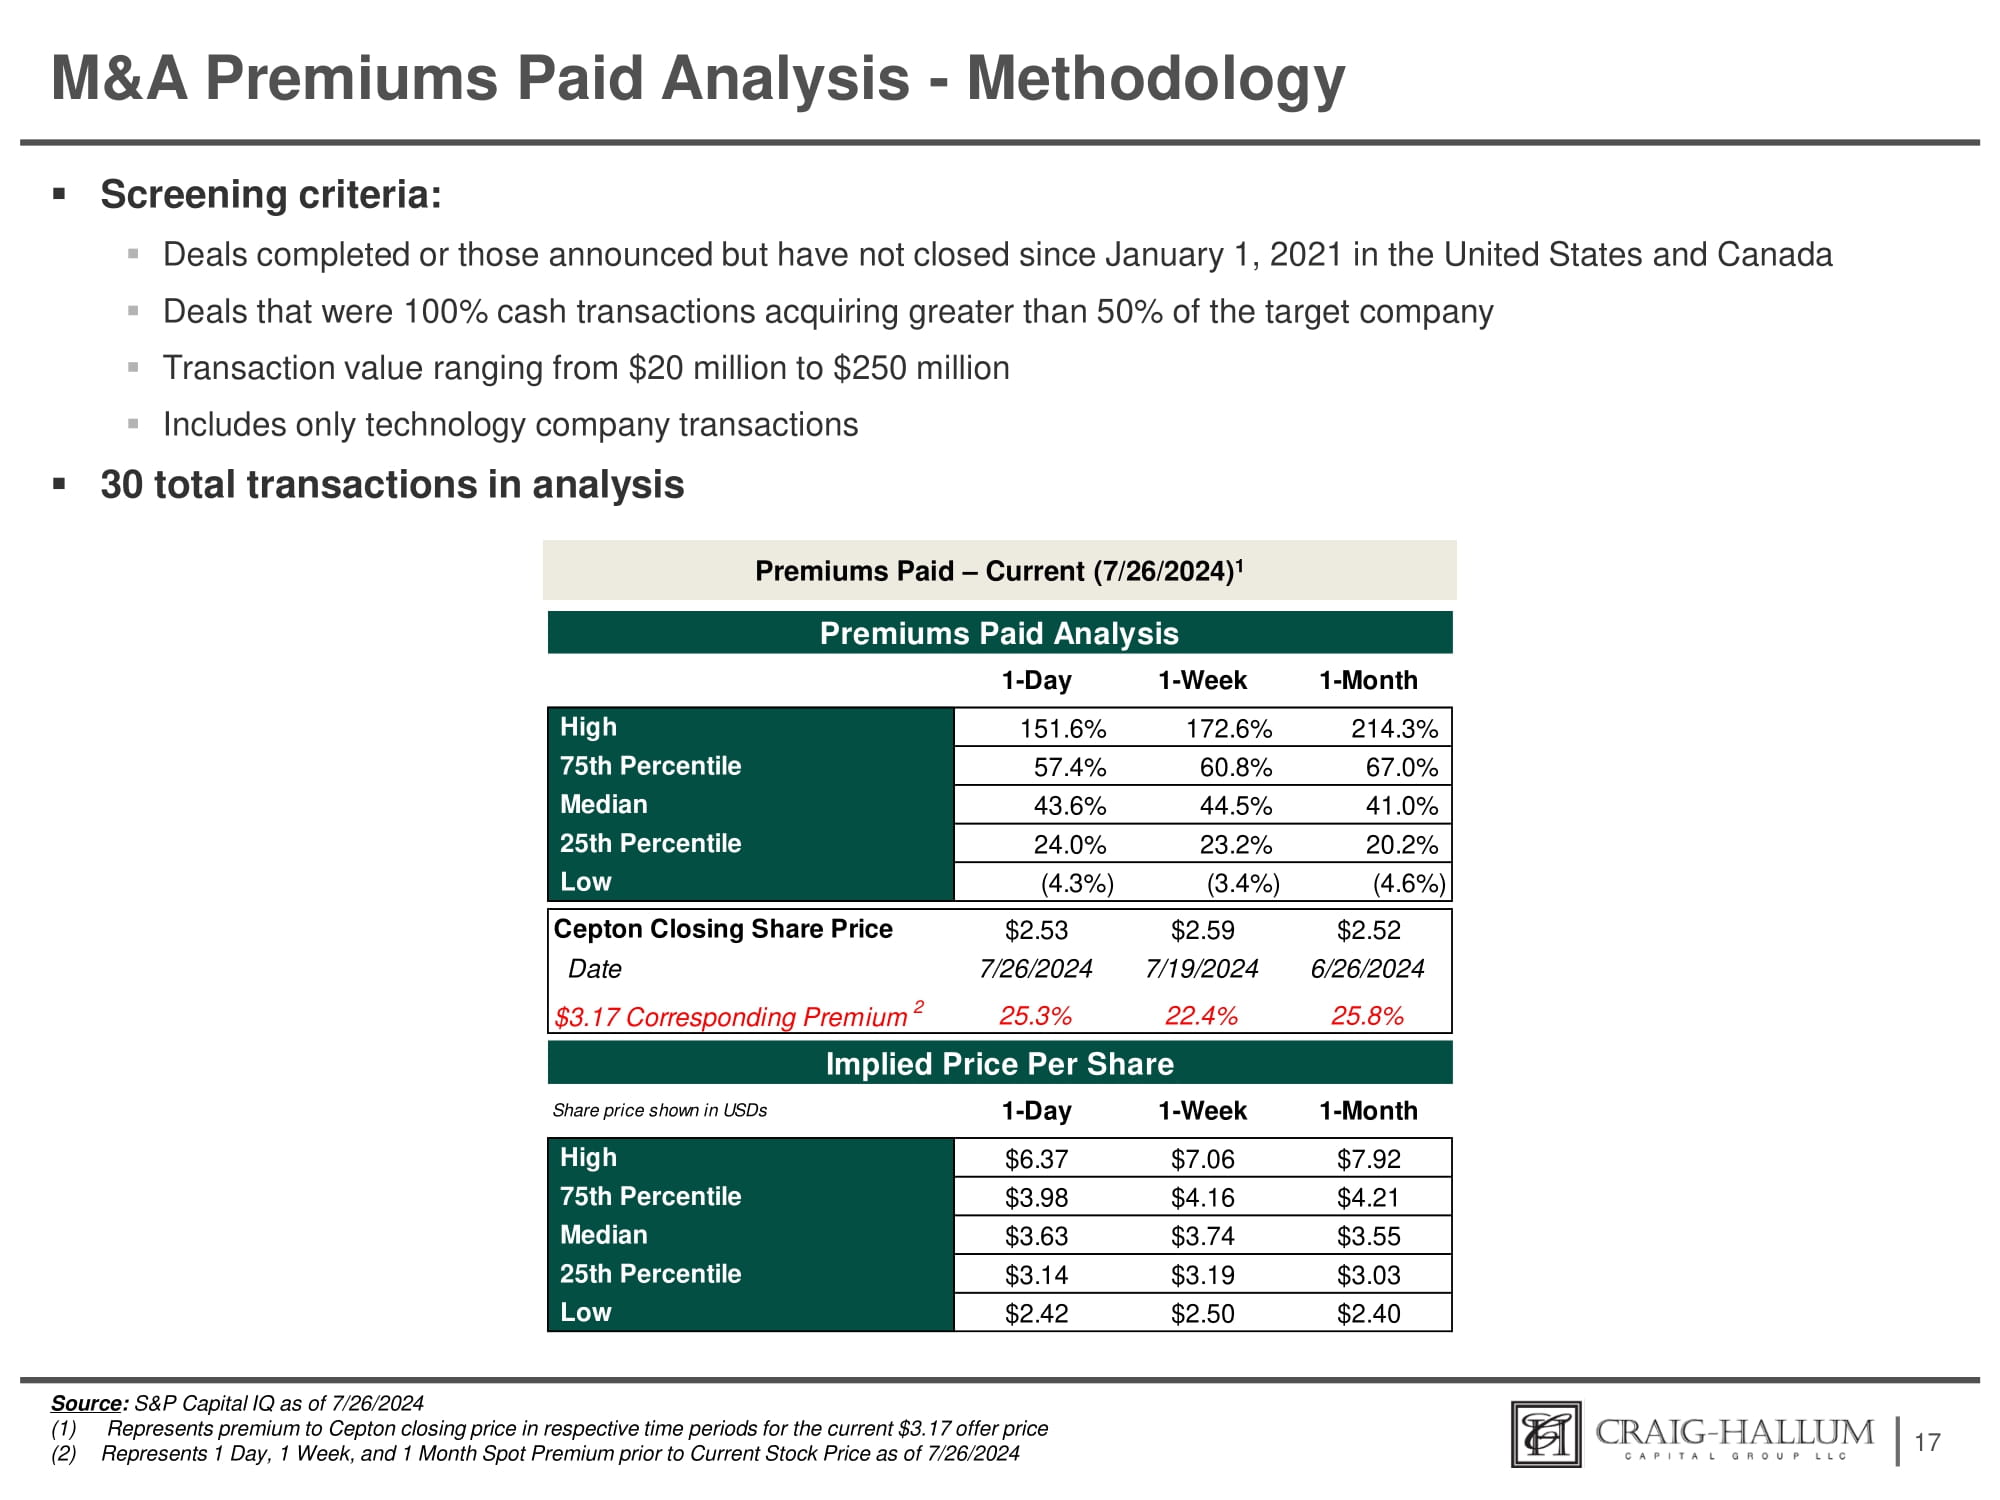
M&A 付費分析 - 方法論 ▪ 篩選標準: ▪ 已完成的交易或自2021年1月1日以來未結束但在美國和加拿大宣佈的交易 ▪ 100%現金交易,收購目標公司50%以上 ▪ 交易價值介於$20至$250百萬美元之間 ▪ 僅包括科技公司交易 ▪ 分析中共有30筆交易 17 資料來源: 標普資本智識(截至 2024年7月26日) (1) 表示與當前$3.17要約價格相比的 Cepton 結算價在各自時間段的溢價 (2) 表示前一日、前一週和前一月的要約溢價,截至 2024年7月26日 付費分析 - 當前(2024年7月26日) 1 214.3% 172.6% 151.6% 高 67.0% 60.8% 57.4% 第75百分位數 41.0% 44.5% 43.6% 中位數 20.2% 23.2% 24.0% 第25百分位數 (4.6%) (3.4%) (4.3%) 低 $2.52 2024年6月26日 $2.59 2024年7月19日 $2.53 2024年7月26日 Cepton 結算股價日期 25.8% 22.4% 25.3% $3.17 相應溢價 2 每股隱含價格 $7.92 $7.06 $6.37 高 $4.21 $4.16 $3.98 第75百分位數 $3.55 $3.74 $3.63 中位數 $3.03 $3.19 $3.14 第25百分位數 $2.40 $2.50 $2.42 低 付費分析 1 - 天 1 - 周 1 - 月 股價以美元顯示 1 - 天 1 - 周 1 - 月
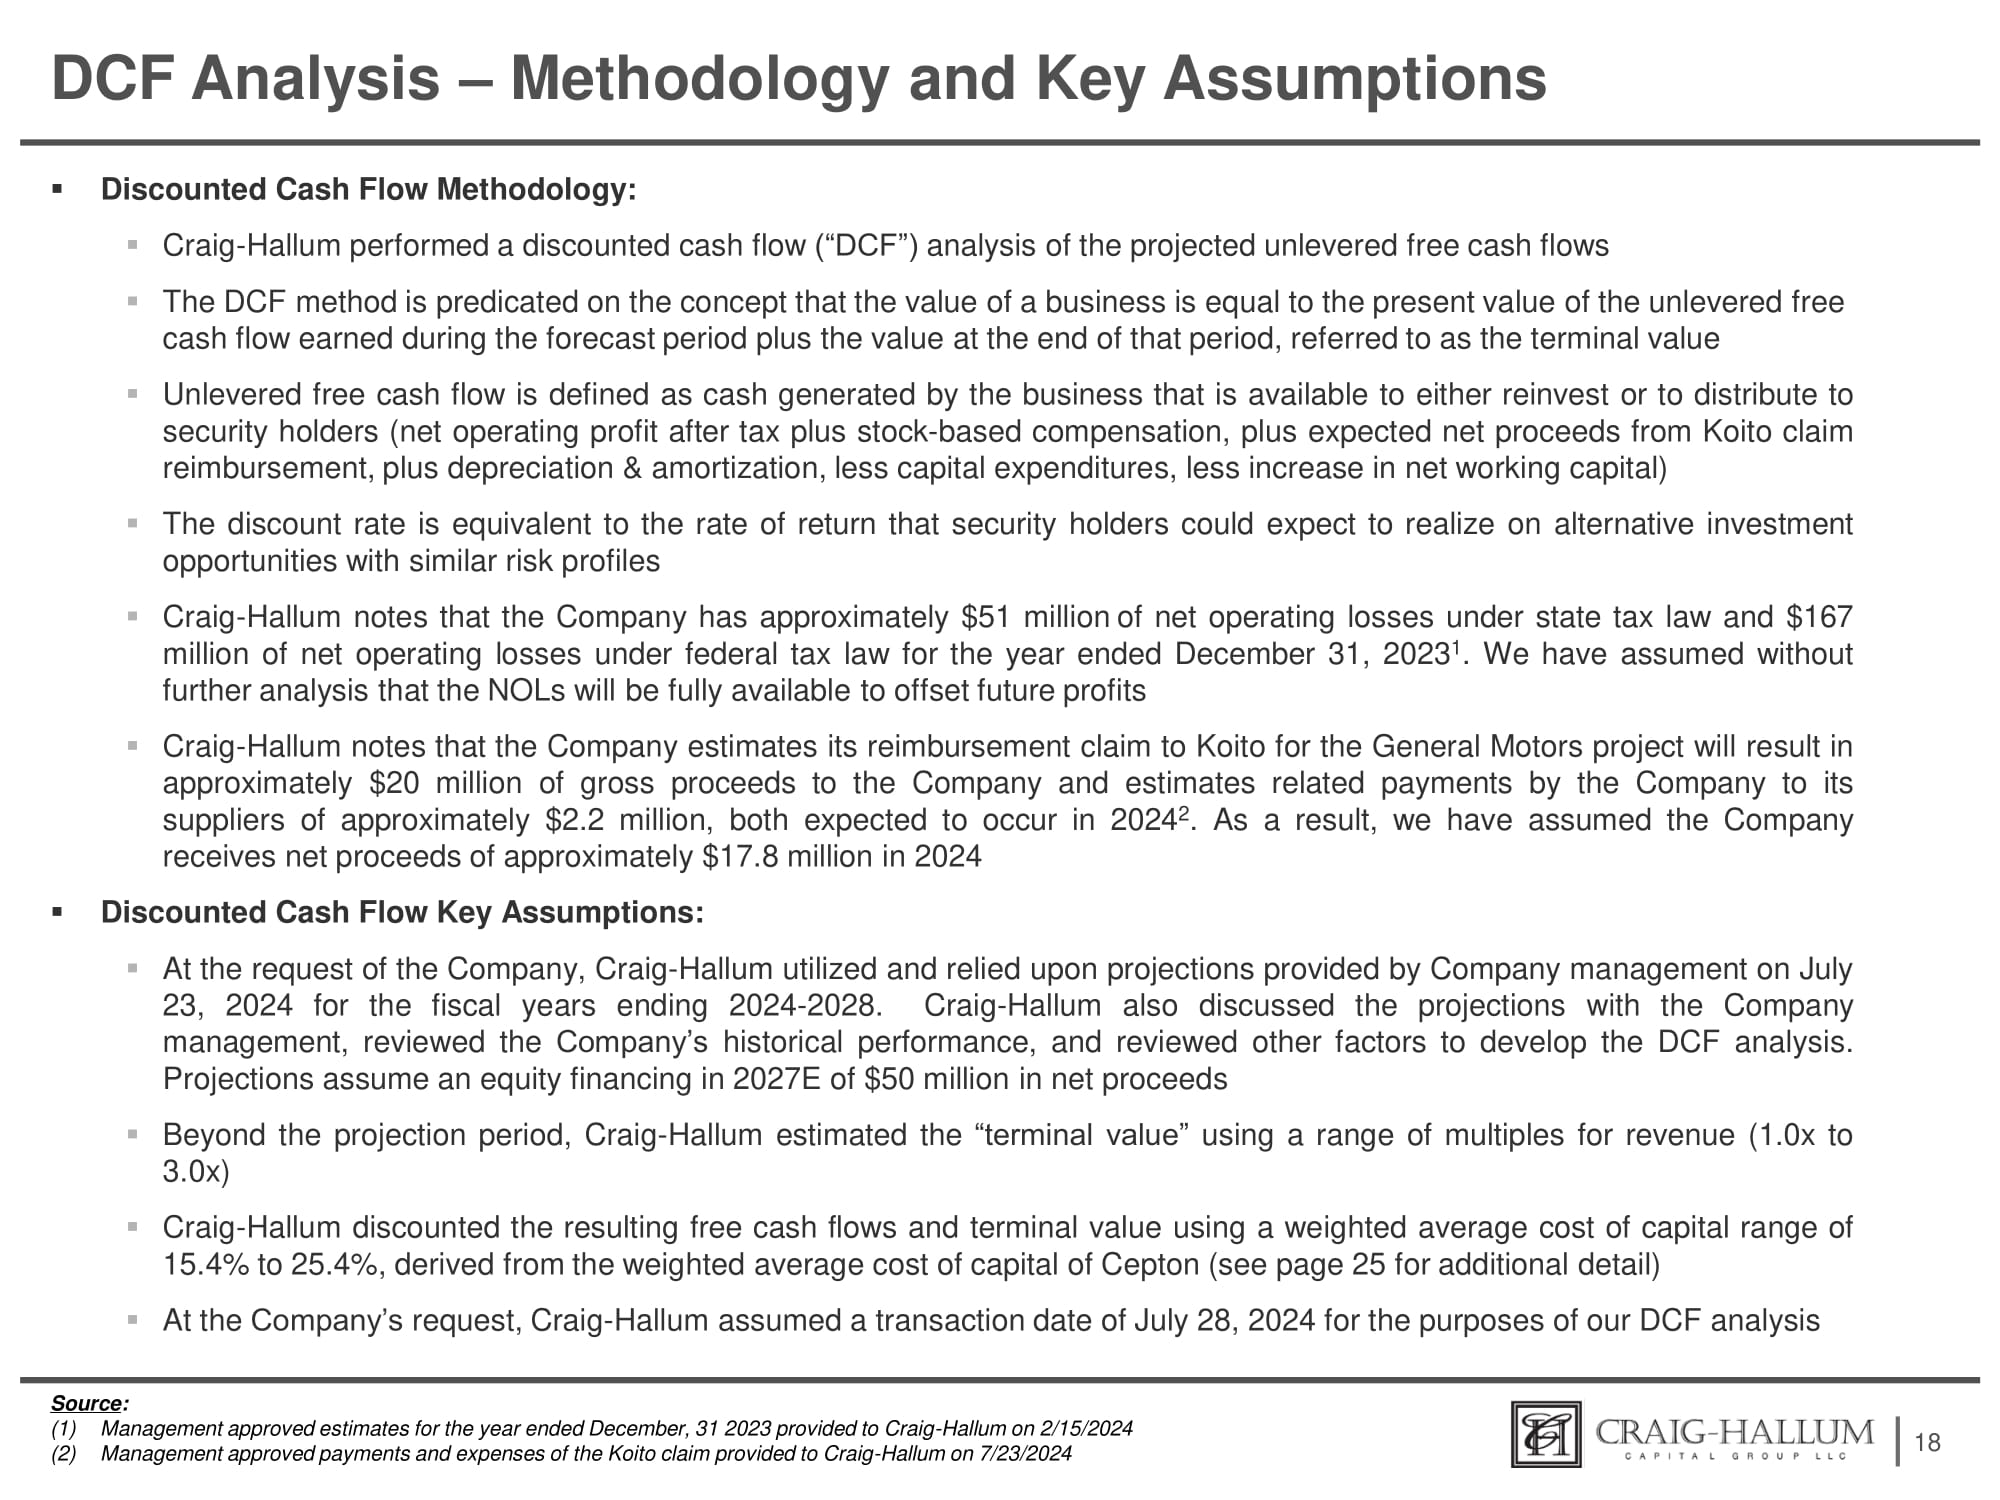
DCF Analysis – Methodology and Key Assumptions ▪ Discounted Cash Flow Methodology: ▪ Craig - Hallum performed a discounted cash flow (“DCF”) analysis of the projected unlevered free cash flows ▪ The DCF method is predicated on the concept that the value of a business is equal to the present value of the unlevered free cash flow earned during the forecast period plus the value at the end of that period, referred to as the terminal value ▪ Unlevered free cash flow is defined as cash generated by the business that is available to either reinvest or to distribute to security holders (net operating profit after tax plus stock - based compensation, plus expected net proceeds from Koito claim reimbursement, plus depreciation & amortization, less capital expenditures, less increase in net working capital) ▪ The discount rate is equivalent to the rate of return that security holders could expect to realize on alternative investment opportunities with similar risk profiles ▪ Craig - Hallum notes that the Company has approximately $ 51 million of net operating losses under state tax law and $ 167 million of net operating losses under federal tax law for the year ended December 31 , 2023 1 . We have assumed without further analysis that the NOLs will be fully available to offset future profits ▪ Craig - Hallum notes that the Company estimates its reimbursement claim to Koito for the General Motors project will result in approximately $ 20 million of gross proceeds to the Company and estimates related payments by the Company to its suppliers of approximately $ 2 . 2 million, both expected to occur in 2024 2 . As a result, we have assumed the Company receives net proceeds of approximately $ 17 . 8 million in 2024 ▪ Discounted Cash Flow Key Assumptions: ▪ At the request of the Company, Craig - Hallum utilized and relied upon projections provided by Company management on July 23 , 2024 for the fiscal years ending 2024 - 2028 . Craig - Hallum also discussed the projections with the Company management, reviewed the Company’s historical performance, and reviewed other factors to develop the DCF analysis . Projections assume an equity financing in 2027 E of $ 50 million in net proceeds ▪ Beyond the projection period, Craig - Hallum estimated the “terminal value” using a range of multiples for revenue ( 1 . 0 x to 3 . 0 x) ▪ Craig - Hallum discounted the resulting free cash flows and terminal value using a weighted average cost of capital range of 15 . 4 % to 25 . 4 % , derived from the weighted average cost of capital of Cepton (see page 25 for additional detail) ▪ At the Company’s request, Craig - Hallum assumed a transaction date of July 28, 2024 for the purposes of our DCF analysis 18 Source : (1) Management approved estimates for the year ended December, 31 2023 provided to Craig - Hallum on 2/15/2024 (2) Management approved payments and expenses of the Koito claim provided to Craig - Hallum on 7/23/2024
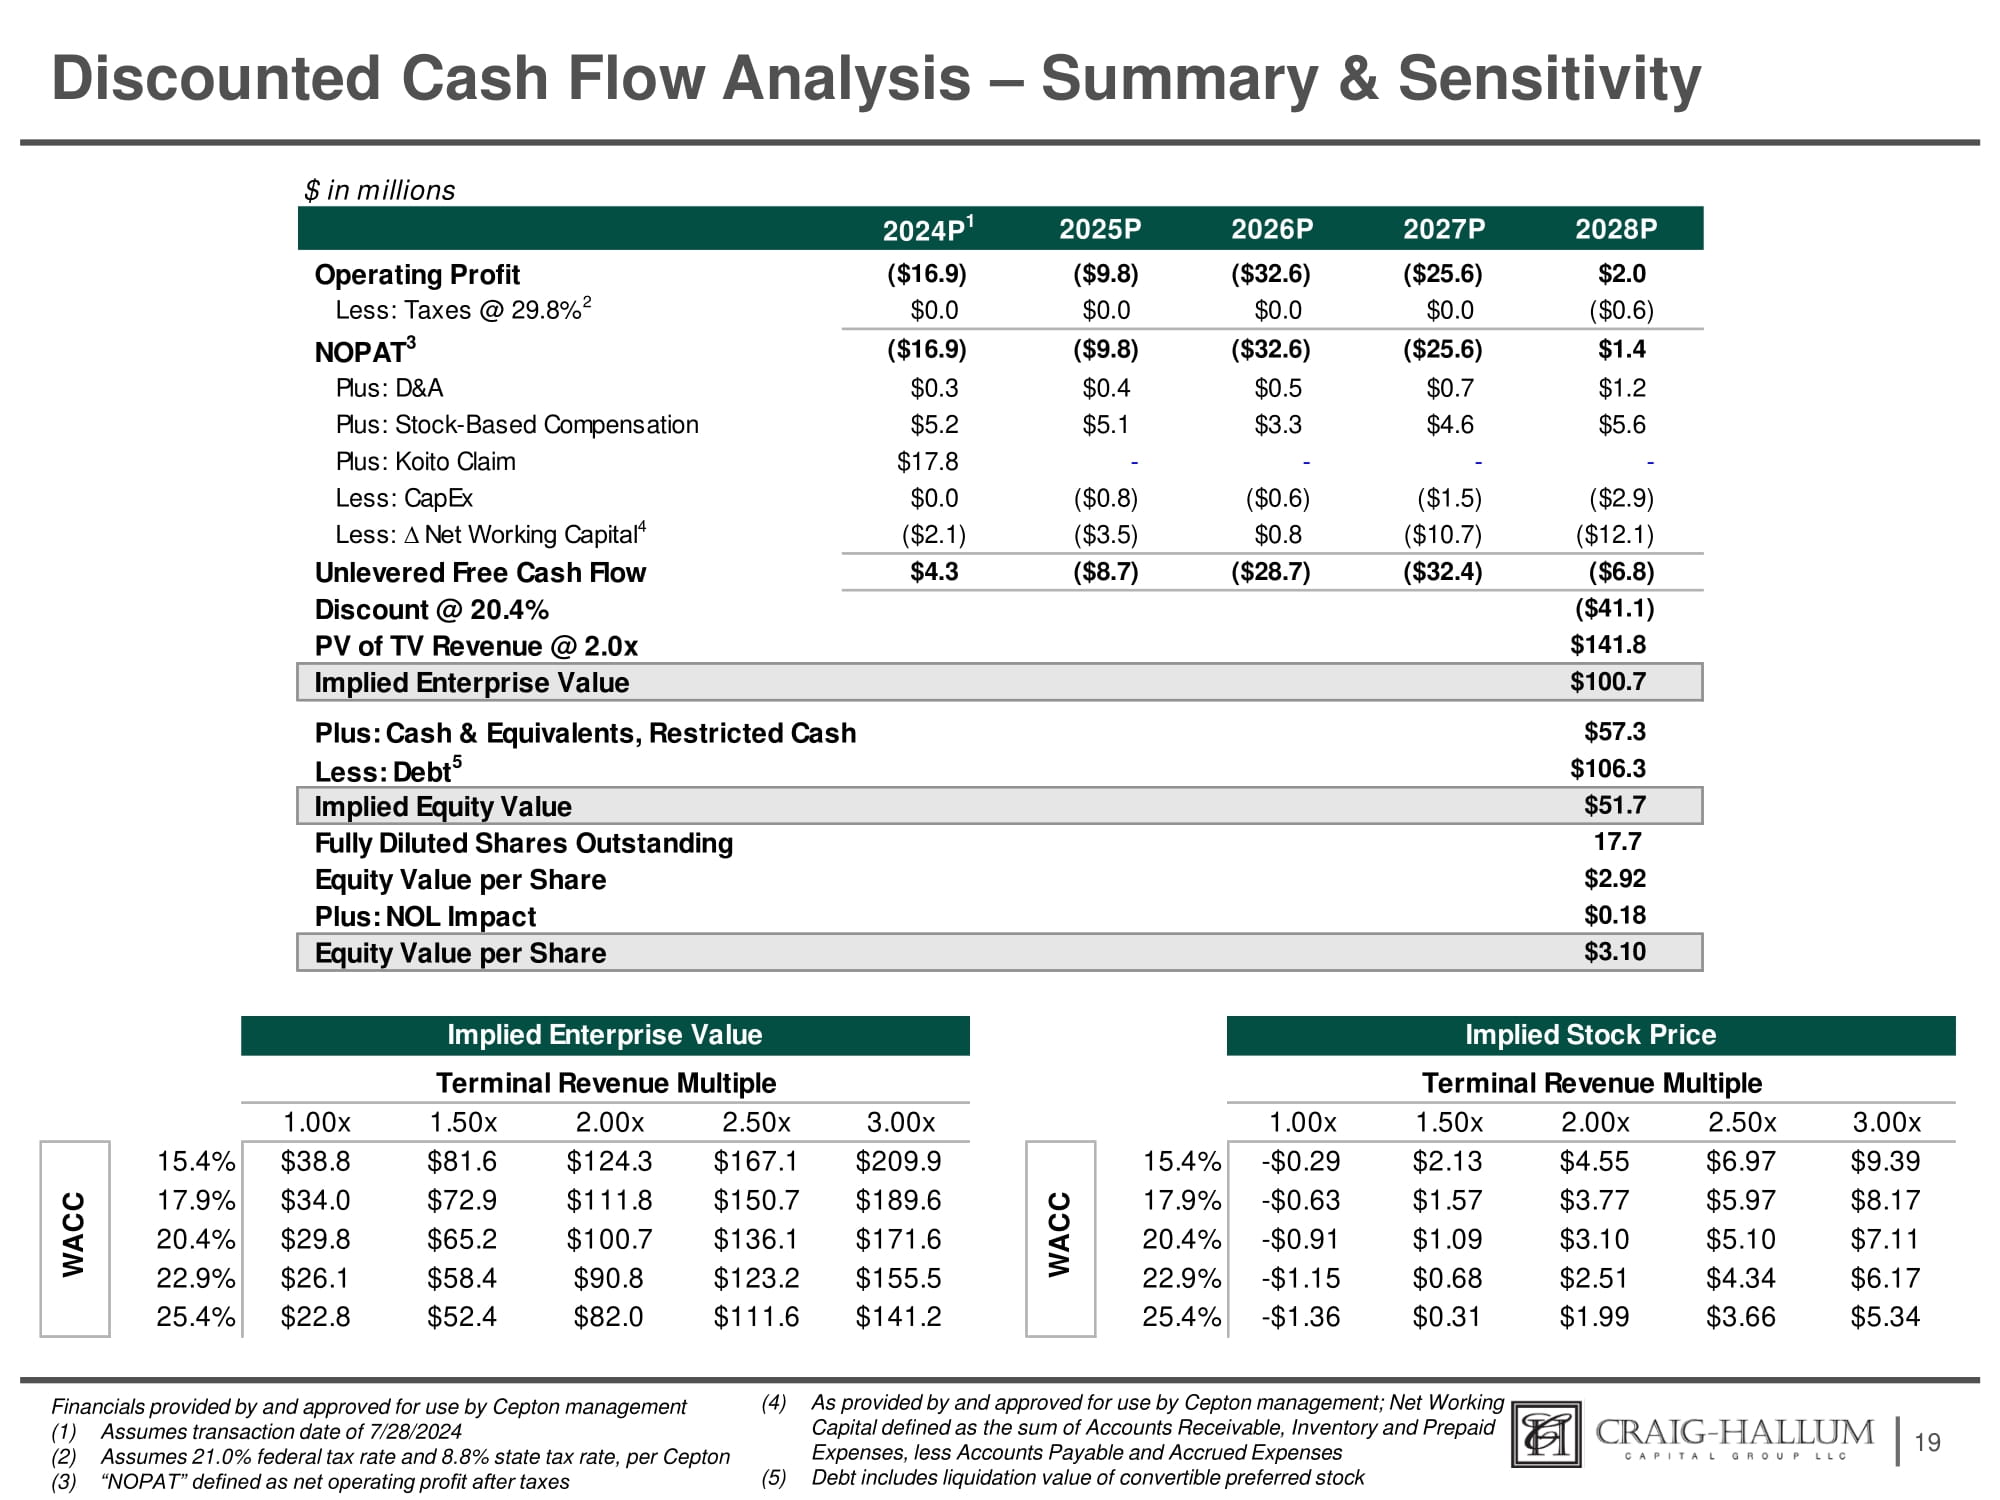
Discounted Cash Flow Analysis – Summary & Sensitivity 19 Financials provided by and approved for use by Cepton management (1) Assumes transaction date of 7/28/2024 (2) Assumes 21.0% federal tax rate and 8.8% state tax rate, per Cepton (3) “NOPAT” defined as net operating profit after taxes (4) As provided by and approved for use by Cepton management; Net Working Capital defined as the sum of Accounts Receivable, Inventory and Prepaid Expenses, less Accounts Payable and Accrued Expenses (5) Debt includes liquidation value of convertible preferred stock $ in millions 2028P 2027P 2026P 2025P 2024P 1 $2.0 ($25.6) ($32.6) ($9.8) ($16.9) Operating Profit ($0.6) $0.0 $0.0 $0.0 $0.0 Less: Taxes @ 29.8% 2 $1.4 ($25.6) ($32.6) ($9.8) ($16.9) NOPAT 3 $1.2 $0.7 $0.5 $0.4 $0.3 Plus: D&A $5.6 $4.6 $3.3 $5.1 $5.2 Plus: Stock - Based Compensation - - - - $17.8 Plus: Koito Claim ($2.9) ($1.5) ($0.6) ($0.8) $0.0 Less: CapEx ($12.1) ($10.7) $0.8 ($3.5) ($2.1) Less: ∆ Net Working Capital 4 ($6.8) ($32.4) ($28.7) ($8.7) $4.3 Unlevered Free Cash Flow ($41.1) Discount @ 20.4% $141.8 PV of TV Revenue @ 2.0x $100.7 Implied Enterprise Value $57.3 Plus: Cash & Equivalents, Restricted Cash $106.3 Less: Debt 5 $51.7 Implied Equity Value 17.7 Fully Diluted Shares Outstanding $2.92 Equity Value per Share $0.18 Plus: NOL Impact $3.10 Equity Value per Share 3.00x 2.50x 2.00x 1.50x 1.00x 3.00x 2.50x 2.00x 1.50x 1.00x $9.39 $6.97 $4.55 $2.13 - $0.29 15.4% $209.9 $167.1 $124.3 $81.6 $38.8 15.4% $8.17 $5.97 $3.77 $1.57 - $0.63 17.9% C $189.6 $150.7 $111.8 $72.9 $34.0 17.9% $7.11 $5.10 $3.10 $1.09 - $0.91 20.4% A C $171.6 $136.1 $100.7 $65.2 $29.8 20.4% $6.17 $4.34 $2.51 $0.68 - $1.15 22.9% W $155.5 $123.2 $90.8 $58.4 $26.1 22.9% $5.34 $3.66 $1.99 $0.31 - $1.36 25.4% $141.2 $111.6 $82.0 $52.4 $22.8 25.4% Implied Enterprise Value Terminal Revenue Multiple WACC Implied Stock Price Terminal Revenue Multiple
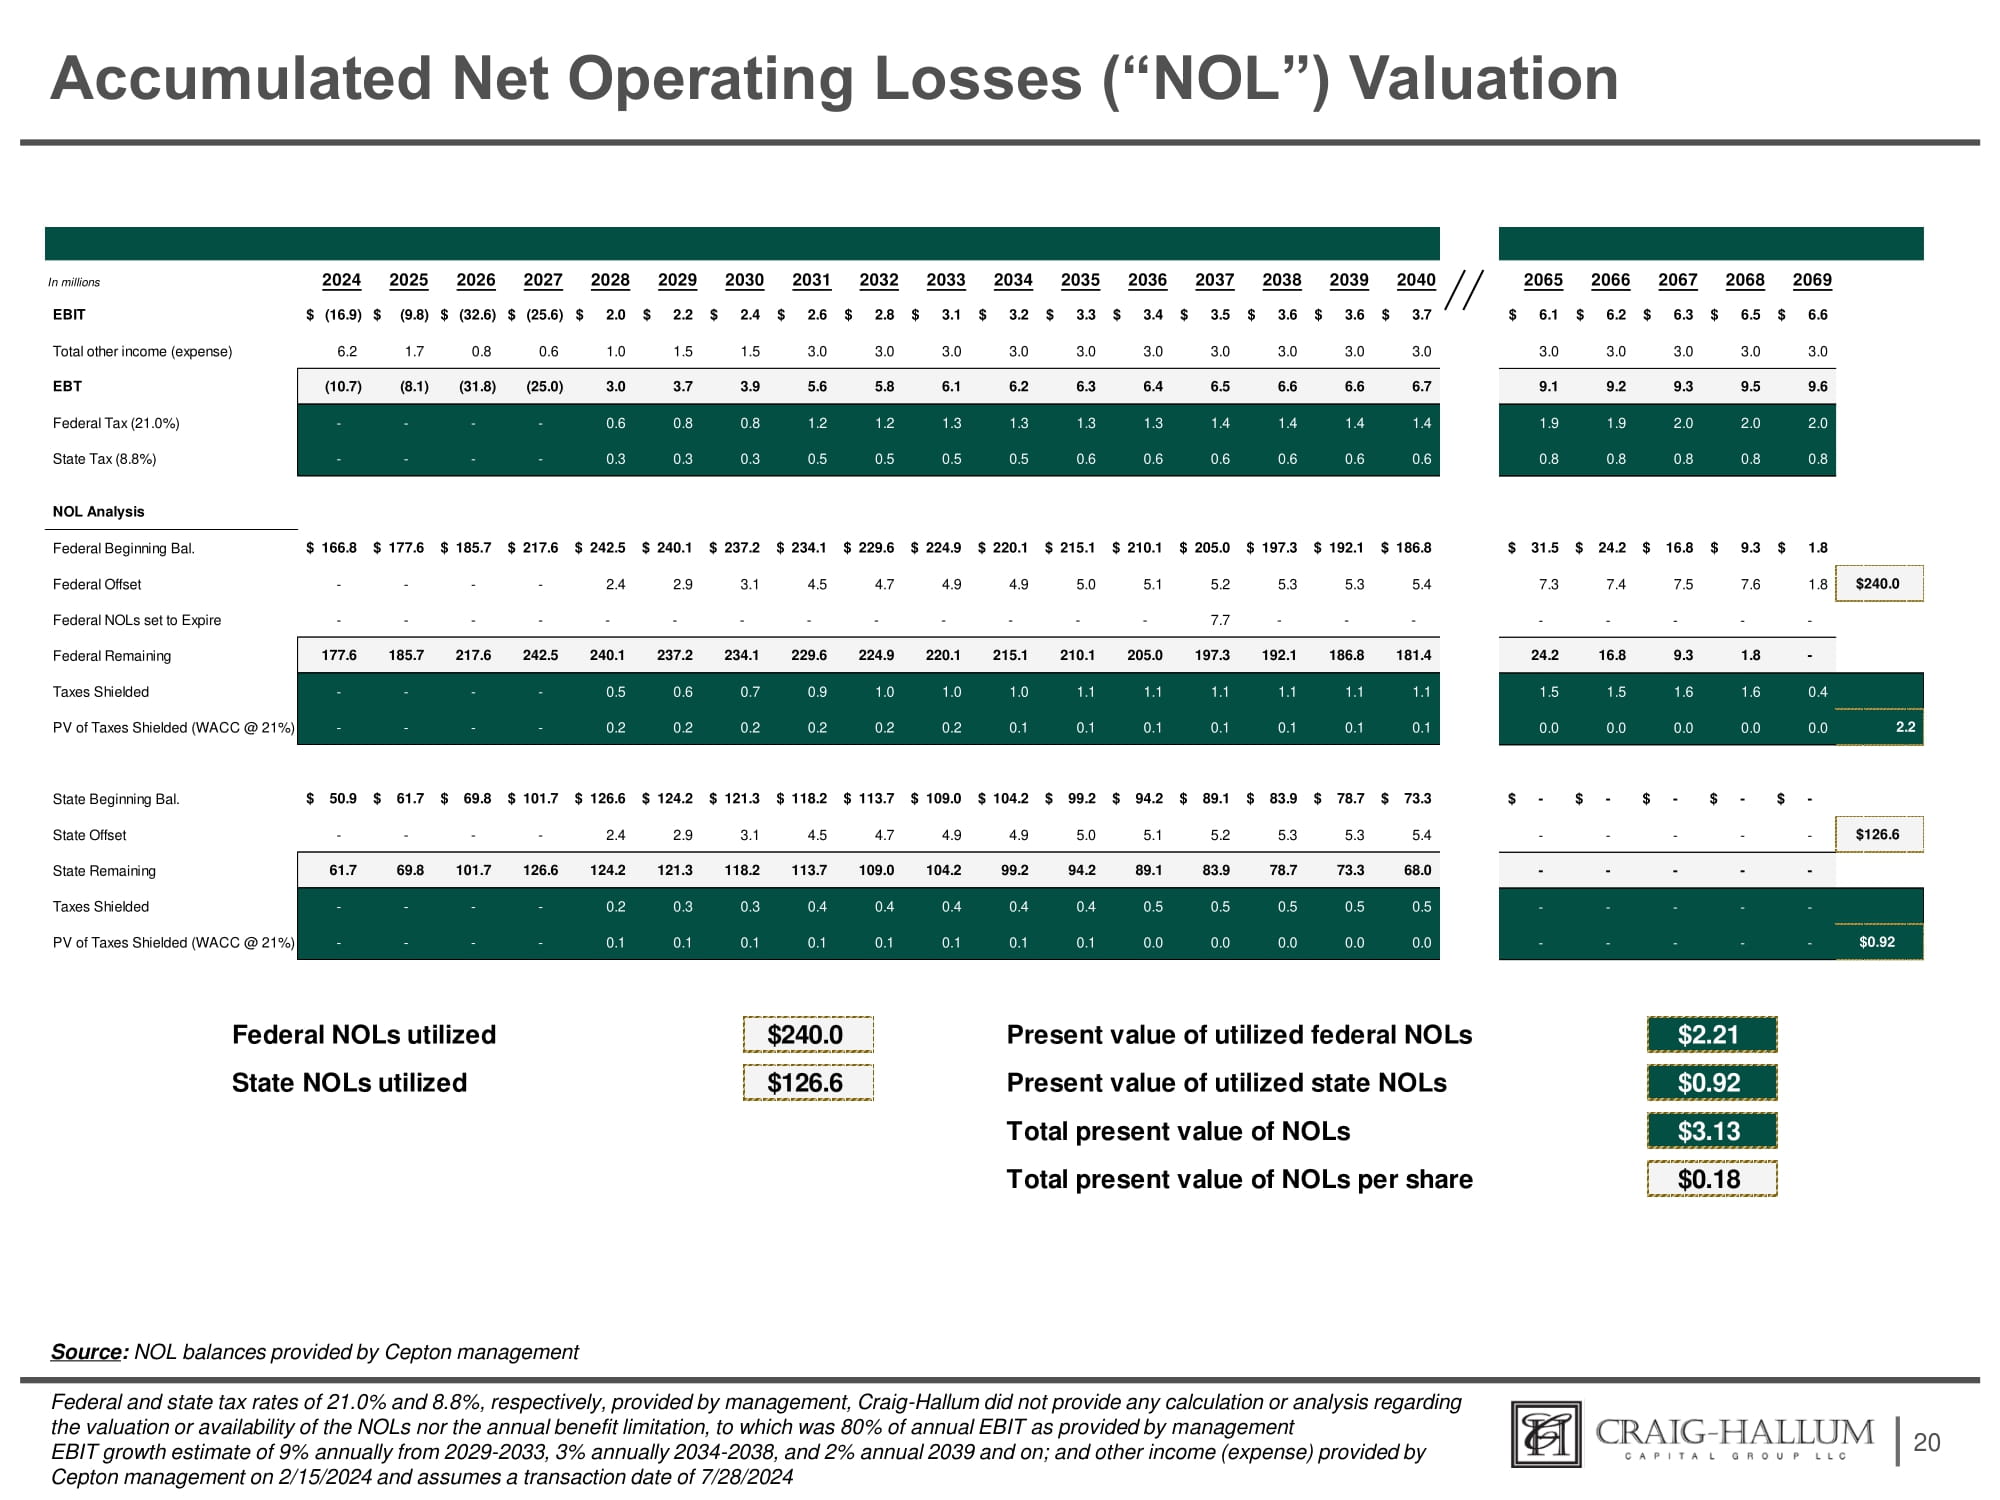
Accumulated Net Operating Losses (“NOL”) Valuation 20 Source : NOL balances provided by Cepton management Federal and state tax rates of 21.0% and 8.8%, respectively, provided by management, Craig - Hallum did not provide any calculation or analysis regarding the valuation or availability of the NOLs nor the annual benefit limitation, to which was 80% of annual EBIT as provided by management EBIT growth estimate of 9% annually from 2029 - 2033, 3% annually 2034 - 2038, and 2% annual 2039 and on; and other income (expense) provided by Cepton management on 2/15/2024 and assumes a transaction date of 7/28/2024 Federal NOLs utilized State NOLs utilized $240.0 Present value of utilized federal NOLs Present value of utilized state NOLs Total present value of NOLs Total present value of NOLs per share $2.21 $126.6 $0.92 $3.13 $0.18 In millions EBIT 2024 2025 2026 2027 2028 2029 2030 2031 2032 2033 2034 2035 2036 2037 2038 2039 2040 $ (16.9) $ (9.8) $ (32.6) $ (25.6) $ 2.0 $ 2.2 $ 2.4 $ 2.6 $ 2.8 $ 3.1 $ 3.2 $ 3.3 $ 3.4 $ 3.5 $ 3.6 $ 3.6 $ 3.7 6.2 1.7 0.8 0.6 1.0 1.5 1.5 3.0 3.0 3.0 3.0 3.0 3.0 3.0 3.0 3.0 3.0 (10.7) (8.1) (31.8) (25.0) 3.0 3.7 3.9 5.6 5.8 6.1 6.2 6.3 6.4 6.5 6.6 6.6 6.7 - - - - 0.6 0.8 0.8 1.2 1.2 1.3 1.3 1.3 1.3 1.4 1.4 1.4 1.4 - - - - 0.3 0.3 0.3 0.5 0.5 0.5 0.5 0.6 0.6 0.6 0.6 0.6 0.6 Total other income (expense) EBT Federal Tax (21.0%) State Tax (8.8%) NOL Analysis Federal Beginning Bal. Federal Offset Federal NOLs set to Expire Federal Remaining Taxes Shielded PV of Taxes Shielded (WACC @ 21%) $ 166.8 $ 177.6 $ 185.7 $ 217.6 $ 242.5 $ 240.1 $ 237.2 $ 234.1 $ 229.6 $ 224.9 $ 220.1 $ 215.1 $ 210.1 $ 205.0 $ 197.3 $ 192.1 $ 186.8 - - - - 2.4 2.9 3.1 4.5 4.7 4.9 4.9 5.0 5.1 5.2 5.3 5.3 5.4 - - - - - - - - - - - - - 7.7 - - - 177.6 185.7 217.6 242.5 240.1 237.2 234.1 229.6 224.9 220.1 215.1 210.1 205.0 197.3 192.1 186.8 181.4 - - - - 0.5 0.6 0.7 0.9 1.0 1.0 1.0 1.1 1.1 1.1 1.1 1.1 1.1 - - - - 0.2 0.2 0.2 0.2 0.2 0.2 0.1 0.1 0.1 0.1 0.1 0.1 0.1 State Beginning Bal. State Offset State Remaining Taxes Shielded PV of Taxes Shielded (WACC @ 21%) $ 50.9 $ 61.7 $ 69.8 $ 101.7 $ 126.6 $ 124.2 $ 121.3 $ 118.2 $ 113.7 $ 109.0 $ 104.2 $ 99.2 $ 94.2 $ 89.1 $ 83.9 $ 78.7 $ 73.3 - - - - 2.4 2.9 3.1 4.5 4.7 4.9 4.9 5.0 5.1 5.2 5.3 5.3 5.4 61.7 69.8 101.7 126.6 124.2 121.3 118.2 113.7 109.0 104.2 99.2 94.2 89.1 83.9 78.7 73.3 68.0 - - - - 0.2 0.3 0.3 0.4 0.4 0.4 0.4 0.4 0.5 0.5 0.5 0.5 0.5 - - - - 0.1 0.1 0.1 0.1 0.1 0.1 0.1 0.1 0.0 0.0 0.0 0.0 0.0 9.6 9.5 9.3 9.2 9.1 2.0 2.0 2.0 1.9 1.9 0.8 0.8 0.8 0.8 0.8 $126.6 - - - - - - - - - - - - - - - - - - - - $0.92 2065 2066 2067 2068 2069 $ 6.1 $ 6.2 $ 6.3 $ 6.5 $ 6.6 3.0 3.0 3.0 3.0 3.0 9.3 $ 1.8 7.6 1.8 $240.0 - - 1.8 - 1.6 0.4 $ 31.5 $ 24.2 $ 16.8 $ 7.3 7.4 7.5 - - - 24.2 16.8 9.3 1.5 1.5 1.6 0.0 0.0 0.0 0.0 0.0 2.2 $ - $ - $ - $ - $ -
Private & Confidential Appendix A: Selected Public Company Descriptions
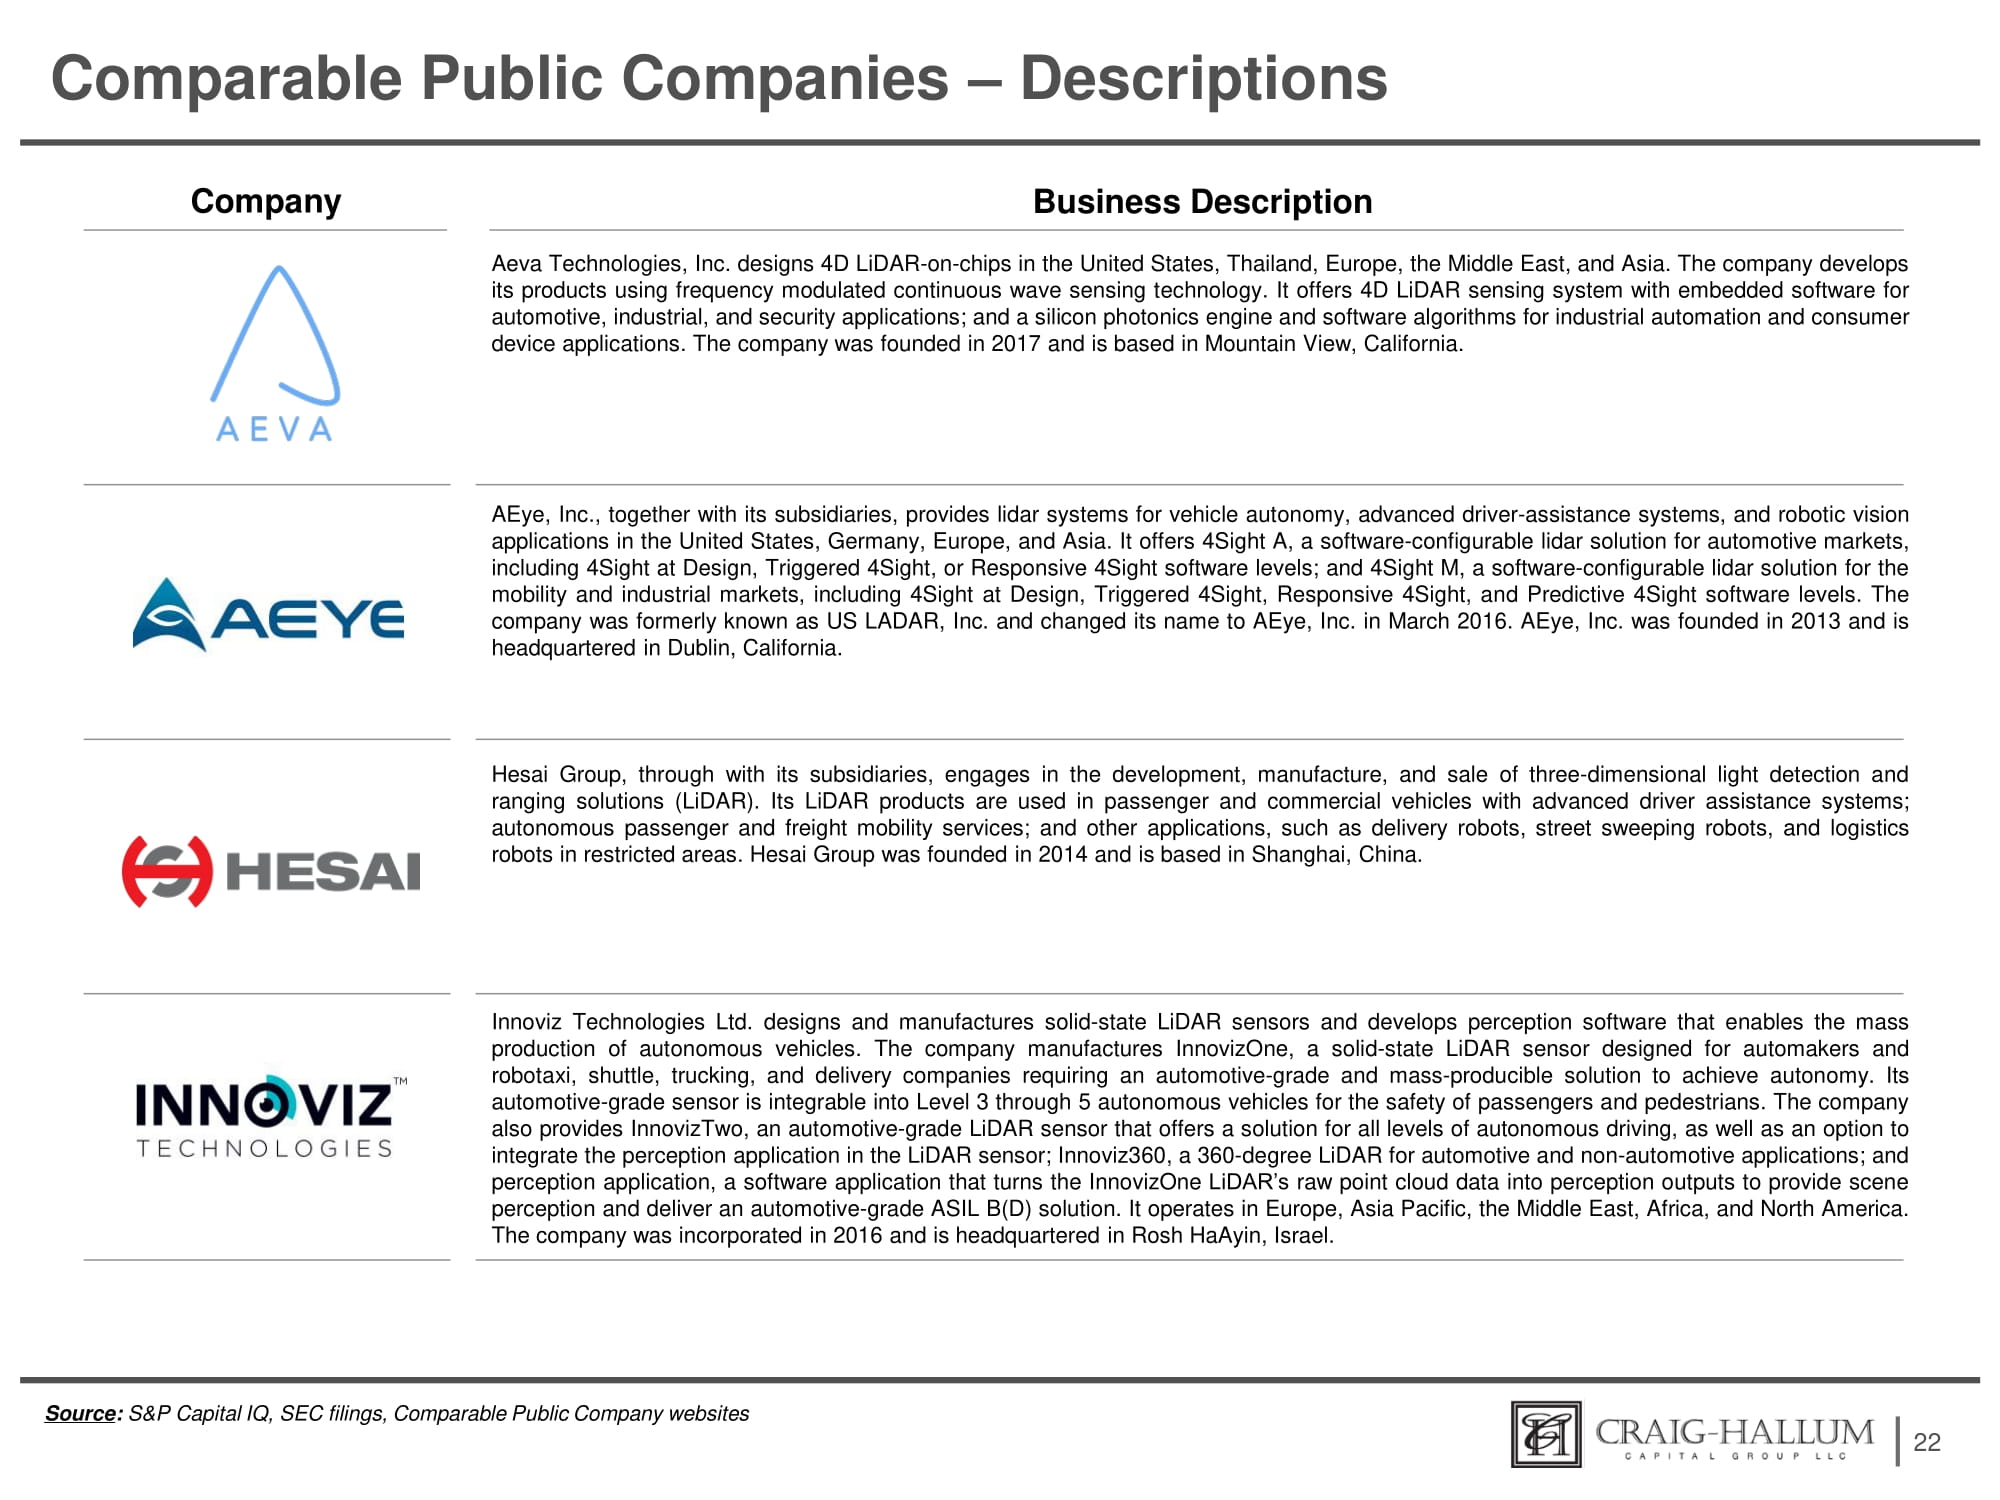
Comparable Public Companies – Descriptions 22 Company Business Description Aeva Technologies, Inc . designs 4 D LiDAR - on - chips in the United States, Thailand, Europe, the Middle East, and Asia . The company develops its products using frequency modulated continuous wave sensing technology . It offers 4 D LiDAR sensing system with embedded software for automotive, industrial, and security applications ; and a silicon photonics engine and software algorithms for industrial automation and consumer device applications . The company was founded in 2017 and is based in Mountain View, California . AEye, Inc . , together with its subsidiaries, provides lidar systems for vehicle autonomy, advanced driver - assistance systems, and robotic vision applications in the United States, Germany, Europe, and Asia . It offers 4 Sight A, a software - configurable lidar solution for automotive markets, including 4 Sight at Design, Triggered 4 Sight, or Responsive 4 Sight software levels ; and 4 Sight M, a software - configurable lidar solution for the mobility and industrial markets, including 4 Sight at Design, Triggered 4 Sight, Responsive 4 Sight, and Predictive 4 Sight software levels . The company was formerly known as US LADAR, Inc . and changed its name to AEye, Inc . in March 2016 . AEye, Inc . was founded in 2013 and is headquartered in Dublin, California . Source : S&P Capital IQ, SEC filings, Comparable Public Company websites Hesai Group, through with its subsidiaries, engages in the development, manufacture, and sale of three - dimensional light detection and ranging solutions (LiDAR) . Its LiDAR products are used in passenger and commercial vehicles with advanced driver assistance systems ; autonomous passenger and freight mobility services ; and other applications, such as delivery robots, street sweeping robots, and logistics robots in restricted areas . Hesai Group was founded in 2014 and is based in Shanghai, China . Innoviz Technologies Ltd . designs and manufactures solid - state LiDAR sensors and develops perception software that enables the mass production of autonomous vehicles . The company manufactures InnovizOne, a solid - state LiDAR sensor designed for automakers and robotaxi, shuttle, trucking, and delivery companies requiring an automotive - grade and mass - producible solution to achieve autonomy . Its automotive - grade sensor is integrable into Level 3 through 5 autonomous vehicles for the safety of passengers and pedestrians . The company also provides InnovizTwo, an automotive - grade LiDAR sensor that offers a solution for all levels of autonomous driving, as well as an option to integrate the perception application in the LiDAR sensor ; Innoviz 360 , a 360 - degree LiDAR for automotive and non - automotive applications ; and perception application, a software application that turns the InnovizOne LiDAR’s raw point cloud data into perception outputs to provide scene perception and deliver an automotive - grade ASIL B(D) solution . It operates in Europe, Asia Pacific, the Middle East, Africa, and North America . The company was incorporated in 2016 and is headquartered in Rosh HaAyin, Israel .
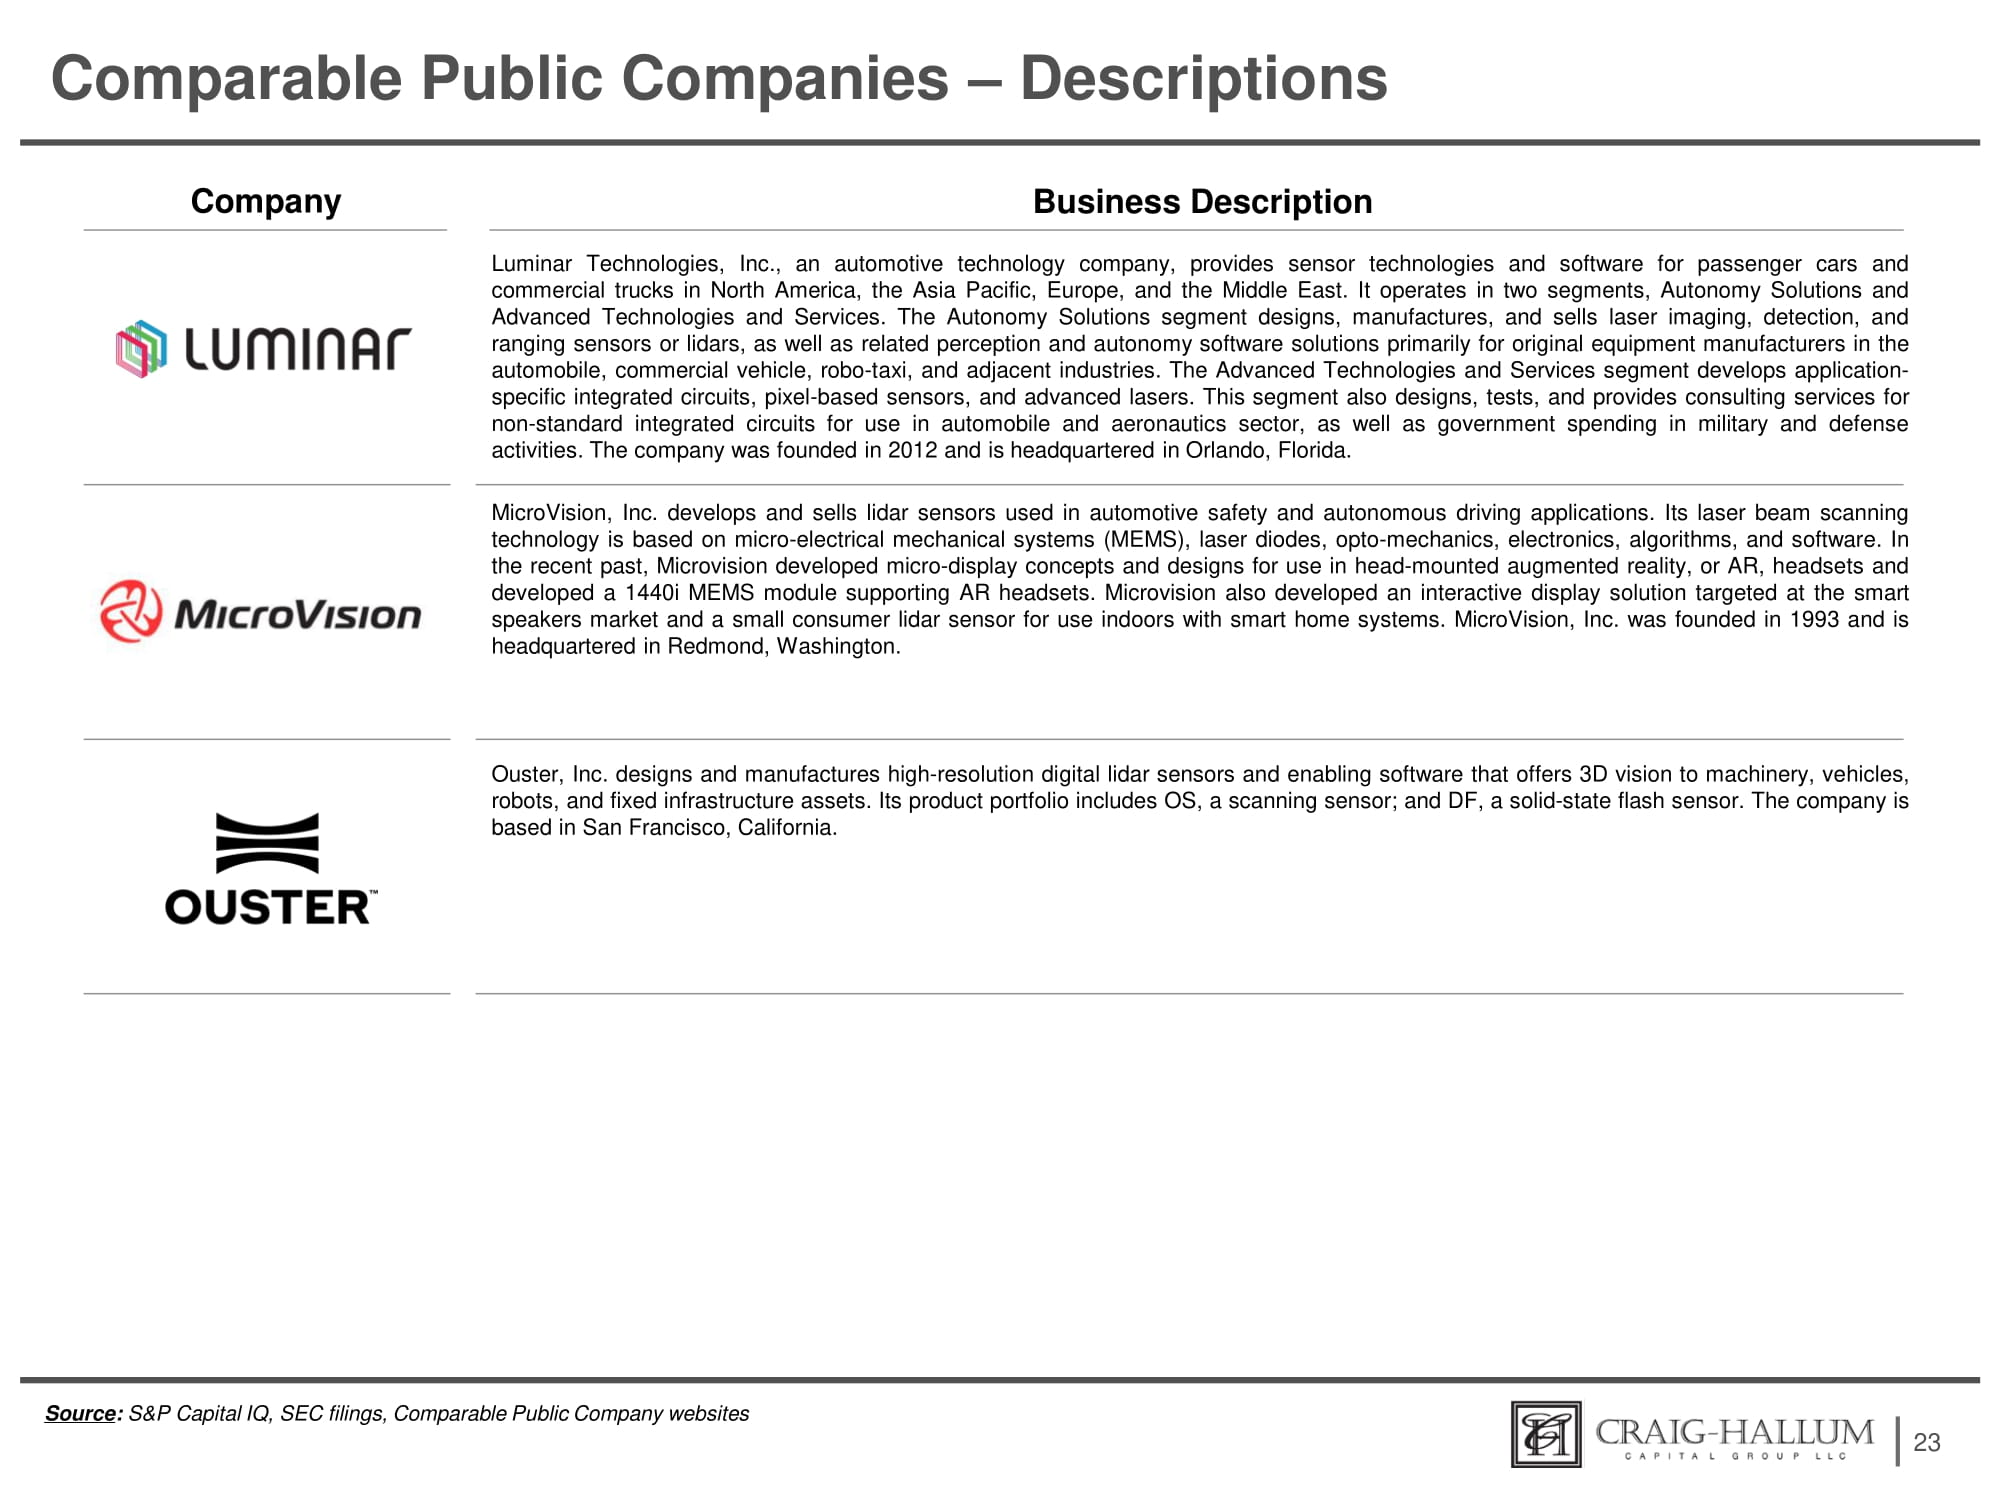
Comparable Public Companies – Descriptions 23 Company Business Description Luminar Technologies, Inc . , an automotive technology company, provides sensor technologies and software for passenger cars and commercial trucks in North America, the Asia Pacific, Europe, and the Middle East . It operates in two segments, Autonomy Solutions and Advanced Technologies and Services . The Autonomy Solutions segment designs, manufactures, and sells laser imaging, detection, and ranging sensors or lidars, as well as related perception and autonomy software solutions primarily for original equipment manufacturers in the automobile, commercial vehicle, robo - taxi, and adjacent industries . The Advanced Technologies and Services segment develops application - specific integrated circuits, pixel - based sensors, and advanced lasers . This segment also designs, tests, and provides consulting services for non - standard integrated circuits for use in automobile and aeronautics sector, as well as government spending in military and defense activities . The company was founded in 2012 and is headquartered in Orlando, Florida . MicroVision, Inc . develops and sells lidar sensors used in automotive safety and autonomous driving applications . Its laser beam scanning technology is based on micro - electrical mechanical systems (MEMS), laser diodes, opto - mechanics, electronics, algorithms, and software . In the recent past, Microvision developed micro - display concepts and designs for use in head - mounted augmented reality, or AR, headsets and developed a 1440 i MEMS module supporting AR headsets . Microvision also developed an interactive display solution targeted at the smart speakers market and a small consumer lidar sensor for use indoors with smart home systems . MicroVision, Inc . was founded in 1993 and is headquartered in Redmond, Washington . Source : S&P Capital IQ, SEC filings, Comparable Public Company websites Ouster, Inc . designs and manufactures high - resolution digital lidar sensors and enabling software that offers 3 D vision to machinery, vehicles, robots, and fixed infrastructure assets . Its product portfolio includes OS, a scanning sensor ; and DF, a solid - state flash sensor . The company is based in San Francisco, California .
Private & Confidential Appendix B: Weighted Average Cost of Capital
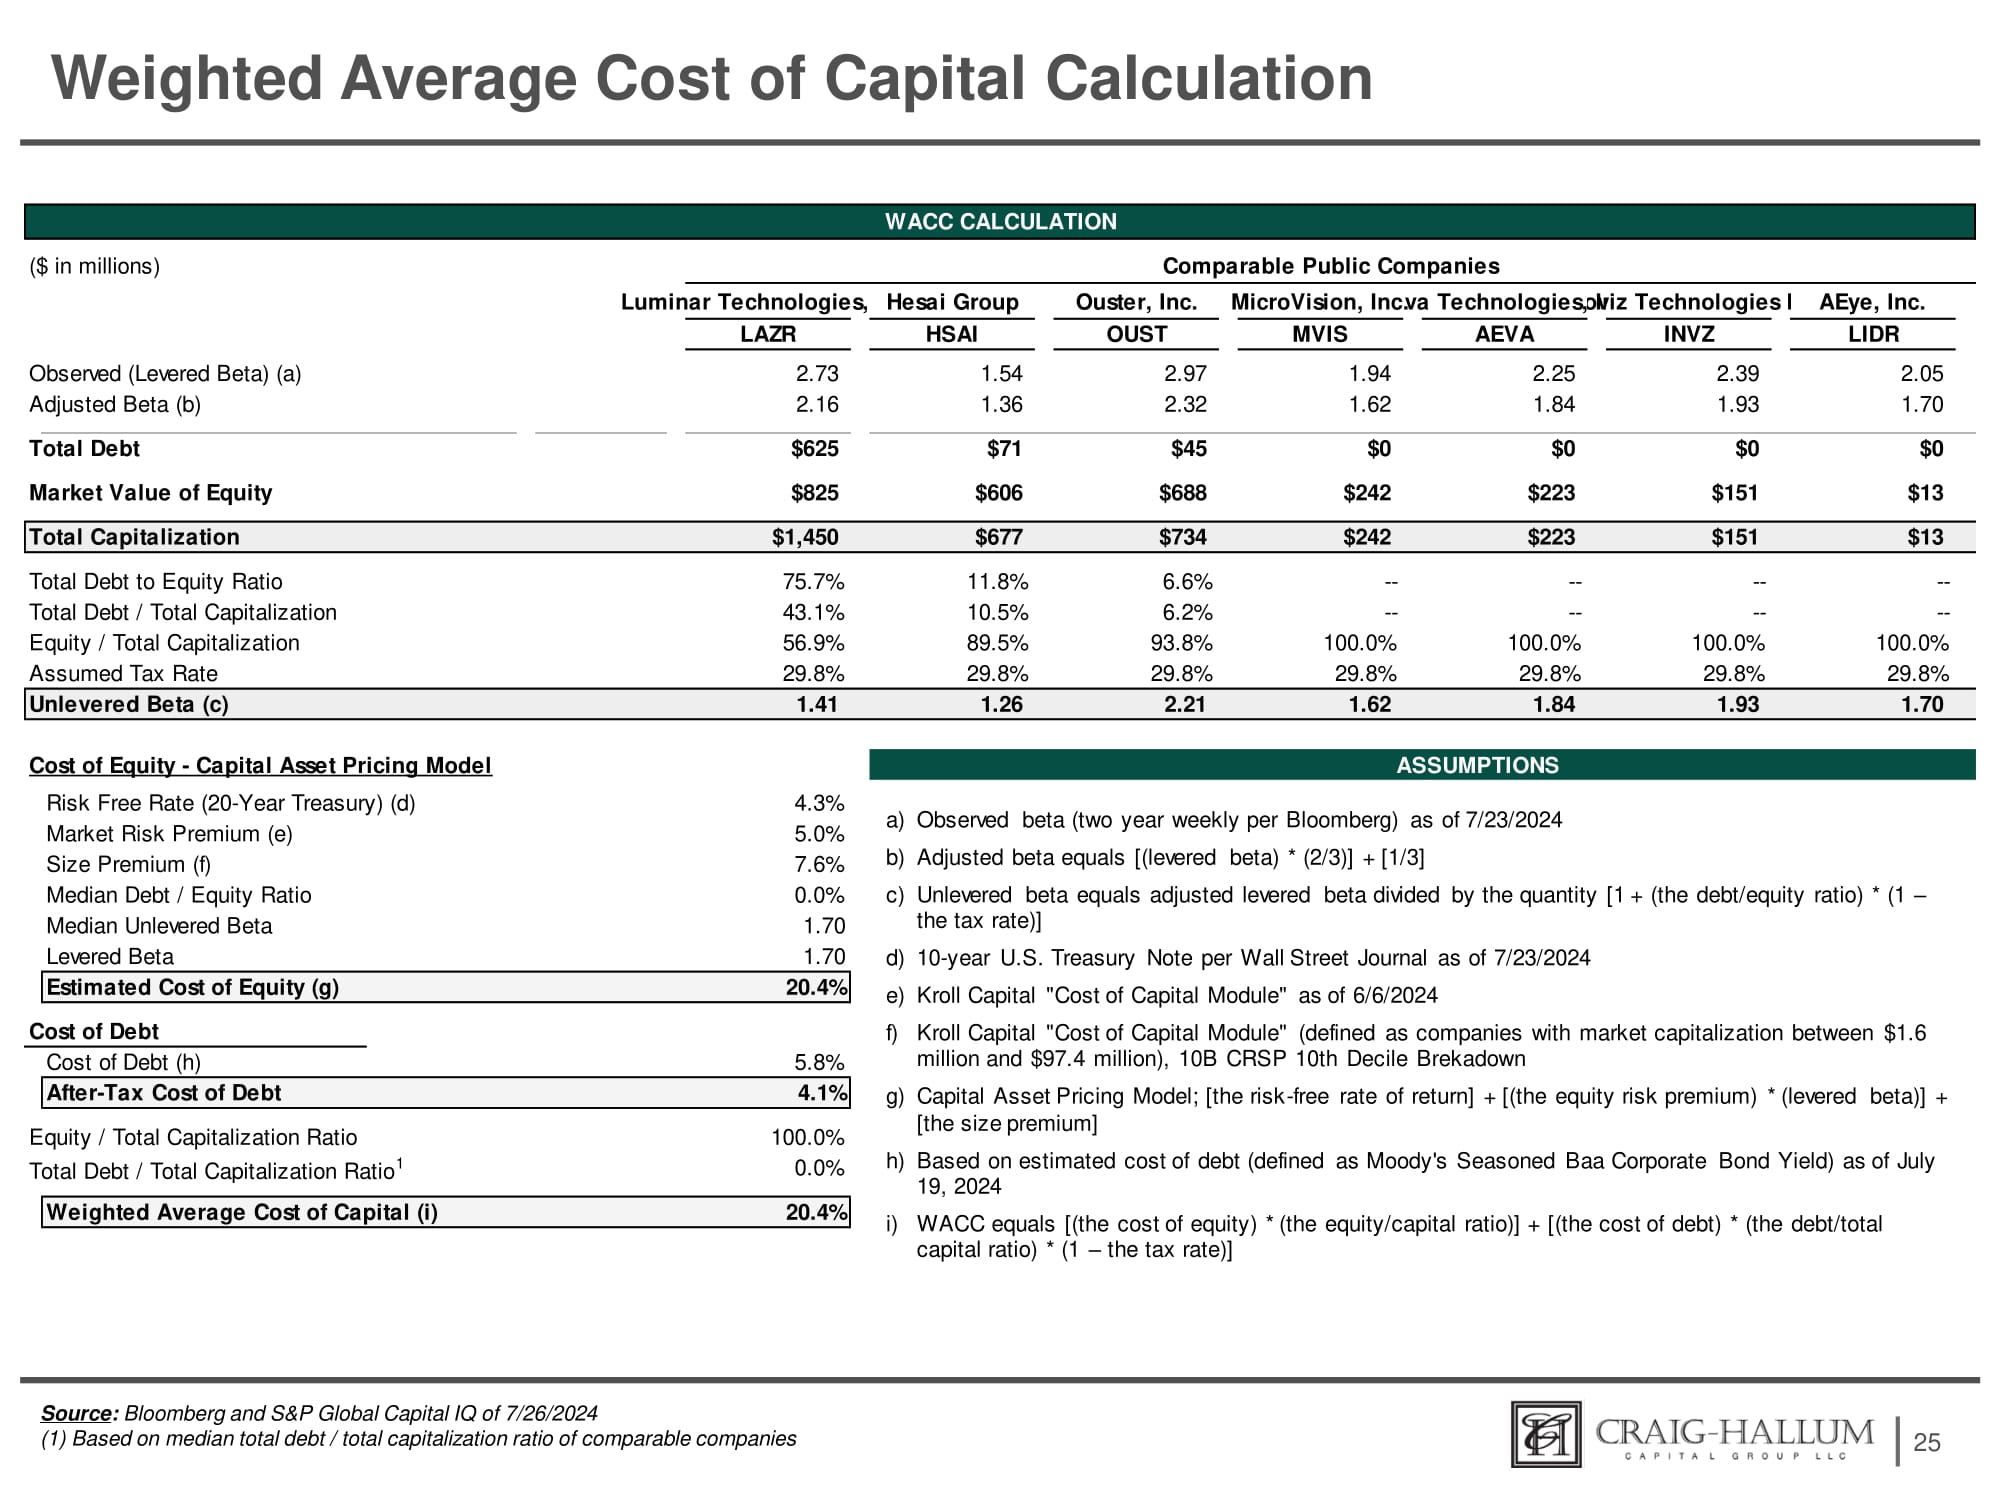
Weighted Average Cost of Capital Calculation 25 Source : Bloomberg and S&P Global Capital IQ of 7/26/2024 (1) Based on median total debt / total capitalization ratio of comparable companies LIDR INVZ AEVA MVIS OUST HSAI LAZR 2.05 2.39 2.25 1.94 2.97 1.54 2.73 Observed (Levered Beta) (a) 1.70 1.93 1.84 1.62 2.32 1.36 2.16 Adjusted Beta (b) $0 $0 $0 $0 $45 $71 $625 Total Debt $13 $151 $223 $242 $688 $606 $825 Market Value of Equity $13 $151 $223 $242 $734 $677 $1,450 Total Capitalization - - - - - - - - 6.6% 11.8% 75.7% Total Debt to Equity Ratio - - - - - - - - 6.2% 10.5% 43.1% Total Debt / Total Capitalization 100.0% 100.0% 100.0% 100.0% 93.8% 89.5% 56.9% Equity / Total Capitalization 29.8% 29.8% 29.8% 29.8% 29.8% 29.8% 29.8% Assumed Tax Rate 1.70 1.93 1.84 1.62 2.21 1.26 1.41 Unlevered Beta (c) WACC CALCULATION ($ in millions) Comparable Public Companies Luminar Technologies, Hesai Group Ouster, Inc. MicroVision, Inc.va Technologies,oIviz Technologies AEye, Inc. Cost of Equity - Capital Asset Pricing Model Risk Free Rate (20 - Year Treasury) (d) Market Risk Premium (e) Size Premium (f) Median Debt / Equity Ratio Median Unlevered Beta Levered Beta ASSUMPTIONS 4.3% 5.0% 7.6% 0.0% 1.70 1.70 Estimated Cost of Equity (g) 20.4% Cost of Debt Cost of Debt (h) 5.8% After - Tax Cost of Debt 4.1% 100.0% Equity / Total Capitalization Ratio 0.0% Total Debt / Total Capitalization Ratio 1 20.4% Weighted Average Cost of Capital (i) a) Observed beta (two year weekly per Bloomberg) as of 7/23/2024 b) Adjusted beta equals [(levered beta) * (2/3)] + [1/3] c) Unlevered beta equals adjusted levered beta divided by the quantity [1 + (the debt/equity ratio) * (1 – the tax rate)] d) 10 - year U.S. Treasury Note per Wall Street Journal as of 7/23/2024 e) Kroll Capital "Cost of Capital Module" as of 6/6/2024 f) Kroll Capital "Cost of Capital Module" (defined as companies with market capitalization between $1.6 million and $97.4 million), 10B CRSP 10th Decile Brekadown g) Capital Asset Pricing Model; [the risk - free rate of return] + [(the equity risk premium) * (levered beta)] + [the size premium] h) Based on estimated cost of debt (defined as Moody's Seasoned Baa Corporate Bond Yield) as of July 19, 2024 i) WACC equals [(the cost of equity) * (the equity/capital ratio)] + [(the cost of debt) * (the debt/total capital ratio) * (1 – the tax rate)]