我们设计、制造、推广和销售多个品牌的奢侈品,包括ZEGNA和Thom Browne。根据与雅诗兰黛公司签订的长期许可协议,我们还经营TOM FORD FASHION(“TFF”)业务。我们的销售额和实现优质定价的能力取决于我们品牌的认知、认可度和声誉,而这反过来又取决于产品设计、产品和客户服务的独特性和质量、我们商店的形象以及我们的特许经营商和其他批发客户的形象、我们广告和传播活动的成功以及我们的总体企业形象等因素。
收购新业务还可能使我们面临与所收购业务具体相关的其他风险。例如,根据TFI收购的安排(并以收购完成为准),Tom Ford International创始人兼首席执行官Tom Ford先生一直担任该品牌的创意远见者,直至2023年底。他在执掌TOM FORD品牌多年后离职最终可能会对TOM FORD FASHION业务产生重大不利影响,从而对我们的运营业绩和财务状况产生重大不利影响。
在批发渠道中,我们将产品销售给加盟商、专卖店、百货商店和在线零售商。在截至2023年12月31日的一年中,杰尼亚品牌产品批发渠道、Thom Browne和Tom Ford Fashion(在完成对TFI的收购后)的收入达到458.4欧元(占同期我们综合收入的24%)。终止或失去与我们的主要批发客户的现有商业关系,未能以经济上有利的条款(或根本没有)发展新的商业关系,或批发渠道收入大幅下降,可能会对我们的业务、经营业绩和财务状况产生重大不利影响。此外,任何非我们直接经营的零售商或我们的本地合作伙伴未能以与我们品牌的形象和声望一致的方式或按照任何商定的合同承诺(包括销售价格)来管理其门店,或在线零售商未能遵守消费者保护法或提供准确的产品描述,都可能损害我们品牌的竞争地位和形象,对我们的业务、运营结果和财务状况产生潜在的重大不利影响。请参阅“-我们的业务取决于我们品牌的认知度、诚信和声誉.”
该集团是一家全球奢侈品公司,是高端男装业务的领导者,并因其独特的纺织和制造平台而获得国际认可。传统、意大利工艺、质量和创新是其三个互补品牌的关键要素:ZEGNA、Thom Browne和TOM FORD FASHION。通过他们,我们的影响力扩大到不同的社区,从同名品牌ZEGNA的绝对标志性奢侈品,到Thom Browne的现代剪裁,再到TOM FORD FASHION的奢华魅力。得益于Thom Browne和TOM FORD FASHION,该集团还在奢侈女装和皮革制品领域发挥着重要且不断增长的作用。
自LanFisicio Ermenegildo Zegna e Figli S.p.A.成立以来(“Laniciio”或“Laniciio Ermenegildo Zegna”)在上个世纪初,Zegna一直是男装品质、风格和创新的代名词。ZEGNA品牌和Ermenegildo Zegna集团一直如此,并且将继续如此。
奢侈男装领导力
Ermenegildo Zegna集团植根于其100多年的历史,在奢侈男装领域拥有稳固的领导地位。这一无可争议的传统,加上独特且互补的品牌组合,构成了集团的主要竞争优势。ZEGNA已从最知名的男装品牌之一发展成为男装绝对奢华休闲服领域的标志品牌,在最重要的奢华街道和购物中心拥有顶级零售网络。2018年加入Thom Browne,2023年加入TOM FORD FASHION,通过抓住独特且互补的客户群体,同时利用集团的纺织和制造专业知识,进一步加强了集团的领导地位。
虽然我们的品牌保持着自己的身份和独特的设计天赋,但集团拥有作为长期工业合作伙伴和领先奢侈品牌聚合者的技能和经验。集团的内部实验室平台和制造专业知识、由杰尼亚家族领导的精干管理团队、对全球奢侈品市场(房地产开发和零售专业知识等)的广泛了解,使集团能够为其合作伙伴的业务增加价值。这方面的一个突出例子是Thom Browne在2018年收购后的表现,收入从2018年的11700万欧元增长到2023年冲销之前的38000万欧元。同样,TOM FORD FASHION业务的加入代表着利用集团平台的进一步机会。
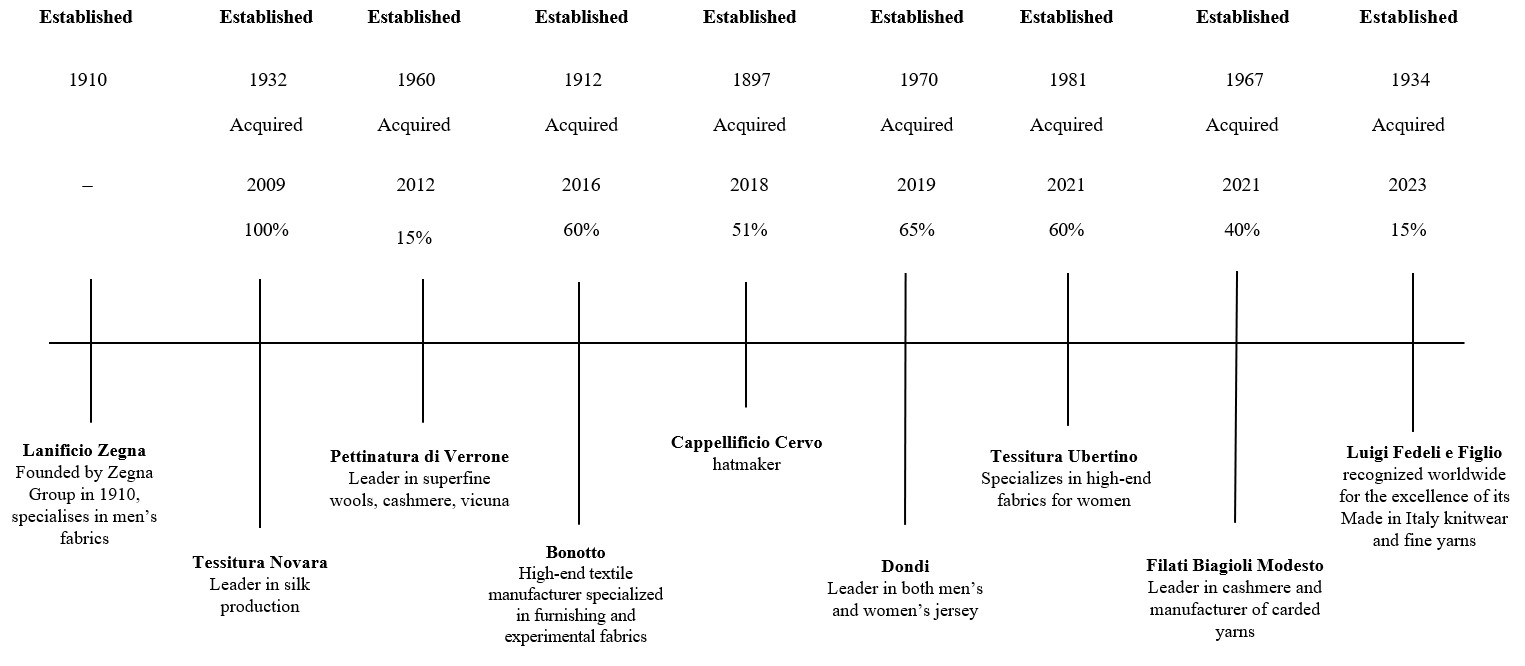
Ermenegildo Zegna Group设计、生产、销售和分销ZEGNA、Thom Browne和TOM FORD FASHION品牌的豪华男装、鞋类、皮革制品和其他配饰,Thom Browne和TOM FORD FASHION品牌的豪华女装以及Thom Browne品牌的童装。这三个品牌还为特定产品类别选择了第三方许可协议。该集团凭借其纺织品和针织品设计、制造和分销业务覆盖整个价值链(品牌包括LanFisicio Ermenegildo Zegna、Dondi、Bonotto、Tessitura di Novara、Tessitura Ubertino以及少数族裔Filati Biagioli Modesto和Luigi Fedeli e Figlio)。收购了历史悠久的意大利公司,每家公司都专门从事自己的产品领域,使集团多年来建立了一个真正的豪华纺织实验室,生产最高质量的面料并保障其意大利供应链的独特性。
Tom Ford Fashion分部对应于TOM FORD FASHION品牌的时尚业务,该品牌在TFI收购后成为本集团的一部分,代表本集团的一个新的运营和报告分部。Tom Ford Fashion部门包括与TOM Ford Fashion相关的所有活动,从系列创作和开发到营销,再到生产,以及零售和批发分销。
为测量而制作。 我们的豪华休闲服和正装产品还包括Made to Scale(Su Misura)服务,顾客可以在与风格顾问会面后,根据自己选择的面料、风格和饰面订购定制服装。这项服务不仅适用于西装,还适用于外衣、衬衫、裤子、针织衫、牛仔布和针织衫。我们的定制服务将定制提升到更高的水平,包括将独特作品组合在一起的完整体验,从草图和设计到面料的选择。每件单品都是由米兰和巴黎工作室的裁缝师使用历史悠久的剪裁技术专门为客户制作的。
截至2023年、2022年和2021年12月31日止年度,纺织产品线在冲销后产生的收入分别为150,986千欧元、136,769千欧元和102,244千欧元,占冲销后收入的7.9%、9.2%和7.9%。该纺织品产品线从事Laniciio Ermenegildo Zegna、Dondi、Bonotto、Tessitura di Novara、Tessitura Ubertino品牌的豪华面料的设计、制造和销售。我们相信,服装中使用的纺织品的卓越质量是集团多年来取得成功的主要原因之一。该集团还持有Filati Biagioli Modesto的少数股权(40%),并于最近收购了Luigi Fedeli e Figlio S.r.l.的15%股权,世界著名的意大利优质针织衫和纱线制造商。
季节性系列将在米兰时装周期间通过精致、优雅和现代的时装秀亮相,使品牌能够将自己定位为真正奢侈品的巅峰,创造引人入胜的内容,尽情享受和娱乐顶级客户和合作伙伴,并制定精心策划的VIP与会者名单,其中涵盖了TOM FORD FASHION的男性和女性。营销的策略重点是内容创作和增加对媒体的高度战略投资,以建立品牌的新准则--魅力、神秘的诱惑、精致的优雅--以建立知名度、客户忠诚度和品牌资产。
我们从ZZ Real Estate S.r.l.租赁集团业务运营中使用的部分房地产资产(“ZZ Real Estate”),该公司的前子公司,作为处置的一部分,于2021年11月1日分拆。此类房地产资产包括拥有制造设施的建筑物、公司办公室、展厅、仓库、土地和其他建筑物,包括我们在意大利的主要制造工厂和办事处(例如集团位于米兰的总部办事处,位于帕尔马、圣彼得罗·莫塞佐、维罗纳和奥莱焦的制造工厂,以及位于瓦尔迪拉纳的建筑的一部分,主要由我们占用)和瑞士(包括位于Stabio的办事处和位于Mendrisio的制造工厂)以及某些ZEGNA商店,即位于Sandigliano和Oleggio(意大利)以及伦敦(英国)。
我们还拥有Sagliano Micca(意大利)的Cappellificio Cervo以及Fossoli di Carpi(意大利)和Novi di Modena(意大利)的Dondi使用的某些房地产资产(制造设施、仓库和办公室)。
48
我们的制造设施目前有能力在必要时增加产量以满足更高的需求。
下表列出了与截至本报告日期我们开展业务时使用的自有房地产资产相关的信息。
位置
使用
近似平方米
意大利,Sagliano Micca,Via della Libertà 16
工厂、仓库和办公室
5,500
意大利,Fossoli di Carpi,意大利,via Budrione Migliarina 2/A
2023年9月5日,Ermenegildo Zegna集团和Prada集团完成了之前宣布的对Luigi Fedeli e Figlio S.r.l. 30%权益的收购,世界知名的意大利优质针织衫和纱线制造商,每个集团收购了该公司15%的股份。本集团支付了470万欧元的对价,收购了公司15%的股份。
2023年7月1日,集团收购了韩国Thom Browne业务,并开始在韩国直接运营Thom Browne业务,其网络由17家门店组成。该业务目前由Thom Browne Korea Ltd.全资拥有,一家新成立的全资子公司,将在前特许经营合作伙伴的外部支持下运营。本集团支付现金对价7,991千欧元,并确认递延对价18,583千欧元,于2023年12月31日为18,991千欧元,其中9,302千欧元预计将于2024年支付,分类为流动负债和9,预计将于2025年支付689千美元,并被归类为非流动负债。
2023年3月31日,本集团完成收购加拿大技术型越野鞋公司Norda Run Inc. 25%的权益。对价为710万美元,可选择在接下来的九年内逐步增持股份。豪华户外空间仍然是集团的重点领域,Norda Run使用地球上最好的材料生产世界上性能最好的全天候鞋类,完全符合集团用最好的材料创造最好的产品的价值观。该协议确保了通过强大的工商合作伙伴关系加速品牌增长的可能性。
2021年11月1日,本集团通过意大利法律下的法定分拆,将其若干业务出售给一家由其现有股东拥有的新公司,该新公司由(I)其房地产业务的现有股东拥有,该新公司包括本集团的前子公司EZ Real Estate,该子公司直接和间接持有本集团以前拥有的几乎所有房地产资产,以及Lanificio以前拥有的若干财产,包括Lanificio位于Valdiana的部分工业建筑和Lanificio的水电站,及(Ii)其于Elah Dufour S.p.A.的10%股权((I)及(Ii)统称为“分拆”)。2021年1月14日,集团出售了其在Agnona S.r.l的70%股权。(“阿格诺纳”)给了一个相关方,以供审议1欧,因此,阿格诺纳从2021年初开始解除合并。本集团其后于2021年9月及10月分两批出售Agnona剩余30%股权,总代价为50欧元万(出售Agnona股权连同分拆称为“性情,上述剥离的业务统称为已处置的业务”).
EZ Real Estate直接或间接拥有的大部分房地产已租赁给本集团,并将继续出租给本集团,包括存放本集团在意大利的制造设施、公司办公室、展厅、仓库、土地和其他建筑物的建筑物(包括位于米兰的总部、位于Parma、San Pietro Mosezzo、Verrone和Oleggio的制造设施,以及位于Valdiana的部分建筑物)和位于瑞士的部分建筑物(包括位于Stabio的办公室和位于Mendrisio的制造工厂),以及主要位于Sandigliano和Oleggio(意大利)和伦敦(英国)的若干Zegna门店。出售后,本集团继续根据相关租赁协议向EZ Real Estate或其附属公司支付租金,2023年和2022年的租金总额分别为12,268,000欧元和622.7欧元万。此外,已按市场条件作出适当安排,以确保构成处置一部分的Lanificio集团的房地产资产继续使用。
本集团寻求透过订立衍生合约(一般为远期出售外币合约)以预先厘定汇率或于未来日期厘定预定的汇率范围,以减轻其货币风险的影响。就杰尼亚及Tom Ford Fashion分部而言,本集团最初以欧元厘定销售价格,然后根据管理层根据合理预期及假设选定的汇率,厘定以其他货币计算的相应价格。远期销售合约乃根据估计收入及根据客户计划付款日期设定对冲合约到期日,而订立以特定货币计算的季节性价目表,以减轻实际汇率与管理层使用的预期汇率之间的差异所造成的影响。根据汇率的实际发展,可能会在相关季节进行额外的对冲交易。本集团继续在Thom Browne部门实施类似的政策,该部门在向国际市场扩张时更容易受到汇率影响。有关本集团所面对的市场风险的资料,见附注35--关于金融风险的定性和定量信息在本报告所列合并财务报表中列报。
截至2023年12月31日止年度收入为190454.9万欧元,增加41170.9万欧元,增幅+27.6%(按固定汇率计算+29.7%;有机增长+19.3%),而截至2022年12月31日止年度为149284万欧元,受Zegna和Thom Browne部门两位数增长的推动(包括以固定货币和有机增长为基础),以及Tom Ford Fashion部门在4月28日完成TFI收购后贡献的收入,2023.
(i)增加7663.1万欧元或+9.0% ZEGNA品牌产品(+4.1%固定汇率和有机增长),主要受以下推动:(a)鞋类持续积极表现和豪华休闲服的稳定增长,以及我们的裁缝和量身定制业务的反弹,特别是在美国和欧洲、中东和非洲,由于2021年受到COVID-19相关限制的影响,以及(b)作为ZEGNA One Brand新战略的一部分,从推出2022年秋冬系列开始,价格重新定位和价格上涨的影响;
(iii)增加122,666万欧元或+41.6%(按固定汇率计算+40.4%;受美国推动,北美地区有机增长+11.4%,包括2023年4月28日TFI收购完成后Tom Ford Fashion部门12家直营店的贡献,以及ZEGNA DT渠道两位数的收入增长,部分被上述批发交付转变以及纽约萨克斯第五大道商店从批发转变为DT的影响所抵消;以及
销售成本的增加主要归因于(i)TOM FORD FASHION的影响,该公司于2023年4月28日通过TFI收购,包括收购会计法对业务收购的影响,包括14欧元,368 000美元与收购后出售的所收购TFI库存公允价值的收购价格上涨以及1欧元,18.3万与订单积压有关,以及(ii)ZEGNA品牌产品、Thom Browne和Textile的销量增加。
毛利润占收入的百分比从截至2022年12月31日止年度的62.2%增加至截至2023年12月31日止年度的64.3%,主要原因是(i)与批发销售相比,DTC销售的比例更高(与批发销售相比,DTC销售的利润率更高,占截至12月31日的年度总销售额的66.4%,2023年,而截至2022年12月31日的一年为61.5%),(ii)作为ZEGNA One Brand战略的一部分,价格上涨、价格重新定位和季末销售减少的影响,该战略始于2022年秋冬系列的推出,去年(iii)供应链中固定成本的吸收率更高,以及(iv)根据ZEGNA One Brand战略,与季节性系列相比,Essentials系列的销售比例更高,这导致对缓慢流动和过时库存的拨备按比例减少。
毛利润占收入的百分比从截至2021年12月31日的年度的61.6%增加到截至2022年12月31日的年度的62.2%,主要原因是:(I)供应链中固定成本的吸收增加,原因是销售量更高,(Ii)作为新的杰尼亚One Brand战略的一部分,价格上涨、价格调整和季末销售减少的影响,从而增加了收入;(Iii)根据Jegna One Brand战略,Essentials系列的销售比例高于季节性系列,这导致缓慢流动和陈旧库存的拨备比例较低,但被(Iv)DTC销售与批发销售相比比例降低所部分抵消(DTC销售的利润率高于批发销售,占截至2022年12月31日的年度总销售额的61.5%,而截至12月31日的年度为65.9%,2021年)由于新冠肺炎相关限制的影响,导致大中国地区的某些DOS关闭。
截至2023年12月31日的年度的财务支出为6812.1欧元万,与截至2022年12月31日的年度的5434.6欧元万相比,增加了1377.5欧元万或+25.3%。财务支出增加的主要原因是:(1)由于2023年第一季行使和赎回权证,权证负债亏损2173.8欧元万(2023年亏损2290.9欧元万,2022年亏损117.1欧元万)(见附注28--其他流动和非流动金融负债(Ii)银行贷款利息和透支利息增加857.6万,以及(Iii)租赁负债利息和财务费用增加714.8万(包括与Tom Ford Fashion有关的5,632,000欧元),但因(Iv)重新计量Thom Browne非控制权益认沽期权负债的公允价值亏损1142.6欧元(2023年收益,而2022年亏损1142.6欧元万)而部分抵销,(V)本集团持有的证券亏损901.4欧元万,受金融市场表现的推动(2023年亏损441.2欧元万,而2022年亏损1342.6欧元万),以及(Vi)与对冲成本相关的496.5欧元万减少。
(ii)盈利能力的提高由以下因素推动:(a)与批发销售相比,DT销售的比例更高,(b)零售店生产力提高,包括商店合理规模的影响,(c)供应链中固定成本的吸收率更高,(d)价格上涨和季末销售减少,作为ZEGNA One Brand战略的一部分,和(e)与季节性系列相比,Essentials系列的销售比例更高,并且对缓慢流动和过时库存的拨备相应减少;
(ii)支付658万欧元收购Norda Run Inc. 25%权益(“Norda”),465.6万欧元,收购Luigi Fedeli e Figlio S.r.l. 15%的权益并向Filati Biagioli Modesto S.p.A.注资450万欧元。有关这些事务的更多信息,请参阅 注17 -使用权益法核算的投资 包含在本年度报告其他地方的合并财务报表中,表格20-F;
自2013年以来,他一直是意大利时装全国商会(Camera Nazionale della Moda Italiana)战略委员会成员和顾问,并一直是美国和意大利委员会的活跃成员。2011年,杰尼亚先生被意大利共和国总统提名为Cavaliere del Lavoro,并于2016年获得莱昂纳多奖,这是一个著名奖项,颁发给一位在全球范围内有意义地提升意大利形象的意大利领导人。
Ermenegildo Zegna di Monte Rubello先生和Anna Zegna di Monte Rubello女士是兄弟姐妹。
Paolo Zegna di Monte Rubello(非执行董事)
Paolo Zegna先生目前是董事会成员,并于2006年至2021年12月担任董事长。此前,他于1989年至1998年担任董事会成员,并于1998年至2006年担任联席首席执行官。
Paolo Zegna先生也是Ottubello董事会副主席和LanFisicio Ermenegildo Zegna e Figli S.p.A.董事会主席,Achill Station Pty Ltd.和Achill Land Pty Ltd.,也是Bonotto S.p.A.董事会成员,Gruppo Dondi S.p.A.和Elah Dufour S.p. A
2023年12月18日,根据忠诚度投票计划的条款,149,734,550股和5,246,800股特别投票股A分别转让给Ottubello和Ermenegildo(Gildo)Zegna di Monte Rubello。Thomubello通过持有公司已发行和发行普通股59.8%的股权(截至2024年3月23日),成为公司的控股股东。由于参与忠诚投票计划,Ottubello的投票权约为73.9%(截至2024年3月23日)。
(1)ubello是一家意大利semplice协会,其配额目前由杰尼亚家族成员持有。截至2023年12月31日,Ottubello的董事包括Ermenegildo Zegna di Monte Rubello(董事会主席)、Paolo Zegna di Monte Rubello(董事会副主席)、Anna Zegna di Monte Rubello、Angelo Zegna di Monte Rubello、Giovanni Schneider、Alessandro Andrea Trabaldo Togna、Franca Calcia和Riccardo Mulone。苏贝洛参与我们的忠诚度投票计划。
(5)Zegna先生参与我们的忠诚度投票计划。截至2024年3月23日,杰尼亚先生在杰尼亚的投票权约为3.1%。该百分比计算为(i)Ermenegildo Zegna di Monte Rubello实际拥有的普通股和Zegna特别投票权股份A的总数与(ii)截至2024年3月23日已发行和发行的250,310,263股普通股和154,981,350股Zegna特别投票权股份A的比率。
•作为本集团对Thom Browne Group和LanFisio投资的一部分而签订的看跌合同,本集团已被要求并且未来可能被要求购买Thom Browne Group和LanFisio剩余的全部或部分非控股权益。2021年7月,本集团以总代价960万欧元额外收购了Lanificio 10%的股份,随后本集团拥有Lanificio 100%的股份。2021年6月,集团以总代价3065.3万欧元额外收购了Thom Browne Group 5%的股份,随后集团拥有Thom Browne Group 90%的股份。有关Thom Browne看跌合约的更多信息,请参阅 附注28--其他流动和非流动金融负债合并财务报表。
Transactions with other related parties connected to directors and shareholders, including in connection with the Business Combination in 2021
127
•在集团风险管理活动过程中,与瑞银集团股份公司及其子公司(统称“瑞银集团股份公司”)就借款、循环信贷额度和集团持有的金融资产(主要是现金和现金等值项目以及其他证券)以及衍生品合同进行交易。UBS Group AG还代表集团向第三方提供某些财务担保。Sergio Ermotti先生于2023年4月5日被任命为瑞银集团首席执行官后,瑞银集团股份公司及其子公司有资格成为集团的关联方。
Pursuant to Dutch law and the Articles of Association, the Board or the General Meeting at the proposal of the Board will be allowed to resolve upon interim distributions on Ordinary Shares. For this purpose, the Board must prepare an interim statement of assets and liabilities. Such interim statement shall show our financial position not earlier than on the first day of the third month before the month in which the resolution to make the interim distribution is announced. An interim dividend can only be paid if (i) an interim statement of assets and liabilities is drawn up showing that the funds available for distribution are sufficient, and (ii) our shareholders’ equity exceeds the sum of the paid-up and called-up share capital and any reserves to be maintained by Dutch law or the Articles of Association. Interim distributions will be made in cash, in kind or in the form of Ordinary Shares.
Since Ermenegildo Zegna N.V. is a holding company and its operations are carried out through its subsidiaries, the Company’s ability to pay dividends will primarily depend on the ability of its subsidiaries to generate earnings and to provide it with the necessary financial resources.
The Special Voting Shares are not listed and are transferable only in very limited circumstances (including, among other things, transfers to certain affiliates or to relatives through succession, donation or other transfers, provided that the corresponding Ordinary Shares registered in the Loyalty Register are also transferred to such party, or transfers with the approval of the Board). In particular, no shareholder will be allowed to, directly or indirectly: (a) sell, dispose of, trade or transfer any Special Voting Shares or otherwise grant any right or interest in any Special Voting Share, other than as permitted pursuant to the Articles of Association or the Terms and Conditions of the Special Voting Shares; or (b) establish or permit to establish any pledge, lien, fixed or floating charge or other encumbrance over any Special Voting Share or any interest in any Special Voting Share.
The purpose of the loyalty voting structure is to grant long-term shareholders extra voting rights by means of granting Special Voting Shares, without entitling such shareholders to any economic rights, other than those pertaining to the Ordinary Shares. However, under Dutch law, the Special Voting Shares cannot be totally excluded from economic entitlements. As a result, pursuant to the Articles of Association, holders of Special Voting Shares will be entitled to a minimum dividend, which is allocated to separate special voting shares dividend reserves. Any distribution out of a special voting shares dividend reserve or the partial or full release of any such reserve will require a prior proposal from the Board and a resolution of the meeting of holders of the relevant class of Special Voting Shares, and will be made exclusively to the holders of the relevant class of Special Voting Shares in proportion to the aggregate nominal value of the relevant class of their Special Voting Shares. The powers to vote upon the distribution from the special voting shares dividend reserve and the cancellation of all issued Special Voting Shares of a specific class are the only powers that are granted to the meeting of holders of Special Voting Shares of the relevant class pursuant to Articles of Association.
The Board is allowed to amend the Terms and Conditions of the Special Voting Shares, provided, however, that any material, not merely technical amendment will be subject to approval of the General Meeting, unless such amendment is required to ensure compliance with applicable laws and or stock exchange rules.
根据《荷兰民法典》第2:92A条,股东如自行持有本公司至少95%的已发行及已发行股本,可向其他股东提起诉讼,要求将其股份转让予申索人。诉讼程序在荷兰企业商会(Ondernemingskamer),并可按照《荷兰民事诉讼法典》的规定,以传票方式向每名小股东提起诉讼(Wetboek van Burgerlijke Rechtsvording)。荷兰企业商会可批准对所有少数股东的排挤请求,并将在必要时在任命一至三名专家(S)后确定为股份支付的价格,专家将就少数股东的股份支付价值向荷兰企业商会提出意见。一旦转让令在荷兰企业商会获得最终通过,收购股份的人必须将付款日期、地点和价格以书面形式通知被收购股份的持有人,而这些持有人的地址是他或她知道的。除非收购人知道所有收购人的地址,否则收购人必须在荷兰国家日报上公布。
对荷兰缔结的避免双重征税条约的任何提及均包括荷兰王国税收法规(Belastingregeling voor het Koninkrijk)、荷兰州税收法规(Belastingregeling voor het land荷兰)、荷兰和Curacao税收法规(贝拉廷雷林荷兰Curaçao)、荷兰和圣马丁税收法规(贝拉廷雷格林荷兰圣马丁岛)以及台北驻荷兰代表处与荷兰驻台北贸易投资办事处之间关于避免双重征税的协议。
根据荷兰国内法,根据荷兰法律成立的公司实体的股份和/或认购证持有人通常需要缴纳荷兰股息预扣税,税率为15%,根据1965年《荷兰股息预扣税法》(Wet op de dividendbelasting 1965)(“DWTA”)分配的股息。在特定条件下,根据荷兰法律注册成立的公司实体的股份和/或期权持有人还可能因荷兰预扣税而预扣税或扣除,税率为25.8%(Wet bronbelasting 2021;“WTA 2021”)。
合作伙伴关系(意大利语“società in nome collettivo”、“società in accomandita semplice”、“società semplici”以及CITA第5条中提到的类似意大利合作伙伴关系)
意大利不会对向意大利商业合作伙伴(例如意大利)支付的股息在源头上预扣任何意大利税 società in nome collettivo,società in accomandita semplice 以及CITA第5条中提到的类似合作伙伴关系)。只有58.14%的股息包含在业务合作伙伴报告的总体业务收入中。
正如《管理层关于财务报告内部控制的年度报告》所述,管理层将Tom Ford International LLC及其子公司(于2023年4月28日收购)的财务报告内部控制排除在其评估之外,其财务报表占本集团截至2023年12月31日及截至2023年12月31日止年度合并总资产和收入的15.7%和12.4%。因此,我们的审计不包括Tom Ford International LLC及其子公司对财务报告的内部控制。
•Audit fees are the aggregate fees charged by the Deloitte Entities for the audit of our annual consolidated financial statements, the review of our interim consolidated financial statements and attestation services that are provided in connection with statutory and regulatory filings or engagements.
•Audit-related fees are the aggregate fees charged by the Deloitte Entities for assurance and related services that are reasonably related to the performance of the audit or review of our financial statements and are not reported under “Audit Fees.” This category comprises fees for agreed upon procedures engagements and other attestation services subject to regulatory requirements.
•Tax fees are the aggregate fees charged by the Deloitte Entities for services related to tax compliance, tax advice and tax planning.
•All other fees are the aggregate fees charged by the Deloitte Entities for non-audit services rendered which are not listed above.
Audit Committee’s pre-approval policies and procedures
Our Audit Committee makes recommendations for the appointment, compensation and retention of our independent registered public accounting firm entrusted with the audit of our consolidated financial statements. Our Audit Committee has adopted a policy requiring management to obtain the Audit Committee’s approval before engaging our independent registered public accounting firm to provide any other audit or permitted non-audit services to us or our subsidiaries. Pursuant to this policy, which is designed to ensure that such engagements do not impair the independence of our independent registered public accounting firm, the Audit Committee reviews and pre-approves(if appropriate) specific audit and non-audit services in the categories Audit Services, Audit-Related Services, Tax Services, and any other services that may be performed by our independent registered public accounting firm.
ITEM 16D EXEMPTIONS FROM THE LISTING STANDARDS FOR AUDIT COMMITTEES
None.
ITEM 16E PURCHASES OF EQUITY SECURITIES BY THE ISSUER AND AFFILIATED PURCHASERS
176
During the year ended December 31, 2023, no purchases of our equity securities registered pursuant to Section 12 of the Exchange Act were made by or on behalf of us or any affiliated purchaser.
ITEM 16F CHANGE IN REGISTRANT’S CERTIFYING ACCOUNTANT
Not Applicable.
ITEM 16G CORPORATE GOVERNANCE
The discussion below summarizes the significant differences between our corporate governance practices and the NYSE listing standards applicable to U.S. companies. The DCGC is based on a “comply or explain” principle, then for a discussion regarding certain ways in which our governance practices deviate from those suggested in the DCGC, please see “Item 10.B—Memorandum and Articles of Association—Certain Disclosure and Reporting Obligations of the Company.”
•NYSE listing standards generally require a majority of board members to be “independent” as determined under the NYSE listing standards. While the DCGC, in principle, requires that a majority of non-executive directors be “independent,” the definition of “independent” under the DCGC differs in its details from the corresponding definition of “independent” under the NYSE listing standards. In some cases, DCGC requirements are stricter; in other cases, the NYSE listing standards are stricter. Currently, a majority of the members of the Board are independent under the NYSE listing standards (7 out of 11 members); 5 out of the 10 non-executive directors of the Board are independent under the DCGC.
•NYSE listing standards require that when an audit committee member of a U.S. domestic listed company serves on four or more audit committees of public companies, the listed company should disclose (either on its website or in its annual proxy statement or annual report filed with the SEC) that the board of directors has determined that this simultaneous service would not impair the director’s service to the listed company. Dutch law does not require the Company to make such a determination.
•NYSE listing standards applicable to U.S. companies require that external auditors be appointed by the audit committee. The general rule under Dutch law is that external auditors are appointed by the General Meeting. In accordance with the requirements of Dutch law, the appointment and removal of our independent registered public accounting firm must be resolved upon at a General Meeting. Our Audit Committee is responsible for determining the process for selecting and determining the remuneration of the independent registered public accounting firm and oversees and evaluates the work of our independent registered public accounting firm.
•NYSE listing standards require a U.S. listed company to have a compensation committee and a nominating/corporate governance committee composed entirely of independent directors. As a foreign private issuer, we do not have to comply with this requirement, although we do have a Compensation Committee and a Governance and Sustainability Committee. The charter of our Compensation Committee states that more than half of the members of the Compensation Committee (including the chairperson) are independent under the DCGC. Currently, two out of three members of our Compensation Committee are independent both under the DCGC and under the NYSE listing standards. The charter of our Governance and Sustainability Committee states that more than half of the members of the Governance and Sustainability Committee are independent under the DCGC. Currently all three members of our Governance and Sustainability Committee are independent both under the DCGC and under the NYSE listing standards.
•Under NYSE listing standards, shareholders of U.S. companies must be given the opportunity to vote on all equity compensation plans and material revisions to those plans, with limited exceptions set forth in the NYSE listing standards. As a foreign private issuer, we are permitted to follow our home country laws regarding shareholder approval of compensation plans. Under Dutch law such approval is only required in relation to members of the board of directors if the articles of association of a company (i.e., public limited liability company (naamloze vennootschap)) stipulate that a corporate body other than the general meeting is authorized to determine the remuneration of members of the board of directors. The adoption of sub-plans under an equity incentive plan that has been approved by the general meeting does not require separate approval of the company’s general meeting, provided, however, that such sub-plans are adopted within the framework and limits of the equity incentive plan as approved by the general meeting. Approval by the general meeting is also not required in respect of equity compensation plans for employees, provided, however, that (i) such employees are no members of the board of
During the year, management performed triggering event analyses for all CGUs for DOS and performed an impairment analysis for those CGUs for DOS where a trigger has been identified. Impairment is recognized when the carrying value of a CGU for DOS assets exceeds the recoverable amount.
For those CGUs for DOS where an impairment analysis is performed, in order to determine the recoverable amount, the Company estimated the DOS assets’ value in use by making significant estimates and assumptions related to, among others, future forecasted revenues and profits for each individual store and the determination of appropriate discount rates. Estimates and assumptions related to future cash flows are determined based on the approved management’s budget and forecast for a period of three years and an estimate of the long-term growth rate.
We identified impairment of DOS assets identified with triggering events as a critical audit matter because the estimate of future store cash flows to assess the recoverability of DOS assets required significant management judgment, primarily in relation to forecasting future revenues and profitability, as well as in relation to the determination of discount rates. Changes in these estimates could have a significant impact on the measurement of the recoverable amount, resulting in a possible adjustment to the impairment charge to be recorded. This area of management estimate required a high degree of auditor judgment and an increased extent of effort, including the need to involve our fair value specialists when performing audit procedures to evaluate the reasonableness of management’s judgments used in preparing these estimates.
How the Critical Audit Matter Was Addressed in the Audit
Our audit procedures related to management’s judgments regarding forecasting future revenues and profitability as well as in relation to the determination of the discount rates included the following:
•We evaluated management’s ability to accurately perform forecasts, including management’s basis and approach for considering the impacts of changes in market conditions and economic events, by:
–inquiring of the Company's executives to understand the business initiatives supporting the assumptions in the future revenues and profits;
–performing a retrospective analysis to assess management’s ability to accurately forecast by comparing actual results to management’s historical forecast; and
–comparing the forecasts to (1) historical revenue and operating results; (2) internal communications regarding the Company’s business plan and strategy; and (3) industry and market conditions.
•With the assistance of our fair value specialists, we evaluated the reasonableness of the discount rates by testing the source information underlying management’s determination of the discount rates and the mathematical accuracy of the calculations.
Other current and non-current financial liabilities – Thom Browne Group - Valuation of put option - Refer to Notes 3, 4, 10 and 28 to the financial statements
Critical Audit Matter Description
As at December 31, 2023, the Company has a put option to buy the remaining 10% of non-controlling interests in Thom Browne Inc. (“Thom Browne”), which is recognized as a financial liability of Euro 139 million, of which Euro 22 million recognized as current.
The valuation of current and non-current financial liabilities was based on management’s forecasts of Thom Browne’s future profitability and their selection of an appropriate discount rate.
Management accounts for the put option agreement recognizing a current and non-current financial liabilities for the Company’s estimated obligation under the option. The exercise price of the put option is dependent on a measure of the brand’s profitability at the exercise date.
F-3
Therefore, the Company’s fair value determination of the current and non-current financial liabilities required management to make significant estimates and assumptions related to forecasts of future revenues and profitability and to select an appropriate discount rate. Changes in above described assumptions could have a significant impact on the measurement of the current and non-current financial liabilities.
We identified the valuation of the put option as a critical audit matter, because of the significant judgments made by management to estimate discount rate, future revenues and profitability of the Thom Browne Group. This required a high degree of auditor judgment and an increased extent of effort, including the involvement of our fair value specialists, when performing audit procedures to evaluate the reasonableness of management’s estimates and assumptions related to discount rate, future revenue and profitability.
How the Critical Audit Matter Was Addressed in the Audit
Our procedures related to the valuation of the put option included the following, among others:
•We evaluated management’s ability to accurately forecast revenues and profit of the Thom Browne Group by comparing actual revenue and profitability to management’s historical forecasts.
•We evaluated management’s assumptions related to future revenues and profitability by:
–Inquiring of the Company's executives to understand the business initiatives supporting the assumptions in the future revenues and profitability, and
–Comparing the forecasts to the current and past performance of the Thom Browne Group and to external market and industry data.
•With the assistance of our fair value specialists, we evaluated the reasonableness of the discount rate by testing the source information underlying management’s determination of the discount rate and the mathematical accuracy of the calculations.
Intangible assets – Fair value determination of intangible asset for Tom Ford license agreement – Refer to Notes 14 and 39 to the financial statements
Critical Audit Matter Description
On April 28, 2023, the Company completed the acquisition of Tom Ford International (“TFI”), the Company that owns and operates the Tom Ford Fashion business. As part of a transaction, sole ownership of the Tom Ford brand, its trademarks, and other intellectual property rights were acquired by The Estee Lauder Companies Inc. (“ELC”), and the Company has become a long-term licensee of ELC for some Tom Ford products. The Company accounted for the acquisition under the acquisition method of accounting for business combinations. Accordingly, the purchase price was allocated to the assets acquired and liabilities assumed based on their respective fair values, including an intangible asset for the license agreement for Euro 99 million. Management estimated the fair value of the license using the multi-period excess earnings method. The fair value determination of the license required management to make significant estimates and assumptions related to future revenues and profitability and the discount rate used.
We identified the valuation of the intangible asset for the Tom Ford license agreement as a critical audit matter because of the significant estimates and assumptions management makes to fair value the license agreement. This required a high degree of auditor judgment and an increased extent of effort, including the need to involve our fair value specialists, when performing audit procedures to evaluate the reasonableness of management’s forecasts revenues, profitability and the discount rate.
How the Critical Audit Matter Was Addressed in the Audit
Our audit procedures related to the forecasts of future revenues, future profitability and the discount rate used for the determination of the fair value of the Tom Ford license agreement included the following, among others:
•We evaluated the terms of the relevant contractual documents, including purchase and sale agreements and license agreement, as well as other documents including board of directors’ minutes, to understand and evaluate the business purpose and the critical terms, rights and obligations associated with the transactions.
•With the assistance of our technical accounting specialist we evaluated the Company's technical accounting analysis regarding the accounting treatment for minimum annual guaranteed royalties that the Company will pay to ELC based on the applicable accounting guidance.
•We assessed the reasonableness of management’s forecasts of future revenues and future profitability by comparing the forecasts to industry comparatives and own accumulated industry knowledge.
F-4
•With the assistance of our fair value specialists, we evaluated the reasonableness of the discount rate applied including:
◦the comparison between the discount rate used and the implied risk in the cash flow used for the license valuation, and
◦the mathematical accuracy of the calculation.
/s/ Deloitte & Touche S.p.A.
Turin, Italy
April 5, 2024
We have served as the Company's auditor since 1995.
F-5
Ermenegildo Zegna N.V.
CONSOLIDATED STATEMENT OF PROFIT AND LOSS
for the years ended December 31, 2023, 2022 and 2021
For the years ended December 31,
(€ thousands, except per share data)
Notes
2023
2022(*)
2021(*)
Revenues
6
1,904,549
1,492,840
1,292,402
Cost of sales
7
(680,235)
(564,832)
(495,702)
Gross profit
1,224,314
928,008
796,700
Selling, general and administrative expenses
8
(901,364)
(695,084)
(822,897)
Marketing expenses
9
(114,802)
(85,147)
(67,831)
Operating profit/(loss)
208,148
147,777
(94,028)
Financial income
10
37,282
13,320
45,889
Financial expenses
10
(68,121)
(54,346)
(43,823)
Foreign exchange losses
10
(5,262)
(7,869)
(7,791)
Result from investments accounted for using the equity method
17
(2,953)
2,199
2,794
Profit/(Loss) before taxes
169,094
101,081
(96,959)
Income taxes
11
(33,433)
(35,802)
(30,702)
Profit/(Loss)
135,661
65,279
(127,661)
Attributable to:
Shareholders of the Parent Company
121,529
51,482
(136,001)
Non-controlling interests
14,132
13,797
8,340
Basic earnings per share in €
12
0.49
0.22
(0.67)
Diluted earnings per share in €
12
0.48
0.21
(0.67)
_________________
(*) Starting with the year ended December 31, 2023, the Group presents the consolidated statement of profit and loss by function, which is most representative of the way the Chief Operating Decision Maker and management view the business, and therefore it provides reliable and more relevant information and is consistent with international practice. In order to conform to this new presentation, the information for the year ended December 31, 2022 and 2021 have been reclassified compared to what was previously presented by the Group.
The accompanying notes are an integral part of these Consolidated Financial Statements
F-6
Ermenegildo Zegna N.V.
CONSOLIDATED STATEMENT OF COMPREHENSIVE INCOME AND LOSS
for the years ended December 31, 2023, 2022 and 2021
For the years ended December 31,
(€ thousands)
Notes
2023
2022
2021
Profit/(Loss)
135,661
65,279
(127,661)
Other comprehensive (loss)/income, net of tax:
Items that will be subsequently reclassified to the statement of profit and loss:
Foreign currency exchange differences arising from the translation of foreign operations(*)
(15,887)
10,098
40,324
Net (loss)/gain from cash flow hedges
(7,553)
21,744
(6,344)
Net gain/(loss) from financial instruments measured at fair value
635
(1,482)
444
Items that will not be subsequently reclassified to the statement of profit and loss:
Net actuarial gain/(loss) from defined benefit plans
1,025
1,092
(397)
Total other comprehensive (loss)/income, net of tax
25
(21,780)
31,452
34,027
Total comprehensive income/(loss)
113,881
96,731
(93,634)
Attributable to:
Shareholders of the Parent Company
100,583
82,908
(102,106)
Non-controlling interests
13,298
13,823
8,472
_________________
(*) As a result of the acquisition of Tom Ford International in April 2023, cumulative translation losses amounting to €4,705 thousand related to the original investment held in Tom Ford International were reclassified from other comprehensive income and loss to foreign exchange losses within the consolidated statement of profit and loss for the year ended December 31, 2023. For additional information relating to the acquisition of Tom Ford International see Note 1 — General information, Note 17 — Investments accounted for using the equity method and Note 39 — Business combinations.
The accompanying notes are an integral part of these Consolidated Financial Statements.
F-7
Ermenegildo Zegna N.V.
CONSOLIDATED STATEMENT OF FINANCIAL POSITION
at December 31, 2023 and 2022
At December 31,
(€ thousands)
Notes
2023
2022
Assets
Non-current assets
Intangible assets
14
572,274
455,908
Property, plant and equipment
15
159,608
126,139
Right-of-use assets
16
533,952
375,508
Investments accounted for using the equity method
17
18,765
22,648
Deferred tax assets
11
160,878
124,627
Other non-current financial assets
18
33,898
36,240
Total non-current assets
1,479,375
1,141,070
Current assets
Inventories
19
522,589
410,851
Trade receivables
20
240,457
177,213
Derivative financial instruments
21
11,110
22,454
Tax receivables
31,024
15,350
Other current financial assets
22
90,917
320,894
Other current assets
23
95,260
84,574
Cash and cash equivalents
24
296,279
254,321
Total current assets
1,287,636
1,285,657
Total assets
2,767,011
2,426,727
Liabilities and Equity
Equity attributable to shareholders of the Parent Company
840,294
678,949
Equity attributable to non-controlling interests
26
60,602
53,372
Total equity
900,896
732,321
Non-current liabilities
Non-current borrowings
27
113,285
184,880
Other non-current financial liabilities
28
136,556
178,793
Non-current lease liabilities
29
471,083
332,050
Non-current provisions for risks and charges
30
19,849
19,581
Employee benefits
31
29,645
51,584
Deferred tax liabilities
11
73,885
60,534
Other non-current liabilities
33
9,689
—
Total non-current liabilities
853,992
827,422
Current liabilities
Current borrowings
27
289,337
286,175
Other current financial liabilities
28
22,102
37,258
Current lease liabilities
29
122,642
111,457
Derivative financial instruments
21
897
2,362
Current provisions for risks and charges
30
16,019
13,969
Trade payables and customer advances
32
314,137
270,936
Tax liabilities
41,976
25,999
Other current liabilities
33
205,013
118,828
Total current liabilities
1,012,123
866,984
Total equity and liabilities
2,767,011
2,426,727
The accompanying notes are an integral part of these Consolidated Financial Statements.
F-8
Ermenegildo Zegna N.V.
CONSOLIDATED CASH FLOW STATEMENT
for the years ended December 31, 2023, 2022 and 2021
For the years ended December 31,
(€ thousands)
Notes
2023
2022
2021
Operating activities
Profit/(Loss)
135,661
65,279
(127,661)
Income taxes
11
33,433
35,802
30,702
Depreciation, amortization and impairment of assets
13
194,952
173,521
163,367
Financial income
10
(37,282)
(13,320)
(45,889)
Financial expenses
10
68,121
54,346
43,823
Foreign exchange losses
10
5,262
7,869
7,791
Write downs and other provisions
(1,168)
14
19,487
Write downs of the provision for obsolete inventory
19
31,850
28,561
29,600
Result from investments accounted for using the equity method
17
2,953
(2,199)
(2,794)
(Gains)/Losses arising from the disposal of fixed assets
—
(1,124)
1,153
Other non-cash expenses, net
38
66,641
23,063
230,812
Change in inventories
(72,770)
(103,112)
(27,554)
Change in trade receivables
(51,022)
(15,623)
(12,294)
Change in trade payables including customer advances
11,670
43,511
31,426
Change in current and non-current provisions for risks and charges
(6,720)
(29,102)
(5,498)
Change in employee benefits
(2,566)
(8,676)
(13,456)
Change in other operating assets and liabilities
(20,479)
(38,216)
38,927
Interest paid
(29,166)
(24,938)
(17,487)
Income taxes paid
(53,988)
(49,258)
(63,300)
Net cash flows from operating activities
275,382
146,398
281,155
Investing activities
Payments for property, plant and equipment
(57,034)
(49,114)
(79,699)
Proceeds from disposals of property, plant and equipment
—
—
3,791
Payments for intangible assets
(20,843)
(24,185)
(14,627)
Proceeds from disposals of non-current financial assets
2,345
2,585
1,536
Payments for purchases of non-current financial assets
(2,623)
(111)
(4,431)
Proceeds from disposals of current financial assets and derivative instruments
22
270,317
46,487
92,021
Payments for acquisitions of current financial assets and derivative instruments
(36,956)
(32,412)
(76,058)
Business combinations, net of cash acquired
39
(117,686)
(585)
(4,224)
Acquisition of investments accounted for using the equity method
17
(15,734)
—
(313)
Net cash flows from/(used in) investing activities
21,786
(57,335)
(82,004)
Financing activities
Proceeds from borrowings
27
204,424
—
123,570
Repayments of borrowings
27
(306,150)
(159,719)
(160,210)
Repayments of other non-current financial liabilities
28
—
(3,919)
(4,287)
Payments of lease liabilities
29
(125,732)
(121,633)
(100,611)
Proceeds from the exercise of warrants
28
4,409
—
—
Proceeds from capital contribution from Monterubello
25
—
10,923
—
Sales of shares held in treasury
25
3,654
3,390
6,343
Purchase of own shares
—
—
(384)
Dividends to owners of the parent
(25,031)
(21,852)
(102)
Dividends paid to non-controlling interests
(6,068)
(4,187)
(548)
Purchase of own shares from Monterubello
1
—
—
(455,000)
Proceeds from issuance of ordinary shares upon Business Combination
1
—
—
310,739
Proceeds from issuance of ordinary shares to PIPE Investors
1
—
—
331,385
Payments of transaction costs related to the Business Combination
1
—
—
(48,475)
Cash distributed as part of the Disposition
—
—
(26,272)
Payments for acquisition of non-controlling interests
—
—
(40,253)
Net cash flows used in financing activities
(250,494)
(296,997)
(64,105)
Effects of exchange rate changes on cash and cash equivalents
(4,716)
2,464
7,454
Net increase/(decrease) in cash and cash equivalents
41,958
(205,470)
142,500
Cash and cash equivalents at the beginning of the year
24
254,321
459,791
317,291
Cash and cash equivalents at the end of the year
24
296,279
254,321
459,791
The accompanying notes are an integral part of these Consolidated Financial Statements.
F-9
Ermenegildo Zegna N.V.
CONSOLIDATED STATEMENT OF CHANGES IN EQUITY
for the years ended December 31, 2023, 2022 and 2021
Legal reserves
(€ thousands)
Share capital
Share premium
Currency translation difference
Cash flow hedge reserve
Reserve for remeasurement of defined benefit plans
Financial assets at FVOCI reserve
Other legal reserves
Reserve for treasury shares
Other reserves
Retained earnings
Total equity attributable to shareholders of the Parent Company
Total equity attributable to non-controlling interests
Total equity
At January 1, 2021(*)
4,300
—
(24,660)
(2,225)
741
243
—
(76,624)
(193,247)
893,236
601,764
43,270
645,034
(Loss)/Profit
—
—
—
—
—
—
—
—
—
(136,001)
(136,001)
8,340
(127,661)
Other comprehensive income/(loss)
—
—
40,197
(6,316)
(430)
444
—
—
—
—
33,895
132
34,027
Total comprehensive income
—
—
40,197
(6,316)
(430)
444
—
—
—
(136,001)
(102,106)
8,472
(93,634)
Legal reserves
—
—
—
—
—
—
20,351
—
(21,211)
860
—
—
—
Dividends
—
—
—
—
—
—
—
—
(102)
—
(102)
(548)
(650)
Capital increase related to the Business Combination
1,639
710,264
—
—
—
—
—
—
—
—
711,903
—
711,903
Purchase of own shares from Monterubello
—
—
—
—
—
—
—
(455,000)
—
—
(455,000)
—
(455,000)
Capital contribution from Monterubello
—
10,923
—
—
—
—
—
—
—
—
10,923
—
10,923
Issuance of shares held in treasury
—
—
—
—
—
—
—
76,624
(70,665)
—
5,959
—
5,959
Assignment of treasury shares
—
—
—
—
—
—
—
—
31,823
(31,823)
—
—
—
Acquisition of non-controlling interests
—
—
—
—
—
—
—
—
—
8,365
8,365
(8,365)
—
Acquisition of Ubertino
—
—
—
—
—
—
—
—
—
—
—
2,854
2,854
Share-based payments
—
—
—
—
—
—
—
—
74,978
—
74,978
—
74,978
Disposition
—
—
(20,465)
176
—
—
—
—
—
(235,185)
(255,474)
(2,589)
(258,063)
At December 31, 2021(*)
5,939
721,187
(4,928)
(8,365)
311
687
20,351
(455,000)
(178,424)
499,452
601,210
43,094
644,304
Profit
—
—
—
—
—
—
—
—
—
51,482
51,482
13,797
65,279
Other comprehensive income/(loss)
—
—
10,223
21,744
941
(1,482)
—
—
—
—
31,426
26
31,452
Total comprehensive income
—
—
10,223
21,744
941
(1,482)
—
—
—
51,482
82,908
13,823
96,731
Legal reserves
—
—
—
—
—
—
4,927
—
(4,927)
—
—
—
—
Dividends
—
—
—
—
—
—
—
—
—
(21,852)
(21,852)
(4,187)
(26,039)
Sale of treasury shares, net
—
—
—
—
—
—
—
3,826
—
—
3,826
—
3,826
Share-based payments
—
—
—
—
—
—
—
—
13,579
—
13,579
—
13,579
Other changes
—
—
—
—
—
—
—
—
40
(762)
(722)
642
(80)
At December 31, 2022(*)
5,939
721,187
5,295
13,379
1,252
(795)
25,278
(451,174)
(169,732)
528,320
678,949
53,372
732,321
Profit
—
—
—
—
—
—
—
—
—
121,529
121,529
14,132
135,661
Other comprehensive income/(loss)
—
—
(15,151)
(7,553)
1,123
635
—
—
—
—
(20,946)
(834)
(21,780)
Total comprehensive income
—
—
(15,151)
(7,553)
1,123
635
—
—
—
121,529
100,583
13,298
113,881
Legal reserves
—
—
—
—
—
—
(3,145)
—
3,145
—
—
—
—
Dividends
—
—
—
—
—
—
—
—
—
(25,031)
(25,031)
(6,068)
(31,099)
Sale of treasury shares, net
—
—
—
—
—
—
—
3,902
(248)
—
3,654
—
3,654
Exercise of warrants
115
64,500
—
—
—
—
—
—
(1,236)
—
63,379
—
63,379
Issuance of Special Voting Shares A
3,100
(3,100)
—
—
—
—
—
—
—
—
—
—
—
Share-based payments
—
—
—
—
—
—
—
—
19,780
—
19,780
—
19,780
Settlement of share-based payments
—
—
—
—
—
—
—
10,650
(11,093)
443
—
—
—
Other changes
—
—
—
—
—
—
—
—
5,388
(6,408)
(1,020)
—
(1,020)
At December 31, 2023
9,154
782,587
(9,856)
5,826
2,375
(160)
22,133
(436,622)
(153,996)
618,853
840,294
60,602
900,896
(*) Starting with the Semi-Annual Condensed Consolidated Financial Statements at June 30, 2023 and for the six months ended June 30, 2023 and 2022, in the consolidated statement of changes in equity the Group separately presents certain components of equity, including share premium, the reserve for treasury shares and other legal reserves, which were previously presented within other reserves. Management believes this presentation, together with the accompanying notes, facilitate a better understanding of the underlying components of the Group’s equity. As a result of this new presentation, certain comparative period amounts above have been reclassified compared to the amounts presented in the Group’s 2022 consolidated financial statements.
The accompanying notes are an integral part of these Consolidated Financial Statements.
F-10
Ermenegildo Zegna N.V.
NOTES TO THE CONSOLIDATED FINANCIAL STATEMENTS
At December 31, 2023 and 2022 and for the years ended December 31, 2023, 2022 and 2021
1. General information
Ermenegildo Zegna N.V. (formerly known as Ermenegildo Zegna Holditalia S.p.A., and hereinafter referred to as the “Company” or the “Parent Company” and together with its consolidated subsidiaries, or any one or more of them, as the context may require, the “Ermenegildo Zegna Group” or the “Group”) is the holding company of the Group and is incorporated as a public company (naamloze vennootschap) under the laws of the Netherlands and its ordinary shares are listed on the New York Stock Exchange under the “ZGN” ticker. The Company is domiciled in Amsterdam, the Netherlands, and the Company’s registered office is Viale Roma 99/100, Valdilana (Biella), Italy.
Ermenegildo Zegna Group is a leading global luxury group, internationally recognized for the distinctive heritage of craftsmanship and design associated with the ZEGNA and Thom Browne brands and the noble fabrics and fibers of its in-house luxury textile and knitwear business. Since its foundation in 1910 through Lanificio Ermenegildo Zegna e Figli S.p.A. (“Lanificio”) in Valdilana (BI), Italy, the Group has expanded beyond luxury textile production to ready-to-wear products and accessories to become a highly recognized luxury lifestyle group. The Group designs, manufactures, markets and distributes luxury menswear, footwear, leather goods and other accessories under the ZEGNA and the Thom Browne brands, and luxury womenswear and childrenswear under the Thom Browne brand. The Group’s product range is complemented by eyewear, cufflinks and jewelry, watches, underwear and beachwear manufactured by third parties under licenses. In addition, following the completion of the acquisition of Tom Ford International (“TFI”) on April 28, 2023 (the “TFI Acquisition”), the Group has become a long-term licensee of the Estée Lauder Companies Inc. (“ELC”) for all TOM FORD men’s and women’s fashion as well as accessories and underwear, fine jewelry, childrenswear, textile, and home design products. For further information on the TFI Acquisition, see Note 39 — Business combinations. The Group’s business covers the entire value chain as a result of its design, manufacturing and distribution business and the Group has a significant international presence through the retail channel, consisting of directly operated single-brand stores (“Directly Operated Stores” or “DOS”) and online stores, as well as through the wholesale channel, represented by multi-brand stores, luxury department stores and major international airports.
Business Combination and other transactions in 2021
On December 17, 2021, the Group closed the previously announced business combination pursuant to a business combination agreement, dated as of July 18, 2021, as amended, by and among the Group, Investindustrial Acquisition Corp. (“IIAC”) and EZ Cayman, a wholly-owned subsidiary of the Group (“Zegna Merger Sub”), through a series of transactions as described below (the “Business Combination”).
Effective November 1, 2021, Ermenegildo Zegna Holditalia S.p.A. transferred its activities related to design and style, brand, marketing, planning, retail management, human resources, finance and accounting, legal, information technology and internal audit and compliance, and transferred 197 employees out of a total 212 employees to EZ Service S.r.l. (“EZ Service”), a limited liability company based in Italy that was incorporated on October 1, 2021 and is fully owned by Ermenegildo Zegna N.V. Subsequent to this transfer the Company’s activities are primarily limited to holding investments in the subsidiaries of the Group and conducting certain administrative, treasury, internal control and investor relations activities.
Also on November 1, 2021, Ermenegildo Zegna Holditalia S.p.A. completed the disposition of certain of its businesses (the “Disposition”), through the statutory demerger under Italian law to a new company owned by its existing shareholders. The Disposition included, inter alia, Ermenegildo Zegna Holditalia S.p.A.’s real estate business, consisting of its former subsidiary EZ Real Estate S.r.l. (“EZ Real Estate”), which directly and indirectly holds substantially all of the real estate assets formerly owned by the Group, as well as certain properties previously owned by Lanificio, and its 10% equity interest in Elah Dufour S.p.A. Most of the real estate properties directly or indirectly owned by EZ Real Estate were, and continue to be, leased to the Group also following the Disposition.
The following transactions related to the Business Combination were completed on December 17, 2021:
•Ermenegildo Zegna Holditalia S.p.A. implemented a cross-border conversion whereby it, by means of the execution of a Dutch notarial deed of cross-border conversion and amendment of its articles of association,
F-11
converted into a Dutch public limited liability company (naamloze vennootschap) and transferred its legal seat from Italy to the Netherlands and amended its articles of association, upon which the Company changed its name to Ermenegildo Zegna N.V. (the “Conversion”);
•In connection with the Conversion, the Company underwent a share split of 4,300,000 ordinary shares into 215,000,000 ordinary shares (the “Share Split”);
•Zegna Merger Sub merged with and into IIAC, with IIAC being the surviving entity in the merger (the “Merger”), as a result of which:
(a)each share of Zegna Merger Sub was converted into one IIAC ordinary share;
(b)a total number of 44,443,659 IIAC class A shares and class B shares were contributed to the Company in exchange for an equivalent number of the Company ordinary shares, representing a capital increase of €397.8 million measured based on the closing price of IIAC’s shares of $10.14 per share on December 17, 2021;
(c)13,416,637 outstanding IIAC public warrants were converted to an equivalent number of the Company public warrants representing a right to acquire one the Company ordinary share. The public warrants were measured at fair value by using the Euro equivalent of the closing price of IIAC warrants on December 17, 2021, amounting to a total of €20,723 thousand; and
(d)5,900,000 IIAC private placement warrants were exchanged for an equivalent number of the Company private placement warrants representing a right to acquire one the Company ordinary share, while the remaining 800,000 IIAC private placement warrants were transferred by Strategic Holding Group S.à r.l. to the Ermenegildo Zegna Group and the Company issued a corresponding number of private placement warrants to certain of its directors. The private placement warrants were measured at fair value using a Monte Carlo simulation model, amounting to a total of €10,349 thousand;
(e)The issuance of 5,031,250 the Company ordinary shares to the holders of IIAC class B shares to be held in escrow. The release of these shares from escrow is subject to achievement of certain targets within a seven-year period (“Escrow Shares”). The Escrow Shares were measured in accordance with IFRS 2 - Share-Based Payment (“IFRS 2”) using a Monte Carlo simulation model, amounting to a total of €37,906 thousand;
•Pursuant to certain agreements between the Group and IIAC, the private investment in public equity investors (“PIPE Investors”) subscribed to an aggregate of 37,500,000 the Company ordinary shares for an aggregate purchase price of €331.4 million;
•The Company repurchased 54,600,000 of its ordinary shares from the Group’s controlling shareholder, Monterubello s.s. (hereinafter “Monterubello”), in exchange for consideration of €455.0 million.
•Transaction costs incurred by the Group in relation to the Business Combination amounted to €51.4 million (€2.9 million of which were paid in 2022), of which €17.3 million were recognized directly within equity and €34.1 million were recognized in the consolidated statement of profit and loss for the year ended December 31, 2021.
The following table shows a breakdown of the net cash proceeds in 2021 from the Business Combination:
(€ thousands)
Proceeds from issuance of Ordinary Shares upon Business Combination
310,739
Proceeds from issuance of Ordinary Shares to PIPE Investors
331,385
Purchase of own shares from Monterubello
(455,000)
Payments of transaction costs related to the Business Combination
(48,475)
Net cash proceeds from the Business Combination
138,649
F-12
Following the completion of the Business Combination, on December 20, 2021, the Company’s ordinary shares and public warrants began trading on the New York Stock Exchange (“NYSE”) under the symbols “ZGN” and “ZGN WS,” respectively.
Accounting for the Business Combination
The Business Combination between the Group and IIAC was accounted for as a capital reorganization in accordance with International Financial Reporting Standards. For accounting purposes, the Business Combination was treated as the equivalent of the Company issuing shares for the net assets of IIAC, which were stated at historical cost, with no goodwill or other intangible assets recorded.
It has been determined that IIAC does not meet the definition of a “business” pursuant to IFRS 3 — Business Combinations (“IFRS 3”), hence the transaction is accounted for within the scope of IFRS 2. In accordance with IFRS 2, the difference in the fair value of the Group’s equity instruments deemed issued to IIAC shareholders (measured based on the closing price of IIAC’s shares of $10.14 per share on December 17, 2021) over the fair value of identifiable net assets of IIAC represents a service for listing amounting to €114,963 thousand and was accounted for as a share-based payment expensed as incurred.
2. Basis of preparation
Statement of compliance with IFRS
These consolidated financial statements of Ermenegildo Zegna N.V. have been prepared in compliance with the International Financial Reporting Standards (“IFRS”) as issued by the International Accounting Standards Board (“IASB”), as well as IFRS as adopted by the European Union. There is no effect on these consolidated financial statements resulting from differences between IFRS as issued by the IASB and IFRS as adopted by the European Union.
These consolidated financial statements were approved and authorized for issue by the Board of Directors of Ermenegildo Zegna N.V. on April 4, 2024.
Contents and structure of the Consolidated Financial Statements
The consolidated financial statements include the consolidated statement of profit and loss, the consolidated statement of comprehensive income and loss, the consolidated statement of financial position, the consolidated cash flow statement, the consolidated statement of changes in equity and the accompanying notes (collectively referred to as the “Consolidated Financial Statements”).
The financial reporting formats presented by the Group have the following characteristics:
•starting in 2023, the Group presents the consolidated statement of profit and loss by function, which is most representative of the way the Chief Operating Decision Maker and management view the business, and therefore it provides reliable and more relevant information and is consistent with international practice. In order to conform to this new presentation, the information for the year ended December 31, 2022 and 2021 has been reclassified compared to what was previously presented by the Group;
•the consolidated statement of comprehensive income and loss is presented as a separate statement and, in addition to presenting the components of profit and loss recognized directly in the consolidated statement of profit and loss during the period, presents the components of profit and loss not recognized in profit or loss as required or permitted by IFRS;
•the consolidated statement of financial position presents assets and liabilities by current and non-current items. Current items are those expected to be realized within 12 months from the reporting date or to be sold or consumed in the normal operating cycle of the Group;
•the consolidated cash flow statement has been prepared using the “indirect method,” as permitted by IAS 7 — Statement of Cash Flows (“IAS 7”), and presents cash flows by operating, investing and financing activities;
F-13
•the consolidated statement of changes in equity presents the movements in shareholder’s equity. Starting in 2023, in the consolidated statement of changes in equity the Group separately presents certain components of equity, including share premium, the reserve for treasury shares and other legal reserves, which were previously presented within other reserves. Management believes this presentation, together with the accompanying notes, facilitate a better understanding of the underlying components of the Group’s equity. As a result of this new presentation, certain amounts presented for periods prior to the year ended December 31, 2023 within these Consolidated Financial Statements have been reclassified compared to amounts previously presented by the Group;
•the notes to the consolidated financial statements comprise a summary of the material accounting policy information and other explanatory information. In order to conform the note to the consolidated financial statements with the new presentation of the consolidated statement of profit and loss by function, the explanatory information for the year ended December 31, 2022 and 2021 has been modified compared to what was previously presented by the Group.
The Consolidated Financial Statements are presented in Euro, which is the functional and presentation currency of the Company, and amounts are stated in thousands of Euros, unless otherwise indicated.
The Consolidated Financial Statements have been prepared on a going concern basis and applying the historical cost method, modified as required for certain financial assets and liabilities (including derivative instruments), which are measured at fair value, as further described in the accounting policy information below. Income and expenses are accounted for on an accrual basis.
3. Summary of material accounting policy information
New standards and amendments effective from January 1, 2023
In May 2017, the IASB issued IFRS 17 — Insurance Contracts, which establishes principles for the recognition, measurement, presentation and disclosure of insurance contracts issued as well as guidance relating to reinsurance contracts held and investment contracts with discretionary participation features issued. In June 2020 the IASB issued amendments to IFRS 17 aimed at helping companies implement IFRS 17 and make it easier for companies to explain their financial performance. The new standard and amendments are effective on or after January 1, 2023. There was no effect from the adoption of these amendments.
In February 2021, the IASB issued amendments to IAS 1 — Presentation of Financial Statementsand IFRS Practice Statement 2: Disclosure of Accounting Policies which require companies to disclose their material accounting policy information rather than their significant accounting policies and provide guidance on how to apply the concept of materiality to accounting policy disclosures. These amendments are effective on or after January 1, 2023. Certain accounting policy disclosures were updated a result of the adoption of these amendments.
In February 2021, the IASB issued amendments to IAS 8 — Accounting Policies, Changes in Accounting Estimates and Errors: Definition of Accounting Estimates which clarify how companies should distinguish changes in accounting policies from changes in accounting estimates. These amendments are effective on or after January 1, 2023. There was no effect from the adoption of these amendments.
In May 2021, the IASB issued amendments to IAS 12 — Income Taxes: Deferred Tax related to Assets and Liabilities Arising From a Single Transaction that clarify how companies account for deferred tax on transactions such as leases and decommissioning obligations. These amendments are effective on or after January 1, 2023. There was no effect from the adoption of these amendments. As a result of adopting the amendments the Group recognizes deferred taxes arising from lease accounting on a gross basis.
In December 2021, the IASB issued an amendments to IFRS 17 — Insurance Contracts: Initial Application of IFRS 17 and IFRS 9 - Comparative Information, which provides a transition option relating to comparative information about financial assets presented on initial application of IFRS 17. The amendment is aimed at helping entities to avoid temporary accounting mismatches between financial assets and insurance contract liabilities, and therefore improve the usefulness of
F-14
comparative information for users of financial statements. The amendment is effective on or after January 1, 2023. There was no effect from the adoption of these amendments.
In May 2023, the IASB issued amendments to IAS 12 — Income taxes: International Tax Reform – Pillar Two Model Rules, to clarify the application of IAS 12 — Income taxes to income taxes arising from tax law enacted or substantively enacted to implement the Organisation for Economic Co-operation and Development (OECD)/G20 Inclusive Framework on Base Erosion and Profit Shifting (BEPS) Pillar Two model rules (Pillar Two income taxes). The amendments introduce: (i) a mandatory temporary exception for the recognition of and disclosure relating to deferred tax assets and liabilities arising from the jurisdictional implementation of the Pillar Two model rules, which was effective immediately upon issuance of the amendment and which the Group applied from that date, and (ii) disclosure requirements for affected entities to help users of the financial statements better understand an entity’s exposure to Pillar Two income taxes arising from that legislation, particularly before the effective date of the Pillar Two model rules, which apply for annual reporting periods beginning on or after January 1, 2023, but not for any interim periods ending on or before December 31, 2023. Please refer to Note 11 — Income taxes for additional information relating to Pillar Two model rules.
New standards, amendments and interpretations not yet effective
The standards, amendments and interpretations issued by the IASB that will have mandatory application in 2024 or subsequent years are listed below:
In January 2020, the IASB issued amendments to IAS 1 — Presentation of Financial Statements: Classification of Liabilities as Current or Non-Current to clarify how to classify debt and other liabilities as current or non-current, and in particular how to classify liabilities with an uncertain settlement date and liabilities that may be settled by converting to equity. These amendments are effective on or after January 1, 2024. The Group does not expect any material impact from the adoption of these amendments.
In September 2022, the IASB issued amendments to IFRS 16 — Leases: Liability in a Sale and Leaseback to improve the requirements for sale and leaseback transactions, which specify the measurement of the liability arising in a sale and leaseback transaction, to ensure the seller-lessee does not recognize any amount of the gain or loss that relates to the right of use it retains. These amendments are effective on or after January 1, 2024. The Group does not expect any material impact from the adoption of these amendments.
In October 2022, the IASB issued amendments to IAS 1 — Presentation of Financial Statements: Non-current Liabilities with Covenants, that clarify how conditions with which an entity must comply within twelve months after the reporting period affect the classification of a liability. These amendments are effective on or after January 1, 2024. The Group does not expect any material impact from the adoption of these amendments.
In May 2023, the IASB issued amendments to IAS 7 — Statement of Cash Flows and IFRS 7 — Financial Instruments: Disclosures: Supplier Finance Arrangements, that introduce new disclosure requirements to enhance the transparency and usefulness of the information provided by entities about supplier finance arrangements and are intended to assist users of financial statements in understanding the effects of supplier finance arrangements on an entity’s liabilities, cash flows and exposure to liquidity risk. The amendments are effective on or after January 1, 2024. The Group is evaluating the potential impact from the adoption of these amendments.
In August 2023, the IASB issued amendments to IAS 21 — The Effects of Changes in Foreign Exchange Rates: Lack of Exchangeability, to clarify how an entity has to apply a consistent approach to assessing whether a currency is exchangeable into another currency and, when it is not, to determine the exchange rate to use and the disclosures to provide. These amendments are effective on or after January 1, 2025. The Group is evaluating the potential impact from the adoption of these amendments.
F-15
Material accounting policy information
Basis of consolidation
Subsidiaries
Subsidiaries are entities over which the Group has control. Control is achieved when the Group has the power over the investee, it is exposed, or has rights to, variable returns from its involvement with the investee, and has the ability to use its power to affect its returns. Subsidiaries are consolidated on a line by line basis from the date on which the Group obtains control. The Group reassesses whether or not it controls an investee if facts and circumstances indicate that there are changes to one or more of the three elements of control listed above.
Subsidiaries are deconsolidated from the date when control ceases. When the Group ceases to have control over a subsidiary, it derecognizes the assets (including any goodwill) and liabilities of the subsidiaries at their carrying amounts, derecognizes the carrying amount of non-controlling interests in the former subsidiary and recognizes the fair value of any consideration received from the transaction. Any retained interest in the former subsidiary is then remeasured to its fair value.
The Group recognizes any non-controlling interests (“NCI”) in the acquiree on an acquisition-by-acquisition basis, either at fair value or at the non-controlling interests’ share of the acquiree’s identifiable net assets. Net profit or loss and each component of other comprehensive income/(loss) are attributed to the owners of the parent and to the non-controlling interests.
All intra-group balances and transactions and any unrealized gains and losses arising from intra-group transactions are eliminated in preparing the Consolidated Financial Statements.
Foreign currency transactions
The functional currency of the Group’s entities is the currency of their primary economic environment. Transactions in foreign currencies are recorded at the exchange rate prevailing at the date of the transaction. Monetary assets and liabilities denominated in foreign currencies at the balance sheet date are translated at the foreign currency exchange rate prevailing at that date. Exchange differences arising on the settlement of monetary items or on reporting monetary items at rates different from those at which they were initially recorded during the period or in previous financial statements are recognized in the consolidated statement of profit and loss.
Consolidation of foreign entities
Upon consolidation, all assets and liabilities of Group entities with a functional currency other than the Euro are translated using the closing rates at the date of the consolidated statement of financial position. Income and expenses are translated into Euro at the average foreign currency exchange rate for the period. Translation differences resulting from the application of this method are recognized within other comprehensive income/(loss) and accumulated in the currency translation reserve until the disposal of the investment, at which date the accumulated amount is reclassified to profit/(loss). Average foreign currency exchange rates for the period are used to translate the cash flows of foreign subsidiaries in preparing the consolidated statement of cash flows. Goodwill, assets acquired and liabilities assumed arising from the acquisition of entities with a functional currency other than the Euro are recognized in the Consolidated Financial Statements in the functional currency and translated at the foreign currency exchange rate at the acquisition date. These balances are translated at subsequent balance sheet dates at the relevant foreign currency exchange rate.
F-16
The following table presents the principal foreign currency exchange rates used by the Group to translate other currencies into Euro:
2023
2022
2021
At December 31,
Average
At December 31,
Average
At December 31,
Average
U.S. Dollar
1.105
1.081
1.067
1.053
1.133
1.183
Swiss Franc
0.926
0.972
0.985
1.005
1.033
1.081
Chinese Renminbi
7.851
7.660
7.358
7.079
7.195
7.629
Pound Sterling
0.869
0.870
0.887
0.853
0.840
0.860
Hong Kong Dollar
8.631
8.465
8.316
8.245
8.833
9.193
Singapore Dollar
1.459
1.452
1.430
1.451
1.528
1.589
United Arab Emirates Dirham
4.058
3.971
3.917
3.867
4.160
4.344
Japanese Yen
156.330
151.990
140.660
138.027
130.380
129.877
South Korean Won
1,433.660
1,412.880
1,344.090
1,358.073
1,346.380
1,353.958
Interests in associates and in joint arrangements
An associate is an entity over which the Group has significant influence. Significant influence is the power to participate in the financial and operating policy decisions of the investee without having control or joint control over those policies.
A joint venture is a joint arrangement whereby the parties that have joint control of the arrangement have rights to the net assets of the arrangement.
Associates and joint ventures are accounted for using the equity method of accounting, from the date significant influence or joint control is obtained, respectively.
Under the equity method, the investments are initially recognized at cost and adjusted thereafter to recognize the Group’s share of the profit/(loss) and other comprehensive income/(loss) of the investee. The Group’s share of the investee’s profit/(loss) is recognized in the consolidated statement of profit and loss. Distributions received from an investee reduce the carrying amount of the investment. Post-acquisition movements in other comprehensive income/(loss) are recognized in other comprehensive income/(loss) with a corresponding adjustment to the carrying amount of the investment. Unrealized gains on transactions between the Group and its associates and joint ventures are eliminated to the extent of the Group’s interest. Unrealized losses are also eliminated unless the transaction provides evidence of an impairment of the asset transferred. When the Group’s share of the losses of an associate or joint venture exceeds the carrying amount of the Group’s investment, the Group discontinues recognizing its share of further losses. Additional losses are provided for, and a liability is recognized, only to the extent that the Group has incurred legal or constructive obligations or made payments on behalf of the related investee. The Group discontinues the use of the equity method from the date the investment ceases to be an associate or joint venture, or when it is classified as available-for-sale.
Scope of consolidation
Ermenegildo Zegna N.V. is the parent company of the Group and it holds, directly or indirectly, interests in the Group’s subsidiaries. The following table presents the Group’s scope of consolidation at December 31, 2023 and 2022:
Company
Registered office
Share capital (functional currency)
Held directly by
% Group
At December 31,
2023
2022
Companies consolidated on a line-by-line basis
Parent company
Ermenegildo Zegna N.V.
Amsterdam (Netherlands)
9,153,722
Italian subsidiaries
In.co. S.p.A.
Biella
4,050,000
Ermenegildo Zegna N.V.
100
%
100
%
F-17
Company
Registered office
Share capital (functional currency)
Held directly by
% Group
At December 31,
2023
2022
Pelletteria Tizeta S.r.l. (3)
Sesto Fiorentino (FI)
206,816
Ermenegildo Zegna N.V. (50%) / Tom Ford International LLC (50%)
100
%
50
%
Lanificio Ermenegildo Zegna e Figli S.p.A.
Valdilana (BI)
3,100,000
Ermenegildo Zegna N.V.
100
%
100
%
Ezi S.p.A.
Milan
5,750,000
Ermenegildo Zegna N.V.
100
%
100
%
EZ Service S.r.l.
Valdilana (BI)
500,000
Ermenegildo Zegna N.V.
100
%
100
%
Bonotto S.p.A.
Colceresa (VI)
1,239,600
Ermenegildo Zegna N.V.
60
%
60
%
Cappellificio Cervo S.r.l.
Biella
300,000
Ermenegildo Zegna N.V.
51
%
51
%
Thom Browne Services Italy S.r.l.
Milan
10,000
Thom Browne Trading SA
90
%
90
%
Thom Browne Retail Italy S.r.l.
Milan
10,000
Thom Browne Services Italy S.r.l.
90
%
90
%
Gruppo Dondi S.p.A.
Carpi (MO)
1,502,800
Ermenegildo Zegna N.V.
65
%
65
%
Tessitura Ubertino S.r.l.
Valdilana (BI)
100,000
Ermenegildo Zegna N.V.
60
%
60
%
Tom Ford Distribution S.r.l. (3)
Sesto Fiorentino (FI)
117,616
Tom Ford Switzerland Sagl (85.02%) / Tom Ford International LLC (14.98%)
100
%
—
%
Foreign subsidiaries
Investindustrial Acquisition Corp. (“IIAC”) (6)
Cayman Islands
5,614
Ermenegildo Zegna N.V.
—
%
100
%
Ermenegildo Zegna Giyim Sanayi ve Tic. A. S.
Istanbul (Turkey)
32,291,439
Ermenegildo Zegna N.V.
100
%
100
%
Ermenegildo Zegna H.m.b.H.
Wien (Austria)
610,000
Ermenegildo Zegna N.V.
100
%
100
%
Société de Textiles Astrum France S.à.r.l.
Paris (France)
500,000
Ermenegildo Zegna N.V.
100
%
100
%
Ermenegildo Zegna GmbH
Munich (Germany)
6,577,421
Ermenegildo Zegna N.V.
100
%
100
%
Zegna Japan Co., LTD
Minato-Ku-Tokyo (Japan)
100,000,000
Ermenegildo Zegna N.V.
100
%
100
%
Fantasia (London) Limited
London (UK)
499,800
Ermenegildo Zegna N.V.
100
%
100
%
Ermenegildo Zegna S.A. de C.V.
Ciudad de Mexico (Mexico)
459,600,000
Ermenegildo Zegna N.V.
100
%
100
%
Ezeti Portugal. S.A.
Lisbon (Portugal)
800,000
Ermenegildo Zegna N.V.
100
%
100
%
Ermenegildo Zegna Madrid S.A.
Barcelona (Spain)
901,500
Ezeti S.L.
70
%
70
%
Ezeti S.L.
Barcelona (Spain)
500,032
Italco S.A.
100
%
100
%
Italco S.A.
Sant Quirze (Spain)
1,911,300
Ermenegildo Zegna N.V.
100
%
100
%
Ermenegildo Zegna Czech s.r.o
Prague (Czech Republic)
1,350,000
Ermenegildo Zegna N.V.
100
%
100
%
Co.Ti. Service S.A.
Stabio (Switzerland)
27,940,000
Ermenegildo Zegna N.V.
100
%
100
%
Consitex S.A.
Stabio (Switzerland)
15,000,000
Ermenegildo Zegna N.V.
100
%
100
%
Ermenegildo Zegna Corporation
New York, NY
500,000
Ermenegildo Zegna N.V.
100
%
100
%
Zegna (China) Enterprise Management Co., Ltd.
Shanghai (China)
58,309,140
Ermenegildo Zegna N.V.
100
%
100
%
Ermenegildo Zegna (China) Co., LTD
Shanghai (China)
50,000,000
Ermenegildo Zegna N.V.
100
%
100
%
Ismaco Amsterdam B.V. (6)
Amsterdam (Netherlands)
226,890
Ermenegildo Zegna N.V.
—
%
100
%
Ermenegildo Zegna Far-East Pte LTD
Singapore
21,776,432
Consitex S.A.
100
%
100
%
Ermenegildo Zegna Hong Kong LTD
Hong Kong
538,240,000
Ermenegildo Zegna N.V.
100
%
100
%
E.Z. Trading (Hong Kong) LTD
Hong Kong
82,120,000
Ermenegildo Zegna N.V.
100
%
100
%
Ermenegildo Zegna Canada Inc.
Toronto (Canada)
700,000
Ermenegildo Zegna N.V.
100
%
100
%
F-18
Company
Registered office
Share capital (functional currency)
Held directly by
% Group
At December 31,
2023
2022
Ermenegildo Zegna Australia PTY LTD
Sydney (Australia)
18,000,000
Ermenegildo Zegna Far-East Pte LTD
100
%
100
%
E. Z. New Zealand LTD
Auckland (New Zealand)
5,800,000
Ermenegildo Zegna N.V.
100
%
100
%
Ezesa Argentina S.A.
Buenos Aires (Argentina)
9,421,014
Ermenegildo Zegna N.V. / Italco S.A.
100
%
100
%
E. Z. Thai Holding Ltd
Bangkok (Thailand)
3,000,000
Ermenegildo Zegna N.V.
49
%
49
%
The Italian Fashion Co. LTD
Bangkok (Thailand)
16,000,000
E. Z. Thai Holding Ltd / Ermenegildo Zegna Far-East Pte LTD
65
%
65
%
Zegna South Asia Private LTD
Mumbai (India)
902,316,770
Ermenegildo Zegna N.V.
51
%
51
%
ISMACO TEKSTİL LİMİTED ŞİRKETİ
Istanbul (Turkey)
10,000,000
Ermenegildo Zegna N.V.
100
%
100
%
Ezesa Brasil Participacoes LTDA
San Paolo (Brazil)
77,481,487
Ermenegildo Zegna N.V.
100
%
100
%
Ermenegildo Zegna (Macau) LTD
Kowloon Bay (Hong Kong)
4,650,000
Consitex S.A.
100
%
100
%
Ermenegildo Zegna Malaysia Sdn. Bhd.
Kuala Lumpur (Malaysia)
3,000,000
Ermenegildo Zegna Far-East Pte LTD
100
%
100
%
Ermenegildo Zegna Maroc S.A.R.L.A.U.
Casablanca (Morocco)
530,000
Ermenegildo Zegna N.V.
100
%
100
%
Ermenegildo Zegna Vietnam LLC
Hanoi City (Vietnam)
132,294,900,000
Ermenegildo Zegna N.V.
90
%
90
%
Zegna Gulf Trading LLC
Dubai (UAE)
300,000
Consitex S.A.
49
%
49
%
EZ US Holding Inc.
Wilmington (U.S.A.)
1,000,099
Ermenegildo Zegna N.V.
100
%
100
%
E.Zegna Attica Single Member Societé Anonyme
Athens (Greece)
650,000
Ermenegildo Zegna N.V.
100
%
100
%
Zegna for Retail of Readymade and Novelty Clothes W.L.L.
Kuwait City (Kuwait)
125,000
Zegna Gulf Trading LLC
49
%
49
%
Zegna Denmark ApS (2)
Aarhus (Denmark)
400,000
Ermenegildo Zegna N.V.
100
%
—
%
EZ CA Holding Corp.
Toronto (Canada)
1,000
Ermenegildo Zegna N.V.
100
%
—
%
Thom Browne Inc.
Wilmington (U.S.A.)
5,510
Ermenegildo Zegna N.V.
90
%
90
%
Thom Browne Japan Inc.
Tokyo (Japan)
1,000,000
Thom Browne Inc.
90
%
90
%
Thom Browne Trading SA
Stabio (Switzerland)
100,000
Thom Browne Inc.
90
%
90
%
Thom Browne France Services
Paris (France)
50,000
Thom Browne Trading SA
90
%
90
%
Thom Browne UK Limited
Beckenham (UK)
1
Thom Browne Trading SA
90
%
90
%
Thom Browne (China) Co., Ltd.(*)
Shanghai (China)
900,000
Thom Browne Trading SA
90
%
90
%
Thom Browne (Macau) Limited
Hong Kong
500,000
Thom Browne Trading SA
90
%
90
%
Thom Browne Canada
Vancouver (Canada)
100
Thom Browne Trading SA
90
%
90
%
Thom Browne Hong Kong Limited
Hong Kong
500,000
Thom Browne Trading SA
90
%
90
%
Thom Browne Eyewear (T.B.E.) SA
Stabio (Switzerland)
1,000,000
Thom Browne Trading SA
90
%
90
%
Thom Browne Eyewear France SAS
Paris (France)
40,000
Thom Browne Eyewear SA
90
%
90
%
Thom Browne Korea Ltd. (5)
Seoul (South Korea)
100,000,000
Thom Browne Trading SA
90
%
—
%
Tom Ford International LLC (3)
Delaware (U.S.A.)
10,000,000
EZ US Holding Inc
100
%
15
%
Tom Ford Switzerland (3)
Stabio (Switzerland)
1,000,000
Tom Ford International LLC
100
%
—
%
Tom Ford Showroom Limited (3)
London (UK)
1
Tom Ford Distribution S.r.l.
100
%
—
%
Tom Ford Retail UK Limited (3)
London (UK)
1
Tom Ford International LLC
100
%
—
%
Tom Ford Studio Limited (3)
London (UK)
50,000
Tom Ford International LLC
100
%
—
%
Tom Ford Property Limited (3)
London (UK)
1
Tom Ford International LLC
100
%
—
%
Tom Ford Retail LLC (3)
New York (U.S.A.)
2,060,000
Tom Ford International LLC
100
%
—
%
F-19
Company
Registered office
Share capital (functional currency)
Held directly by
% Group
At December 31,
2023
2022
Tom Ford Retail Hong Kong Limited (3)
Hong Kong
300,000
Tom Ford International LLC
100
%
—
%
Tom Ford Hong Kong Limited (3)
Hong Kong
1,000
Tom Ford International LLC
100
%
—
%
Tom Ford Retail Macau Limited (3)
Macau
25,000
Tom Ford Retail Hong Kong Limited (96%) / Tom Ford Hong Kong Limited (4%)
100
%
—
%
Tom Ford Retail Korea (Yuhan Hoesa) (3)
Seoul (Korea)
50,000,000
Tom Ford International LLC
100
%
—
%
Tom Ford Retail Japan GK (Godo Kaisha) (3)
Tokyo (Japan)
10,000,000
Tom Ford International LLC
100
%
—
%
Tom Ford Clothing Retail Shanghai Company Limited (3)
Shanghai (China)
13,500,000
Tom Ford Retail Hong Kong Limited
100
%
—
%
Italian associates and joint arrangements
Filati Biagioli Modesto S.r.l.
Montale (PT)
7,900,000
Ermenegildo Zegna N.V.
40
%
40
%
Luigi Fedeli e Figlio S.r.l. (7)
Monza (MB)
3,358,000
Ermenegildo Zegna N.V.
15
%
—
%
Foreign associates and joint arrangements
Norda Run Inc (1)
Toronto (Canada)
9,696,528
EZ CA Holding Corp.
25
%
—
%
Other investments valued at fair value
Acquedotto Piancone S.r.l.
Valdilana (BI)
42,000
Lanificio Ermenegildo Zegna e Figli S.p.A.
67
%
67
%
Pettinatura di Verrone S.r.l.
Verrone (BI)
3,000,000
Lanificio Ermenegildo Zegna e Figli S.p.A.
15
%
15
%
Sharmoon.EZ.Garments Co. Ltd
Wenzhou (China)
100,000,000
Ermenegildo Zegna N.V.
50
%
50
%
F2 S.r.l.
Schio (VI)
90,000
Bonotto S.p.A.
29
%
29
%
Consorzio Re.Crea (4)
Milan
712,000
Ermenegildo Zegna N.V.
15
%
17
%
_________________
(*) Formerly known as Tailoring Luxury Co. Ltd.
The following changes in the scope of consolidation of the Group occurred during the year ended December 31, 2023:
(1)In March 2023, the Group completed the acquisition of a 25% minority stake interest in Canadian technical trail running shoe company Norda Run Inc. (“Norda”) for consideration of $7.1 million, with the option to gradually increase its stake over the next nine years. Management has determined that it has significant influence over Norda as a result of its 25% minority equity interest and the Group accounts for its investment in Norda using the equity method. EZ CA Holding Corporation, a limited liability company based in Canada and fully owned by Ermenegildo Zegna N.V. was incorporated in March 2023, primarily to manage the acquisition of Norda.
(2)In March 2023, Zegna Denmark ApS, a limited liability company based in Denmark and fully owned by Ermenegildo Zegna N.V. was incorporated, primarily to manage the operating activities in Denmark. The Group held a 100% interest in the company at December 31, 2023.
(3)In April 2023, the Group completed the TFI Acquisition, through which it acquired the company that owns and operates the TOM FORD FASHION business, as part of a transaction in which sole ownership of the TOM FORD brand, its trademarks, and other intellectual property rights have been acquired by The Estée Lauder Companies Inc. (“ELC”). Before the completion of the TFI Acquisition, the Group already owned 15% of TFI, through its fully owned subsidiary EZ US Holding Inc., and, through the TFI Acquisition it acquired the remaining 85% equity interest. As a result of the TFI Acquisition, the Group also obtained 100% of Pelletteria Tizeta, for which it previously held a 50% interest and accounted for the investment using the equity method, with the remaining 50% interest owned by TFI and being acquired by the Group through the TFI Acquisition. For additional information relating to the TFI Acquisition and the acquisition method of accounting for the transaction, see Note 24 — Business combinations.
F-20
(4)In 2023, the interest held in Consorzio Re.Crea was reduced from 16.7% at December 31, 2022 to 15.5% due to the entrance of new consortium members in the company.
(5)In March 2023, Thom Browne Korea Ltd., a limited liability company fully owned by Thom Browne Trading SA, was incorporated. On July 1, 2023, Thom Browne began directly operating its business in South Korea and its network of 17 stores through the company, with the external support from the former franchise partner. The Group held a 90% interest in the company at December 31, 2023.
(6)On April 6, 2023 and April 20, 2023, respectively, Investindustrial Acquisition Corp. and Ismaco Amsterdam B.V. were liquidated.
(7)On September 5, 2023, Ermenegildo Zegna Group and Prada Group completed the previously announced acquisition of a 30% interest in Luigi Fedeli e Figlio S.r.l., the world-renowned maker of fine Italian knitwear and yarns, with each group acquiring 15% of the company. The Group paid consideration of €4.7 million for 15% of the company. The Group accounts for this investment under the equity method based on its representation on the board of directors of the company and its participation in policy-making processes.
Property, plant and equipment
Cost
Property, plant and equipment is initially recognized at cost, which comprises the purchase price, any costs directly attributable to bringing the assets to the location and condition necessary to be capable of operating in the manner intended by management, capitalized borrowing costs and any initial estimate of the costs of dismantling and removing the item and restoring the site on which it is located. Self-constructed assets are initially recognized at their production cost, including labor costs. Subsequent costs are capitalized only if they increase the future economic benefits embodied in the related assets. All other expenditures are expensed as incurred. When parts are replaced, the carrying amount of the parts that are replaced are written off in the consolidated statement of profit and loss.
Property, plant and equipment is presented net of accumulated depreciation, calculated on the basis of the useful lives of the assets, and any impairment losses.
Depreciation
Depreciation is calculated on a straight-line basis over the estimated useful lives of the assets, as follows:
Category of Property, Plant and Equipment
Depreciation Rate
Buildings
3% - 10%
Plants and machinery
12.5% - 17.5%
Industrial and commercial equipment
20% - 25%
Leasehold improvements
10.0% - 25.0%
Other tangible assets
10% - 25%
Land and assets under construction are not depreciated.
If the asset being depreciated consists of separately identifiable components whose useful life differs from that of the other parts making up the asset, depreciation is charged separately for each of its component parts through application of the “component approach.”
Property, plant and equipment is tested for impairment when impairment indicators are identified, such as a scheduled closure of a store or site, a redundancy plan or a downward revision of market forecasts. When an asset’s recoverable amount is less than its net carrying amount, an impairment loss is recognized. Where the recoverable amount of an individual asset cannot be determined precisely, the Group determines the recoverable amount of the cash-generating unit (“CGU”) or group of CGUs to which the asset belongs. Any gain or loss on disposal of property, plant and equipment is recognized in profit or loss.
F-21
Intangible assets with an indefinite useful life
Goodwill and brands with an indefinite useful lives
Goodwill originated on acquisitions of subsidiaries and brands with an indefinite useful lives that are acquired separately are initially recognized in accordance with IFRS 3 — Business Combinations, as further described below, and are recorded within intangible assets. In accordance with IAS 36 — Impairment of assets (“IAS 36”), goodwill and brands with an indefinite useful lives are not amortized and are tested for impairment annually, or more frequently if facts or circumstances indicate that the asset may be impaired. Goodwill and brands with an indefinite useful lives are allocated to each of the Group’s CGUs (or groups of CGUs) expected to benefit from the synergies of the combination. CGUs (or groups of CGUs) to which goodwill and brands with an indefinite useful lives have been allocated are tested for impairment annually, or more frequently when there is an indication that the unit may be impaired, in order to verify that the recoverable amount of the CGU (or groups of CGUs) is not less than the carrying amount of the CGU (or groups of CGUs).
The recoverable amount of all CGUs and groups of CGUs is based on a value in use calculation which uses cash flow projections based on most recent budget forecast calculations, which are prepared separately for each CGU and approved by management. These budget and forecast calculations generally cover a period of three years. A long-term growth rate is calculated and applied to project future cash flows after the third year. In assessing value in use, the estimated future cash flows are discounted to their present value using a pre-tax discount rate that reflects current market assessments of the time value of money and the risks specific to the asset.
Intangible assets with a finite useful life
An identifiable non-monetary asset without physical substance, controlled by the Group and capable of producing future economic benefits is recognized as intangible assets.
Intangible assets with a finite useful life include trademarks, licenses, software, and development costs.
Concession, licenses, trademarks and patents
Concession, licenses, trademarks and patents are recognized at cost or at the value attributed upon acquisition and include the cost of trademark registration in the various countries in which the Group operates, assuming there are no risks or limitations on control over their use.
Software
Software acquired as part of recurring operations and software developed in-house by the Group which meet the relevant criteria in IAS 38 — Intangible Assets (“IAS 38”) are capitalized and amortized on a straight-line basis over their useful lives.
Know how
As a result of the acquisition of Tessitura Ubertino in June 2021, the Group recognized intangible assets relating to know how, which were initially recognized at their fair value at the date of acquisition and will be amortized over a 5 year period.
Development costs
Development costs are recognized as an asset if, and only if, both of the following conditions in IAS 38 are met: (i) that development costs can be measured reliably and (ii) that the technical feasibility of the product, volumes and pricing support the view that the development expenditure will generate future economic benefits. Capitalized development costs include all direct and indirect costs that may be directly attributed to the development process. All other research and development costs are expensed as incurred.
Intangible assets with a definite useful life are amortized on a straight-line basis at the following rates:
F-22
Category of Intangible Assets with a Finite Useful Life
Depreciation Rate
Concessions, licenses, trademarks and patents
2.5% - 25.0%
Software
10% - 33%
Know how
20%
Development costs and other intangibles
10% - 33%
The Group continuously monitors its operations to assess whether there is any indication that its intangible assets with a definite useful life (including intangible assets in progress) are impaired. See “—Impairment of non-current assets” below for additional information.
Leases
The Group recognizes a right-of-use asset and a corresponding lease liability at the date at which the leased asset is available for use. Each lease payment is allocated between the principal liability and finance costs. Finance costs are charged to the statement of profit and loss over the lease period using the effective interest rate method. Right-of-use assets are depreciated on a straight-line basis over the lease term or, if shorter, the useful life of the asset.
Right-of-use assets are measured at cost comprising the following: (i) the amount of the initial measurement of lease liability; (ii) any lease payments made at or before the commencement date less any lease incentives received; (iii) any initial direct costs and, if applicable, (iv) restoration costs. Payments associated with short- term leases (less than 12 months at inception) and leases of low-value assets are recognized as an expense in the statement of profit and loss on a straight-line basis.
Lease liabilities are measured at the net present value of the following: (i) fixed lease payments, (ii) variable lease payments that are based on an index or a rate and, if applicable, (iii) amounts expected to be payable by the lessee under residual value guarantees, and (iv) the exercise price of a purchase option if the lessee is reasonably certain to exercise that option. Lease liabilities do not include any non-lease components that may be included in the related contracts. Lease payments are discounted using the interest rate implicit in the lease. If that rate cannot be determined, the Group’s incremental borrowing rate is used, being the rate that the Group would have to pay to borrow the funds necessary to obtain an asset of similar value in a similar economic environment with similar terms and conditions.
Variable lease payments are recognized in the statement of profit and loss in the period in which the condition that triggers those payments occurs. In determining the lease term, management considers all facts and circumstances that create an economic incentive to exercise an extension option, or not exercise a termination option. The Group determines the lease term as the non-cancellable period of a lease, together with the periods covered by (i) an option to extend if the lessee is reasonably certain to extend or periods after an optional termination date if the lessee is reasonably certain not to terminate early. Management evaluates the exercise of the option if it’s considered “reasonably certain” based on several factors and circumstances that create an incentive for the lessee to exercise, or not to exercise the option, including any expected changes in facts and circumstances from the commencement date until the exercise date of the option.
The Group subleases certain spaces to third parties. The accounting for the right-of-use asset depends on the classification of the sublease, while the accounting for the head lease liability remains unchanged. For sublease classified as finance lease, the Group derecognizes the right-of-use asset (to the extent that it is subject to the sublease) and recognizes a lease receivable. If the sublease is classified as an operating lease, the Group continues to recognize the right-of-use asset. Operating income from the sublease is recognized on a straight-line basis over the term of the agreement
Impairment of non-current assets
The Group continuously monitors its operations to assess whether there is any indication that its non-current assets are impaired, including goodwill, brands with an indefinite useful life, intangible assets with a definite useful life (including intangible assets in progress), property, plant and equipment and right-of-use assets. Goodwill, brands with an indefinite useful life and intangible assets in progress are tested for impairment annually or more frequently, if there is an indication that they may be impaired. If impairment indicators are present, the carrying amount of the asset is reduced to its recoverable amount, which is the higher of its (i) fair value less costs of disposal and (ii) value in use. The recoverable amount is determined for the individual asset, unless the asset does not generate cash inflows that are largely independent of the cash
F-23
inflows from other assets or groups of assets, in which case the asset is tested as part of the CGU to which the asset belongs. A CGU is the smallest identifiable group of assets that generates cash inflows that are largely independent of the cash inflows from other assets or groups of assets.
The Group identifies each DOS as a separate CGU. New DOS require a start-up period before they achieve the expected level of profitability, which generally extends for three years following the date of each store’s opening. When a DOS is in the start-up period, an operating loss is not necessarily considered to be an indicator of possible impairment. The Group considers an operating loss to be an indicator of possible impairment if the DOS cash flows for the start-up period are lower than the DOS cash flows of the approved operational plan. Strategic stores are considered separate CGUs when determining whether any impairment indicators are present. If an impairment indicator is identified, it is assessed whether other stores have benefited from the strategic store. If the strategic store is determined to benefit other stores, an impairment test for the strategic store is performed as a group of CGUs at the segment level.
In assessing the value in use of an asset or CGU, the estimated future cash flows are discounted to their present value using a discount rate that reflects current market assessments of the time value of money and the risks specific to the asset or CGU. An impairment loss is recognized if the recoverable amount is lower than the carrying amount. Where an impairment loss for assets other than goodwill subsequently no longer exists or has decreased, the carrying amount of the asset or CGU is increased to the revised estimate of its recoverable amount, but not in excess of the carrying amount that would have been recorded had no impairment loss been recognized. The reversal of an impairment loss is recognized in the consolidated statement of profit and loss.
Business combinations
Business combinations are accounted for using the acquisition method in accordance with IFRS 3. Accordingly, the consideration transferred (acquisition price) in a business combination is measured at the fair value, which is measured at the fair value of the assets transferred, liabilities incurred by the acquirer and the equity interest issued at the date the control changed. The following items constitute an exception, which are instead valued according to their reference principle: (i) deferred tax assets and liabilities, (ii) assets and liabilities for employee benefits and (iii) assets held for sale. Acquisition-related costs are recognized in the consolidated statement of profit and loss as incurred. Goodwill is measured as the excess of the acquisition price plus the amount of any non-controlling interests in the acquiree over the net fair value of the identifiable assets acquired and liabilities assumed. If, after reassessment, it results in a negative difference, the excess is recognized immediately in the consolidated statement of profit and loss as a bargain purchase gain.
In the event that the fair values of the assets, liabilities and contingent liabilities can only be determined provisionally, the business combination is recognized using these provisional values. Any adjustments deriving from the completion of the valuation process are recognized within twelve months from the acquisition date.
If a price component is linked to the realization of future events, this component is considered in the estimate of the fair value at the time of the business combination.
Significant gains and losses, with the related tax effects, deriving from transactions carried out between fully consolidated companies not yet realized with third parties, are eliminated, except for losses that are not eliminated if the transaction provides evidence of a reduction of value of the transferred asset. The reciprocal debit and credit relationships, costs and revenues, as well as financial income and expenses are also eliminated if significant.
The purchase of further holdings in subsidiaries and the sale of shares that do not involve the loss of control are considered transactions between shareholders; as such, the accounting effects are recognized directly in the Group’s equity.
Put and call agreement on non-controlling interests
In the case of put options granted to non-controlling interests, the Group recognizes a financial liability corresponding to the present value of the exercise price of the option. On initial recognition, if put option terms and conditions give the Group the access to the economic benefits of the non-controlling interests, the Group recognizes a financial liability and a reduction of equity attributable to non-controlling interests (as if the non-controlling interest had been acquired by the Group). If put option terms and conditions do not give the Group the access to the economic benefits of the non-controlling interests, the Group recognizes a financial liability and a reduction of the Group’s retained earnings. The liability is subsequently remeasured at the end of each period. The liability is subsequently accreted through financial
F-24
expenses up to the redemption amount that is payable at the date at which the option first becomes exercisable. In the event that the option expires unexercised, the liability is derecognized with a corresponding adjustment to equity.
Financial instruments
The classification of a financial asset is based on the Group’s business model for managing the related financial assets and their contractual cash flows. The Group considers whether the contractual cash flows represent solely payments of principal and interest that are consistent with a basic lending arrangement. Where the contractual terms introduce exposure to risk or volatility that are inconsistent with a basic lending arrangement, the related financial assets are classified and measured at fair value through profit and loss.
With the exception of trade receivables that do not contain a significant financing component (or for which the Group has applied the practical expedient available under IFRS 15 — Revenue from contracts with customers (“IFRS 15”), which are measured at the transaction price (as defined in IFRS 15), all financial assets are initially measured at their fair value plus, in the case of financial assets not at fair value through profit and loss only, transaction costs that are directly attributable to the acquisition of the asset.
Measurement subsequent to initial recognition is based on the classification of the financial assets into one of the following categories:
1.Financial assets at amortized cost;
2.Financial assets at fair value through other comprehensive income/(loss), with subsequent recycling of cumulative gains and losses to the statement of profit and loss (“FVOCI”); or
3.Financial assets at fair value through profit and loss (“FVPL”).
1.Financial assets at amortized cost
Financial assets at amortized cost are subsequently measured using the effective interest rate method and are subject to impairment testing. Gains and losses are recognized in the statement of profit and loss when the asset is derecognized, modified or impaired.
The Group’s financial assets at amortized cost primarily include trade receivables, guarantee deposits and certain other non-current financial assets.
2.Financial assets at fair value through other comprehensive income/(loss) (FVOCI)
Financial assets at FVOCI are initially recognized at fair value and subsequent fair value changes are recognized within other comprehensive income/(loss). Interest income, foreign exchange revaluations and impairment losses or reversals are recognized in the consolidated statement of profit and loss. Upon derecognition, the cumulative reserve of fair value changes recognized within other comprehensive income/(loss) is recycled to profit and loss.
The Group’s financial assets at FVOCI primarily include derivative instruments (when they qualify for hedge accounting), as well as fixed income and floating income securities.
3.Financial assets at fair value through profit and loss (FVPL)
Financial assets at FVPL are initially recognized at fair value and subsequent fair value changes are recognized in the consolidated statement of profit and loss. Financial assets at FVPL include derivative instruments and listed equity investments for which the Group has not irrevocably elected to classify the instruments at FVOCI. Dividends from listed equity investments are recognized as other income in the consolidated statement of profit and loss when the right of payment has been established.
The Group’s financial assets measured at FVPL primarily include insurance contracts, equity instruments and fixed income securities, as well as investments in hedge funds and private equity private debts, money market funds, floating income and real estate funds.
F-25
Reclassification
A financial asset is only reclassified when there is a change in the contractual terms that significantly affects the previously expected cash flows or when the Group changes its business model for managing financial assets. Reclassifications are only made prospectively from the reclassification date, without restating any previously recognized gains, losses or interest.
Derecognition
The Group derecognizes a financial asset only when the contractual rights to the cash flows from the asset expire, or when it transfers the financial asset and substantially all the risks and rewards of ownership of the asset to another entity. If the Group neither transfers nor retains substantially all the risks and rewards of ownership and continues to control the transferred asset, the Group recognizes its retained interest in the asset and an associated liability for any obligations created or retained. If the Group retains substantially all the risks and rewards of ownership of a transferred financial asset, the Group continues to recognize the financial asset and also recognizes a collateralized borrowing for the proceeds received.
On derecognition of a financial asset measured at amortized cost, the difference between the asset’s carrying amount and the sum of the consideration received and receivable is recognized in profit and loss. In addition, on derecognition of an investment in a debt instrument classified as FVOCI, the cumulative gain or loss previously accumulated in the investment revaluation reserve within other comprehensive income/(loss) is reclassified to profit and loss.
Impairment of financial assets
The Group recognizes a loss allowance for expected credit losses on investments in debt instruments that are measured at amortized cost or at FVOCI, lease receivables, trade receivables and contract assets, as well as on financial guarantee contracts. The amount of expected credit losses is updated at each reporting date to reflect changes in credit risk since initial recognition of the respective financial instrument.
The Group always recognizes lifetime expected credit losses (ECL) for trade receivables, contract assets, lease receivables and securities. The expected credit losses on these financial assets are estimated using a provision matrix based on the Group’s historical credit loss experience, adjusted for factors that are specific to the debtors, general economic conditions and an assessment of both the current as well as the forecast direction of conditions at the reporting date, including time value of money where appropriate.
Trade receivables
Trade receivables are amounts due from clients for goods sold or services provided in the ordinary course of business. Trade receivables are recognized initially at fair value and subsequently measured at amortized cost using the effective interest rate method, less any loss allowances.
Financial liabilities
Financial liabilities include loans, bonds, lease liabilities, trade payables and other liabilities. These instruments are recorded at fair value on initial recognition, net of any costs that can be ascribed to them. Subsequently, the financial liabilities are measured at amortized cost using the effective interest method. The Group derecognizes a financial liability when, and only when, it is extinguished, i.e. when the obligation in the contract is discharged, canceled or expired.
Derivative financial instruments
The Group enters into a variety of derivative financial instruments to manage its exposure to interest rate and foreign exchange rate risks, including foreign exchange forward contracts, options and interest rate swaps.
Derivatives are recognized initially at fair value at the date a derivative contract is entered into and are subsequently remeasured to fair value at each reporting date. The resulting gain or loss is recognized immediately in profit or loss unless the derivative is designated and effective as a hedging instrument, in which case the timing of the recognition in profit or loss depends on the nature of the hedge relationship. A derivative with a positive fair value is recognized as a financial asset whereas a derivative with a negative fair value is recognized as a financial liability. A derivative is classified as a non-current
F-26
asset or a non-current liability if the remaining maturity of the instrument is more than 12 months and it is not due to be realized or settled within 12 months. Derivatives held for trading are classified as current assets or current liabilities.
Hedge accounting
The Group designates certain derivatives as hedging instruments in respect of foreign currency and interest rate risk, as fair value hedges, cash flow hedges, or hedges of net investments in foreign operations. Hedges of foreign exchange risk on firm commitments are accounted for as cash flow hedges.
At the inception of the hedge relationship, the Group documents the relationship between the hedging instrument and the hedged item, along with its risk management objectives and its strategy for undertaking various hedge transactions. Furthermore, at the inception of the hedge and on an ongoing basis, the Group documents whether the hedging instrument is effective in offsetting changes in fair values or cash flows of the hedged item attributable to the hedged risk, which is when the hedging relationship meets all of the following hedge effectiveness requirements:
a.there is an economic relationship between the hedged item and the hedging instrument;
b.the effect of credit risk does not dominate the value changes that result from that economic relationship; and
c.the hedge ratio of the hedging relationship is the same as that resulting from the quantity of the hedged item that the Group actually hedges and the quantity of the hedging instrument that the Group actually uses to hedge that quantity of hedged item.
If a hedging relationship ceases to meet the hedge effectiveness requirement relating to the hedge ratio but the risk management objective for that designated hedging relationship remains the same, the Group adjusts the hedge ratio of the hedging relationship (i.e. rebalances the hedge) so that it meets the qualifying criteria again.
The Group designates the full change in the fair value of a forward contract (i.e. including the forward elements) as the hedging instrument for all of its hedging relationships involving forward contracts.
The Group designates only the intrinsic value of option contracts as a hedged item and excludes the time value of the option. The changes in the fair value of the aligned time value of the option are recognized in other comprehensive income/(loss) and accumulated in the hedge reserve. If the hedged item is transaction-related, the time value is reclassified to profit or loss when the hedged item affects profit or loss. If the hedged item is time period related, then the amount accumulated in the hedge reserve is reclassified to profit or loss on a rational basis – the Group applies straight-line amortization. Those reclassified amounts are recognized in profit or loss in the same line as the related hedged item. If the hedged item is a non-financial item, then the amount accumulated in the hedge reserve is removed directly from equity and included in the initial carrying amount of the recognized non-financial item. Furthermore, if the Group expects that some or all of the loss accumulated in the hedge reserve will not be recovered in the future, that amount is immediately reclassified to profit or loss.
The Group designates certain derivatives as either:
a.hedges of the fair value of recognized assets or liabilities or a firm commitment (fair value hedge). Where a derivative financial instrument is designated as a hedge against the fluctuation in fair value of a recognized asset or liability (fair value hedge), the gain or loss for re-measuring the hedging instrument at fair value is recognized in the statement of profit and loss together with any changes in the fair value of the hedged asset or liability that are attributable to the hedged risk. Consistently, the hedged items are adjusted to consider changes in fair value of the hedged risk. The gain or loss relating to the effective portion of interest rate swaps hedging fixed rate borrowings is recognized in the statement of profit and loss. The gain or loss relating to the ineffective portion is recognized in the statement of profit and loss. Changes in the fair value of the hedged fixed rate borrowings attributable to interest rate risk are recognized in the statement of profit and loss. If the hedge no longer meets the criteria for hedge accounting, the adjustment to the carrying amount of a hedged item for which the effective interest rate method is used is amortized to the statement of profit and loss over the period to maturity.
b.hedges of a particular risk associated with a recognized asset or liability or a highly probable forecast transaction (cash flow hedge). Where a derivative financial instrument is designated as a hedge of foreign
F-27
exchange rate or interest rate in relation to future cash flow (cash flow hedge), the effective portion of any gain or loss on the derivative financial instrument is recognized directly in other comprehensive income/(loss) within equity. The gain or loss associated with an ineffective portion of a hedge is recognized in the statement of profit and loss. The cumulative gain or loss is removed from equity and recognized in the statement of profit and loss at the same time in which the hedged transaction affects the statement of profit and loss (as an adjustment to the caption of the statement of profit and loss affected by the hedged cash flows). The gain or loss relating to the effective portion of interest rate swaps hedging variable rate borrowings is recognized in the statement of profit and loss. The gain or loss relating to the effective portion of forward foreign exchange contracts hedging export sales is recognized in the statement of profit and loss within ‘revenues’. However, when the forecast transaction that is hedged results in the recognition of a non-financial asset (for example, inventory) or a non-financial liability, the gains and losses previously deferred in equity are transferred from equity and included in the initial measurement of the cost of the asset or liability. When a hedging instrument expires or is sold, or when a hedge no longer meets the criteria for hedge accounting, any cumulative gain or loss existing in equity at that time remains in equity and is recognized when the forecast transaction is ultimately recognized in the statement of profit and loss. When a forecast transaction is no longer expected to occur, the cumulative gain or loss that was reported in equity is immediately transferred to the statement of profit and loss.
Warrant liabilities
The Group accounts for warrants as either equity-classified or liability-classified instruments based on an assessment of the warrant’s specific terms.
For issued or modified warrants that meet all of the criteria for equity classification, the warrants are required to be recorded as a component of share premium within equity at the time of issuance. For issued or modified warrants that do not meet all of the criteria for equity classification, the warrants are recognized as a liability at their initial fair value on the date of issuance, and each balance sheet date thereafter. Changes in the estimated fair value of liability-classified warrants are recognized as a non-cash gain or loss in the statement of profit and loss. In order to determine their fair value, the Group’s public warrants are measured at their trading price and the Group’s private warrants are measured at fair value using a Monte Carlo Simulation model.
Cash and cash equivalents
Cash and cash equivalents include cash on hand, deposits held at call with banks and other short-term highly liquid investments. Cash and cash equivalents are primarily held for the purpose of meeting short-term cash commitments.
To be classified as cash and cash equivalents, an asset must be readily convertible into cash, have an insignificant risk of changes in value and have a maturity period of three months or less at acquisition.
Inventories
Inventories are recognized at the lower of cost (acquisition or production) and net realizable value. Cost includes direct production costs and indirect costs that have been incurred in bringing the inventories to the location and condition necessary to be capable for their use in the production process. Cost is determined on a weighted average basis. Net realizable value is the estimated selling price less the estimated costs of completion and the estimated costs for sale and distribution.
Inventories are presented net of provisions for slow moving and obsolete inventories.
Employee benefits
Pension plans
Defined contribution plans - Costs arising from defined contribution plans are expensed as incurred.
Defined benefit plans - The Group’s net obligations are determined separately for each plan by estimating the present value of future benefits that employees have earned in the current and prior periods, and deducting the fair value of any plan assets.
F-28
The present value of defined benefit obligations is measured using actuarial techniques and benefits are attributable to periods in which the obligation to provide post-employment benefits arise by using the Projected Unit Credit Method. Actuarial assumptions are based on management’s best estimates. The components of defined benefit cost are recognized as follows:
•the service costs are recognized in the consolidated statement of profit and loss in the personnel cost line item;
•the net interest expense on the defined benefit liability is recognized in the consolidated statement of profit and loss within financial expenses;
•the remeasurement components of the net obligation, which comprise actuarial gain and losses, are recognized immediately in other comprehensive income/(loss). These remeasurement components are not reclassified in the consolidated statement of profit and loss in a subsequent period.
Post-employment benefits include the Italian employee severance indemnity (“trattamento di fine rapporto” or “TFR”) obligation required under Italian Law. The amount of TFR to which each employee is entitled must be paid when the employee leaves the Group and is calculated based on the period of employment and the taxable earnings of each employee. Under certain conditions, the entitlement may be partially advanced to an employee during their working life.
The TFR scheme is classified as a defined contribution plan and the Group recognizes the associated costs over the period in which the employee renders service.
Other long-term employee benefits
The Group’s obligations represent the present value of future benefits that employees have earned in return for their service during the current and prior periods. Remeasurement components on other long-term employee benefits are recognized in the consolidated statement of profit and loss in the period in which they arise.
Provisions for risks and charges
Provisions are recognized when the Group has a present obligation, legal or constructive, as a result of a past event, it is probable that an outflow of resources embodying economic benefits will be required to settle the obligation and a reliable estimate of the amount of the obligation can be made.
When some or all of the economic benefits required to settle a provision are expected to be recovered from a third party, a receivable is recognized as an asset if it is virtually certain that reimbursement will be received and the amount of the receivable can be measured reliably. A restructuring provision is recognized when the Group has developed a detailed formal plan for the restructuring and has raised a valid expectation in those affected that it will carry out the restructuring by starting to implement the plan or announcing its main features to those affected by it. The measurement of a restructuring provision includes only the direct expenditures arising from the restructuring, which are those amounts that are both necessarily entailed by the restructuring and not associated with the ongoing activities of the entity.
Present obligations arising under onerous contracts are recognized and measured as provisions. An onerous contract is considered to exist where the Group has a contract under which the unavoidable costs of meeting the obligations under the contract exceed the economic benefits expected to be received under it.
Provisions for the costs to restore leased plant assets to their original condition, as required by the terms and conditions of the lease, are recognized when the obligation is incurred, either at the commencement date or as a consequence of having used the underlying asset during a particular period of the lease, at the directors’ best estimate of the expenditure that would be required to restore the assets. Estimates are regularly reviewed and adjusted as appropriate for new circumstances.
Treasury shares
Treasury shares are measured at purchase cost, as a reduction in shareholders’ equity. The nominal value of the treasury shares held is deducted directly from share capital. Gains and losses on disposal, net of income taxes, are recognized directly to equity.
F-29
Revenue recognition
Revenue mainly comprises sales of goods, together with income from associated services, and income from royalties and operating licenses.
Revenue is recognized when control over a product or service is transferred to a customer. Revenue is measured at the transaction price which is based on the amount of consideration that the Group expects to receive in exchange for transferring the promised goods or services to the customer and excludes any sales incentives, rebates or discounts (including end of season discounts offered by the retail channel), as well as taxes collected from customers that are remitted to government authorities.
Revenues from wholesale operations and direct sales to customers, through retail stores and online channels, are recognized at a point in time when control over a product is transferred to the customers. Revenues from sales of services are recognized when the Group satisfies its performance obligation. Under the Group’s standard contract terms, retail customers are entitled to a right of returns within 30 days, which enables them to receive a full or partial cash refund of the amount paid, a store coupon or another product in exchange. Exchanges of one product for another of the same type, quality, condition and price are not considered returns, unless product exchange occurs after 30 days from the original sale.
Wholesalers generally do not have a contractual right of return.
Provisions for returns are presented in the consolidated statement of financial position under liabilities with a corresponding adjustment to revenue in respect of future refunds. A corresponding asset (with an offsetting adjustment to cost of sales) representing the right to recover the goods from the client is also recognized.
The Group uses its historical experience to estimate the number of returns on a portfolio level using the expected value method.
Royalties received with respect to operating licenses are recognized in accordance with the contractual obligations specific to each agreement, which is generally when the sales occur for sales-based licensing agreements, otherwise over time as the performance obligations are satisfied for other types of licensing agreements.
Payment for retail sales is typically required at the time of purchase or within 30 days, or, on occasion, in advance. Payment terms for wholesale sales are generally longer and the Group may adopt various measures aimed at ensuring collectability of the related consideration, such as requiring customers to provide advanced payments or financial guarantees, as well as performing credit analysis of customers and obtaining insurance over receivables.
Revenues from sales to department stores on a consignment basis are recognized when the goods are ultimately sold by the department stores to the end customers.
Personnel costs
Personnel expenses primarily consist of wages and salaries, social contributions, pension plans and indemnities, share-based payments, severance indemnities and other long-term benefits, as well as costs for payroll taxes, uniforms, insurance and other benefits. Wages and salaries primarily include fixed remuneration, variable short-term remuneration plans, directors’ fees, costs related to employee profit-sharing and other incentive plans, and any associated payroll taxes.
Share-based payments
Cash-settled share-based payments
Where the Group issues cash-settled share-based transactions, the cost of the cash-settled transactions is initially valued at the fair value at the date the beneficiary is informed of their allocation. This fair value is recognized in the statement of profit and loss in the period until vesting, with the recognition of a corresponding liability. Until the liability is settled, the fair value is recalculated at each year-end date and at the settlement date, charging the related changes to the statement of profit and loss.
F-30
Equity-settled share-based payments
Equity-settled share-based payments are accounted for in accordance with IFRS 2, which requires the Company to recognize share-based compensation expense based on the fair value of the awards granted. Compensation expense for the equity-settled awards containing market or non-market performance conditions, as well as for the Escrow Shares issued as part of the Business Combination (as described in Note 1 — General information), is measured at the grant date fair value of the award using a Monte Carlo simulation model, which requires the input of assumptions, including the expected volatility of the Company’s shares, the dividend yield, interest rates and a correlation coefficient between the shares and the relevant market index. The fair value of equity awards which are conditional only on a recipient’s continued service to the Company is measured using the share price at the grant date adjusted for the present value of future distributions which employees will not receive during the vesting period.
Share-based compensation expense relating to equity-settled share-based payments is recognized in the consolidated income statement over the service period with an offsetting increase to equity.
The Group recognizes the effects of modifications that increase the total fair value of share-based payment arrangements or are otherwise beneficial to the employee. If the Group modifies the terms or conditions of the awards granted in a manner that reduces the total fair value of a share-based payment arrangement, or is not otherwise beneficial to the employee (e.g. by increasing the vesting period or adding a non-market performance), the Group continues to recognize the share-based payments as if that modification had not occurred.
Income taxes
Income tax expense comprises the current and deferred tax expense.
Current tax
The tax currently payable is based on taxable profit for the year. The Group’s liability for current tax is calculated using tax rates that have been enacted or substantively enacted by the end of the reporting period.
A provision is recognized for uncertain tax positions for which the tax determination is uncertain but it is considered probable that there will be a future outflow of funds to a tax authority, in accordance with IFRIC 23 — “Uncertainty over Income Tax Treatments.”
Deferred tax
Deferred tax is calculated using the liability method on all temporary differences between the carrying amount recorded in the consolidated balance sheet and the tax value of assets and liabilities, except for goodwill that is not deductible for tax purposes and certain other exceptions. The valuation of deferred tax balances depends on the way in which the Group intends to recover or settle the carrying amount of assets and liabilities, using tax rates that have been enacted or substantively enacted at the end of the reporting period.
Deferred tax assets and liabilities are not discounted and are presented separately in the balance sheet within non-current assets and liabilities. A deferred tax asset is recognized on deductible temporary differences and for tax loss carry-forwards and tax credits to the extent that their future offset is probable. A deferred tax liability is recognized on taxable temporary differences relating to investments in subsidiaries and associates unless the Group is able to control the timing of the reversal of the temporary difference, and it is probable that the temporary difference will not reverse in the foreseeable future.
Earnings per share
Basic earnings per share
Basic earnings per share is calculated by dividing the profit or loss attributable to shareholders of the parent company by the weighted average number of ordinary shares outstanding during the period, excluding treasury shares.
Diluted earnings per share
F-31
Diluted earnings per share is calculated by dividing the profit or loss attributable to holders of the parent company, excluding treasury shares, by the weighted average number of ordinary shares outstanding, taking into account all dilutive potential ordinary shares. To calculate diluted earnings per share, the weighted average number of shares outstanding is adjusted assuming the conversion of all potential shares with dilutive effects, and the entity’s net profit is adjusted to take into account any effects, net of taxes, of the conversion.
In accordance with IAS 33 — Earnings per share, for the calculation of both basic earnings per share and diluted earnings per share the number of ordinary and potential ordinary shares outstanding for all periods reflects the Share Split.
Dividend distribution
Dividend distribution to the Company’s shareholders is recognized as a liability in the Group’s consolidated financial statements in the period in which the dividends are approved by the Company’s shareholders.
Segment information
Operating segments are reported in a manner consistent with the internal reporting provided to the Board of Directors, which has been identified as the chief operating decision-maker of the Group responsible for allocating resources and assessing performance of the operating segments.
Rounding
All amounts disclosed in the financial statements and notes have been rounded to the nearest thousand Euro unless otherwise stated.
4. Key sources of estimation uncertainty, use of estimates and critical accounting judgments
The preparation of the Consolidated Financial Statements in accordance with IFRS requires the use of estimates and assumptions, and may involve the application of judgment in applying the Group’s accounting policy information, that affect the carrying amounts of assets and liabilities (as well as the assessment of contingent assets and liabilities) and the amount of income and expenses recognized. The estimates and assumptions are based on historical experience and on any other factors that are considered to be relevant. Actual results might not fully correspond to estimates.
The estimates and underlying assumptions are reviewed continuously by the Group. The effects of any changes to accounting estimates are recognized in the consolidated statement of profit and loss in the period in which the adjustment is made, or prospectively in future periods.
Key sources of estimation uncertainty
The key assumptions concerning the future, and other key sources of estimation uncertainty, requiring estimates for which there is a risk that a material difference may arise in respect of the carrying amounts of assets and liabilities in the future are discussed below and in the related notes.
Impairment of non-current assets with definite useful lives
Non-current assets with definite useful lives include property, plant and equipment, right-of-us assets and intangible assets. The Group periodically reviews the carrying amount of non-current assets with definite useful lives when events and circumstances indicate that an asset may be impaired. Impairment tests are performed by comparing the carrying amount and the recoverable amount of the CGU. The recoverable amount is the higher of the CGU’s fair value less costs of disposal and its value in use. In assessing the value in use, the estimated future cash flows are discounted to their present value using a pre-tax discount rate that reflects current market assessments of the time value of money and the risks specific to the CGU. For additional information please refer to Note 14 — Intangible assets, Note 15 — Property, plant and equipment and Note 16 — Right-of-use assets.
F-32
Recoverability of goodwill and brands with indefinite useful life
In accordance with IAS 36 — Impairment of Assets (“IAS 36”), goodwill and brands with indefinite useful life are not amortized and are tested for impairment annually or more frequently if facts or circumstances indicate that the asset may be impaired. The impairment test is performed by comparing the carrying amount and the recoverable amount of the CGU. The recoverable amount of the CGU is the higher of its fair value, less costs of disposal and its value in use. For additional information please refer to Note 14 — Intangible assets.
Use of estimates
Items requiring estimates (in addition to those described above) for which there is a risk that a material difference may arise in respect of the carrying amounts of assets and liabilities in the future are discussed below and in the related notes.
Derivatives
Fair value of derivatives not traded in an active market is determined using a mark-to-model valuation technique. Where active markets exist for its component parts, then fair value is determined on the basis of the relevant market prices for the component parts.
Financial liabilities for put options granted to non-controlling interests are measured based on the present value of the exercise price of the option. The liability is subsequently remeasured at fair value at the end of each period.
Valuation techniques that are based on significant inputs that are observable are referred to as Level 2 valuations, while those based on techniques that use significant unobservable inputs are referred to as Level 3 valuations. Estimates and assumptions are made with the support of the corporate functions and, where appropriate, of independent specialists, and are regularly reviewed. For additional information please refer to Note 21 — Derivative financial instruments.
Provisions for obsolete inventory
Since the Group’s products are subject to market trends and changes in fashion trends, product inventories at the end of the season are subject to impairment. Specifically, the provision for obsolete inventory of finished products reflects management’s estimate of the expected impairment losses on the products of the collections of previous seasons, considering the ability to sell them through the Group’s various distribution channels.
Generally, impairment assumptions involve percentages of impairment that become greater the older the collections are, so as to reflect the decline in selling prices in secondary channels (mainly outlets), and on the other hand, the decrease in the probability of selling them as time goes by.
The provision for obsolete raw materials reflects management’s estimates of the decline in the probability they will be used based on the calculation of slow-moving raw materials. For additional information please refer to Note 19 — Inventories.
Recoverability of deferred tax assets
The deferred tax assets are recognized on the premise that it is more likely than not that the Group will be able to generate sufficient and suitable future taxable profits from which the reversal of the asset can be deducted. If the Group is unable to generate sufficient taxable profits in certain jurisdictions, or if there is a significant change in the actual effective tax rates or the time period within which the underlying temporary differences become taxable or deductible, the Group could be required to write-off any deferred tax assets, resulting in an increase in its effective tax rate and an adverse impact on future operating results. For additional information please refer to Note 11 — Income taxes.
Provision for risks and charges
The Group recognizes a liability when facing legal and tax dispute and lawsuits if it believes it is probable that they will require an outflow of financial resources and a reliable estimate can be made of the amount of the potential losses. Given the uncertainty surrounding the outcome of these proceedings, it is hard to reliably estimate the outflow of resources that will be required to settle them, therefore the amount of the provisions for legal and tax disputes may change as a result of future
F-33
developments in the outstanding proceedings. The Group monitors the status of ongoing lawsuits and proceedings and consults with its legal advisors as well as legal and tax experts. For additional information please refer to Note 30 — Provisions for risks and charges.
Fair value estimates
Fair value is defined as the price that would be received for sale of an asset or paid for transfer of a liability, in an orderly transaction between market participants at the measurement date. IFRS 13 — Fair value measurement (“IFRS 13”) establishes a three-tier fair value hierarchy, which prioritizes the inputs used in measuring fair value. The hierarchy gives the highest priority to unadjusted quoted prices in active markets for identical assets or liabilities (Level 1 measurements) and the lowest priority to unobservable inputs (Level 3 measurements). These tiers include:
Level 1, defined as observable inputs such as quoted prices (unadjusted) for identical instruments in active markets; Level 2, defined as inputs other than quoted prices in active markets that are either directly or indirectly observable such as quoted prices for similar instruments in active markets or quoted prices for identical or similar instruments in markets that are not active; and Level 3, defined as unobservable inputs in which little or no market data exists, therefore requiring an entity to develop its own assumptions, such as valuations derived from valuation techniques in which one or more significant inputs or significant value drivers are unobservable. In some circumstances, the inputs used to measure fair value might be categorized within different levels of the fair value hierarchy. In those instances, the fair value measurement is categorized in its entirety in the fair value hierarchy based on the lowest level input that is significant to the fair value measurement. For additional information please refer to Note 34 — Fair value measurement.
Warrants
Warrants give the holder the right, but not the obligation, to subscribe to the Company’s shares at a fixed price for a specified period of time and subject to the terms of redemption. Until warrant holders acquire the Company’s ordinary shares upon exercise of such warrants, they will have no rights with respect to the Company’s shares. These instruments, principally due to an option to replace them upon specific events, including share dividends, extraordinary dividends or reorganizations, which results in the Company delivering a variable number of shares, are accounted for as a current financial liability through profit and loss in accordance with the provisions of IAS 32.
Management measured the public warrants at fair value by using the Euro equivalent of the closing price of warrants on the NYSE. Management estimated the fair value of the private warrants by Monte Carlo simulation model, using as key inputs the Company’s share price, risk-free rate, implied public warrant volatility, the warrants’ maturity, and the public warrants’ market price.
On February 27, 2023 the Group completed the redemption of its outstanding public and private placement warrants, following which there are no remaining public or private placement warrants outstanding. For additional information relating to the Warrant Redemption see Note 28 — Other current and non-current financial liabilities.
Critical judgments in applying the Group's accounting policies
The following are the critical judgments, apart from those involving estimations (which are presented separately above), that the Group has made in the process of applying its accounting policies and that have the most significant effect on the amounts recognized in the Consolidated Financial Statements.
For the year ended December 31, 2022 and 2021, the Group had applied judgment in determining that it has significant influence over Tom Ford International LLC (“TFI”), despite the Group owned 15% of the equity shares of TFI. In making its judgment, the Group determined that it had significant influence in accordance with IAS 28—Investments in Associates and Joint Ventures (“IAS 28”) based on its representation on the board of directors of TFI and its the participation in policy-making processes. Furthermore, there are material transactions between the Group and TFI. As a result of this determination, the Group accounted for the investment in TFI under the equity method until the TFI Acquisition on April 28, 2023, at which point TFI was consolidated by the Group.
For the year ended December 2023, the Group had applied judgment in determining that it has significant influence over Luigi Fedeli e Figlio S.r.l., despite the Group owned 15% of the equity shares of the company. ln making its judgment, the Group determined that it had significant influence in accordance with IAS 28—Investments in Associates and Joint
F-34
Ventures (“IAS 28”) based on its representation on the board of directors of the company and its the participation in policy-making processes. As a result of this determination, the Group accounted for the investment in Luigi Fedeli e Figlio S.r.l. under the equity method.
For additional information, see Note 17 — Investments accounted for using the equity method.
F-35
5. Segment reporting
The Group has determined the operating segments based on the reports reviewed by the Board of Directors, which is considered the Chief Operating Decision Maker (“CODM”) as defined under IFRS 8 — Operating Segments (“IFRS 8”), for the purposes of allocating resources and assessing the performance of the Group.
The Group is organized in three operating and reportable segments, based on a brand perspective, as described below:
1.Zegna segment — Includes all activities related to the ZEGNA branded products, Textile and Third Party Brands product lines.
2.Thom Browne segment — Includes all activities related to the Thom Browne brand.
3.Tom Ford Fashion segment — Includes all activities related to the TOM FORD FASHION business.
Prior to the TFI Acquisition, which was completed on April 28, 2023, the Group was organized in two segments: the Zegna segment and the Thom Browne segment.
Adjusted Earnings Before Interest and Taxes (“Adjusted EBIT”) is the key profit measure used by the CODM to assess performance and allocate resources to the Group’s operating segments, as well as to analyze operating trends, perform analytical comparisons and benchmark performance between periods and among the segments. Adjusted EBIT is defined as profit or loss before income taxes plus financial income, financial expenses, foreign exchange losses and the result from investments accounted for using the equity method, adjusted for income and costs which are significant in nature and that management considers not reflective of underlying operating activities, including, for one or all of the periods presented and as further described below, transaction costs related to acquisitions, severance indemnities and provisions for severance expenses, legal costs for trademark dispute, costs related to the Business Combination, net impairment of leased and owned store, special donations for social responsibility and net (income)/costs related to lease agreements.
Transactions between segments are executed on commercial terms that are normal in the respective markets and primarily relate to intersegment sales.
As a result of a change in the way the CODM and management view the business, starting with the year ended December 31, 2022, costs for certain central corporate functions that are not directly attributable to individual segments, and which were previously allocated to the Zegna segment, are presented separately as Corporate. These central corporate costs, which have increased significantly following the Company’s public listing in December 2021, primarily relate to the compensation of the Board of Directors and costs for functions that are managed centrally on behalf of the entire group, including group general counsel, central finance, internal audit, investor relations, insurance coverage for directors and officers, compliance and certain other centralized activities, including those related to being a public company, for which the costs are not allocated to the segments. This presentation reflects the information regularly reviewed by the CODM for the purposes of allocating resources and assessing the performance of the Group, and management believes this presentation more accurately reflects the underlying nature of such costs and the profitability of the individual segments. As a result, the related costs for the year ended December 31, 2021 have been reclassified from the Zegna segment to Corporate to conform to the current period presentation, resulting in an increase in the Zegna segment Adjusted EBIT compared to the amount previously reported for the year ended December 31, 2021.
As a result of organizational changes within the Group and changes in the information provided to the CODM for the purposes of making strategic decisions relating to the assessment of performance and the allocation of resources, revenues from Pelletteria Tizeta which were allocated to the Zegna segment in the Semi-Annual Report at and for the six month ended June 30, 2023, are now presented within the Tom Ford Fashion segment for the year ended December 31, 2023.
No measures of assets or liabilities by segment are reported to the CODM. Therefore, the related information is not provided.
F-36
The following tables summarize selected financial information by segment for the years ended December 31, 2023, 2022 and 2021.
For the year ended December 31, 2023
(€ thousands)
Zegna
Thom Browne
Tom Ford Fashion
Corporate
Intercompany Eliminations
Group Consolidated
Revenues with third parties
1,290,608
378,410
235,531
—
—
1,904,549
Inter-segment revenues
31,437
1,877
13
—
(33,327)
—
Revenues
1,322,045
380,287
235,544
—
(33,327)
1,904,549
Depreciation and amortization
(139,902)
(27,214)
(26,008)
(46)
—
(193,170)
Adjusted EBIT
193,466
58,969
(1,741)
(30,423)
(59)
220,212
Transaction costs related to acquisitions (1)
(6,001)
Severance indemnities and provisions for severance expenses (2)
(4,002)
Legal costs for trademark dispute (3)
(2,168)
Costs related to the Business Combination (4)
(2,140)
Net impairments of leased and owned stores (5)
(1,782)
Special donations for social responsibility (6)
(100)
Net income related to lease agreements (7)
4,129
Financial income
37,282
Financial expenses
(68,121)
Foreign exchange losses
(5,262)
Result from investments accounted for using the equity method
(2,953)
Profit before taxes
169,094
______________
(1)Relates to transaction costs of €6,001 thousand for consultancy and legal fees, primarily related to the TFI Acquisition and, to a lesser extent, the acquisition of the Thom Browne business in South Korea and the acquisition of a 25% interest in Norda. This amount is recorded within “selling, general and administrative expenses” in the consolidated statement of profit and loss and is related to Corporate for €5,738 thousand and to the Thom Browne segment for €263 thousand.
(2)Relates to severance indemnities of €4,002 thousand. This amount is recorded within “selling, general and administrative expenses” in the consolidated statement of profit and loss and is related to the Zegna segment for €1,166 thousand and to the Tom Ford Fashion segment for €2,836 thousand.
(3)Relates to legal costs of €2,168 thousand in connection with defending a legal dispute initiated by adidas alleging that Thom Browne infringe its intellectual property rights. This amount is recorded within “selling, general and administrative expenses” in the consolidated statement of profit and loss and is related to the Thom Browne segment.
(4)Costs related to the Business Combination of €2,140 thousand relate to the grant of equity awards to management in 2021 with vesting subject to the public listing of the Company’s shares and certain other performance and/or service conditions. This amount is recorded within “selling, general and administrative expenses” for €2,034 thousand and “cost of sales” for €106 thousand in the consolidated statement of profit and loss and relates to the Zegna segment for €1,066 thousand, to the Thom Browne segment for €98 thousand and to Corporate for €976 thousand.
(5)Net impairment of leased and owned stores includes (i) impairment of €915 thousand related to property, plant and equipment, (ii) impairment of €832 thousand related to right-of-use assets and (iii) impairment of €35 thousand, related to intangible assets. These amounts are recorded within “selling, general and administrative expenses” in the consolidated statement of profit and loss and are related to the Tom Ford Fashion segment for €910 thousand, to the Zegna segment for €855 thousand and to Thom Browne segment for €17 thousand.
F-37
(6)Relates to a donation of €100 thousand to support initiatives related to humanitarian emergencies in Turkey. This amount is recorded within “selling, general and administrative expenses” in the consolidated statement of profit and loss and is related to Corporate.
(7)Net income related to lease agreements of €4,129 thousand relates to the derecognition of lease liabilities following a change in terms of a lease agreement in Hong Kong. This amount is recorded within “selling, general and administrative expenses” in the consolidated statement of profit and loss and is related to the Zegna segment.
F-38
For the year ended December 31, 2022
(€ thousands)
Zegna
Thom Browne
Corporate
Intercompany Eliminations
Group Consolidated
Revenues with third parties
1,162,826
330,014
—
—
1,492,840
Inter-segment revenues
13,880
877
—
(14,757)
—
Revenues
1,176,706
330,891
—
(14,757)
1,492,840
Depreciation and amortization
(148,747)
(23,129)
(6)
—
(171,882)
Adjusted EBIT
141,513
48,077
(31,861)
—
157,729
Legal costs for trademark dispute (1)
(7,532)
Transaction costs related to acquisitions (2)
(2,289)
Severance indemnities and provisions for severance expenses (3)
(2,199)
Costs related to the Business Combination (4)
(2,137)
Net impairment of leased and owned stores (5)
(1,639)
Special donations for social responsibility (6)
(1,000)
Net income related to lease agreements (7)
6,844
Financial income
13,320
Financial expenses
(54,346)
Foreign exchange losses
(7,869)
Result from investments accounted for using the equity method
2,199
Profit before taxes
101,081
______________
(1)Relates to legal costs of €7,532 thousand in connection with a legal dispute between adidas and Thom Browne, primarily in relation to the use of trademarks. This amount is recorded within “selling, general and administrative expenses” in the consolidated statement of profit and loss and is related to the Thom Browne segment.
(2)Relates to transaction costs of €2,289 thousand for consultancy and legal fees related to the TFI Acquisition. This amount is recorded within “selling, general and administrative expenses” in the consolidated statement of profit and loss and is related to Corporate.
(3)Relates to severance indemnities of €2,199 thousand. This amount is recorded within “selling, general and administrative expenses” in the consolidated statement of profit and loss and is related to the Zegna segment.
(4)Costs related to the Business Combination of €2,137 thousand relate to the grant of equity awards to management in 2021 with vesting subject to the public listing of the Company’s shares and certain other performance and/or service conditions. This amount is recorded within “selling, general and administrative expenses” for €2,099 thousand and “cost of sales” for €38 thousand in the consolidated statement of profit and loss and relates to the Zegna segment for €1,101 thousand, to the Thom Browne segment for €98 thousand and to Corporate for €938 thousand. For additional information please refer to Note 37 — Share-based payments.
(5)Net impairment of leased and owned stores includes (i) impairment of €2,369 thousand related to right-of-use assets, (ii) reversals of impairment of €756 thousand related to property, plant and equipment and (iii) impairment of €26 thousand related to intangible assets. These amounts are recorded within “selling, general and administrative expenses” in the consolidated statement of profit and loss and are related to the Zegna segment for a net impairment of €819 thousand and to the Thom Browne segment for impairment of €820 thousand.
(6)Relates to a donation of €1,000 thousand to the United Nations High Commissioner for Refugees (UNHCR) to support initiatives related to the humanitarian emergency in Ukraine. This amount is recorded within “selling, general and administrative expenses” in the consolidated statement of profit and loss and is related to Corporate.
(7)Net income related to lease agreements relate entirely to the Zegna segment and recorded within “selling, general and administrative expenses” in the consolidated statement of profit and loss and include (i) proceeds of €6,500 thousand received from new tenants in order for the Group to withdraw from existing lease agreements of commercial properties and (ii) €950 thousand for reversals of previously recognized provisions in respect of a legal claim related to a lease agreement in the United States, partially offset by (ii) €606 thousand for costs related to a sublease agreement in the United States.
F-39
For the year ended December 31, 2021
(€ thousands)
Zegna
Thom Browne
Corporate
Intercompany Eliminations
Group Consolidated
Revenues with third parties
1,029,005
263,397
—
—
1,292,402
Inter-segment revenues
6,170
669
—
(6,839)
—
Revenues
1,035,175
264,066
—
(6,839)
1,292,402
Depreciation and amortization
(137,500)
(17,173)
(2)
—
(154,675)
Adjusted EBIT
131,929
38,097
(20,911)
—
149,115
Costs related to the Business Combination (1)
(205,059)
Net costs related to lease agreements (2)
(15,512)
Severance indemnities and provisions for severance expenses (3)
(8,996)
Net impairment of leased and owned stores (4)
(8,692)
Other adjustments (5)
(4,884)
Financial income
45,889
Financial expenses
(43,823)
Foreign exchange gains
(7,791)
Result from investments accounted for using the equity method
2,794
Loss before taxes
(96,959)
______________
(1)Costs related to the Business Combination in 2021 include:
(a)€114,963 thousand relating to share-based payments for listing services recognized as the excess of the fair value of the Company ordinary shares issued as part of the Business Combination and the fair value of IIAC’s identifiable net assets acquired, in accordance with IFRS 2.
(b)€37,906 thousand for the issuance of 5,031,250 the Company ordinary shares to the holders of IIAC class B shares to be held in escrow. The release of these shares from escrow is subject to achievement of certain targets within a seven-year period.
(c)€34,092 thousand for transaction costs related to the Business Combination incurred by the Group, including costs for bank services, legal advisors and other consultancy fees.
(d)€10,916 thousand for the Zegna family’s grant of a €1,500 special gift to each employee of the Group as result of the Company’s listing completed on December 20, 2021.
(e)€5,380 thousand relating to grant of performance share units, which each represent the right to receive one ordinary share of the Company, to the Group’s Chief Executive Officer, other directors of the Group, key executives with strategic responsibilities and other employees of the Group, all subject to certain vesting conditions. For additional information please refer to Note 37 — Share-based payments.
(f)€1,236 thousand related to the fair value of private warrants issued, pursuant to the Business Combination, to certain non-executive directors of the Group.
(g)€566 thousand related to the write-off of non-refundable prepaid premiums for directors’ and officers’ insurance.
These amounts are recorded within “selling, general and administrative expenses” for €200,961 thousand, within “cost of sales” for €4,086 thousand and “marketing expenses” for €12 thousand in the consolidated statement of profit and loss and are related to Corporate for €190,996 thousand, to the Zegna segment for €13,028 thousand and to the Thom Browne segment for €1,035 thousand.
(2)Net costs related to lease agreements in 2021 relate entirely to the Zegna segment and recorded within “selling, general and administrative expenses” in the consolidated statement of profit and loss and include (i) €12,192 thousand of provisions relating to a lease agreement in the United States following an unfavorable legal claim judgment against the Group, (ii) €1,492 thousand of legal expenses related to a lease agreement in Italy and (iii) €1,829 thousand in accrued property taxes related to a lease agreement in the UK.
(3)Relates to severance indemnities incurred by the Zegna segment of €8,996 thousand and recorded within “selling, general and administrative expenses” in the consolidated statement of profit and loss.
F-40
(4)Net impairment of leased and owned stores in 2021 includes impairment of (i) €6,486 thousand related to right-of-use assets, (ii) €2,167 thousand related to property, plant and equipment and (iii) €39 thousand related to intangible assets. These amounts are recorded within “selling, general and administrative expenses” in the consolidated statement of profit and loss and are related to the Zegna segment.
(5)Other adjustments for the year ended December 31, 2021 include €6,006 thousand related to losses incurred by Agnona subsequent to the Group’s sale of a majority stake in Agnona in January 2021, for which the Group was required to compensate the company in accordance with the terms of the related sale agreement, as well as €144 thousand relating to the write down of the Group’s remaining 30% stake in Agnona, both of which relate to Corporate, partially offset by other income generated by the Zegna segment of €1,266 thousand relating to the sale of rights to build or develop airspace above a building in the United States. These amounts are recorded within “selling, general and administrative expenses” in the consolidated statement of profit and loss.
The following table summarizes non-current assets (other than financial instruments and deferred tax assets) by geography at December 31, 2023 and 2022.
At December 31,
(€ thousands)
2023
2022
EMEA (1)
359,174
281,749
of which Italy
211,394
178,714
North America (2)
739,044
549,634
of which United States (3)
730,090
546,362
Latin America (4)
4,926
5,147
APAC (5)
181,455
143,673
of which Greater China Region
113,134
103,621
of which Japan
18,415
21,339
of which South Korea (6)
27,624
—
Total non-current assets (other than financial instruments and deferred tax assets)
1,284,599
980,203
__________________
(1)EMEA includes Europe, the Middle East and Africa.
(2)North America includes the United States of America and Canada.
(3)Non-current assets in the United States at December 31, 2023 and 2022 included goodwill of €206,699 thousand and €214,141 thousand, respectively, and intangible assets with an indefinite useful life relating to the Thom Browne brand of €162,832 thousand and €168,694 thousand, respectively, which originated on acquisition of the Thom Browne Group in 2018. For additional information see Note 14 — Intangible assets.
(4)Latin America includes Mexico, Brazil and other Central and South American countries.
(5)APAC includes the Greater China Region, Japan, South Korea, Thailand, Malaysia, Vietnam, Indonesia, Philippines, Australia, New Zealand, India and other Southeast Asian countries.
(6)Non-current assets in South Korea at December 31, 2023 included goodwill of €24,003 thousand originated on acquisition of the Thom Browne business in South Korea in 2023. For additional information see Note 14 — Intangible assets
Non-current assets (other than financial instruments and deferred tax assets) in the Netherlands, the Company’s country of domicile, amounted to €1,328 thousand and €1,909 thousand at December 31, 2023 and 2022, respectively.
F-41
6. Revenues
The Group generates revenues primarily from the sale of its products and services, as well as from royalties received from third parties and licensees. Revenues are recognized net of returns and discounts.
The following table provides a breakdown of revenues by product line:
For the years ended December 31,
(€ thousands)
2023
2022
2021
ZEGNA branded products(1)
1,109,491
923,942
847,311
Thom Browne
378,410
330,014
263,397
TOM FORD FASHION
235,531
—
—
Textile
150,986
136,769
102,244
Third Party Brands
25,343
97,792
74,957
Other
4,788
4,323
4,493
Total revenues
1,904,549
1,492,840
1,292,402
_________________
(1)ZEGNA branded products include apparel, bags, shoes and small and large leather goods, as well as licensed goods and royalties.
The following table provides a breakdown of revenues by distribution channel:
For the years ended December 31,
(€ thousands)
2023
2022
2021
Direct to Consumer (DTC)
ZEGNA branded products
945,313
772,505
712,862
Thom Browne
183,422
145,702
138,567
TOM FORD FASHION
136,291
—
—
Total Direct to Consumer (DTC)
1,265,026
918,207
851,429
Wholesale
ZEGNA branded products
164,178
151,437
134,449
Thom Browne
194,988
184,312
124,830
TOM FORD FASHION
99,240
—
—
Third Party Brands and Textile
176,329
234,561
177,201
Total Wholesale
634,735
570,310
436,480
Other
4,788
4,323
4,493
Total revenues
1,904,549
1,492,840
1,292,402
F-42
The following table provides a breakdown of revenues by geographic area:
For the years ended December 31,
(€ thousands)
2023
2022
2021
EMEA (1)
658,694
520,226
380,325
of which Italy
281,793
224,342
158,722
of which UK
70,191
53,970
37,682
of which UAE
68,729
50,926
32,944
North America (2)
417,352
294,686
191,283
of which United States
384,544
270,312
176,059
Latin America (3)
37,538
29,889
19,971
APAC (4)
788,007
644,802
696,344
of which Greater China Region
595,515
494,110
588,876
of which Japan
84,990
65,445
55,479
Other (5)
2,958
3,237
4,479
Total revenues
1,904,549
1,492,840
1,292,402
_______________
(1)EMEA includes Europe, the Middle East and Africa.
(2)North America includes the United States of America and Canada.
(3)Latin America includes Mexico, Brazil and other Central and South American countries.
(4)APAC includes the Greater China Region, Japan, South Korea, Thailand, Malaysia, Vietnam, Indonesia, Philippines, Australia, New Zealand, India and other Southeast Asian countries.
(5)Other revenues mainly include royalties.
Revenues in the Netherlands, the Company’s country of domicile, amounted to €15,505 thousand, €8,701 thousand and €6,320 thousand for the years ended December 31, 2023, 2022 and 2021, respectively.
7. Cost of sales
Cost of sales in 2023, 2022 and 2021 amounted to €680,235 thousand, €564,832 thousand and €495,702 thousand, respectively, consisting of costs directly related to the production, procurement and supply of goods and services, including direct labor costs, costs for raw materials and components used to manufacture the Group’s products (such as fibers and yarns of wool, silk, cotton, linen, cashmere and fabrics of the same composition, as well as leather), costs for semi-finished products, finished goods, consumables and outsourced manufacturing from third parties. Cost of sales also includes depreciation, amortization and impairment of assets used for production, lease expenses, maintenance, write downs of inventory, freight and duty, and other production related costs, including manufacturing overhead. The remaining costs mainly include insurance and transportation costs.
8. Selling, general and administrative expenses
Selling, general and administrative expenses in 2023, 2022 and 2021 amounted to €901,364 thousand, €695,084 thousand and €822,897 thousand, respectively, consisting mainly of costs for sales and administrative personnel, corporate bodies, consultancy and accounting fees, as well as depreciation, amortization and impairment of assets used for selling and administrative activities. Costs related to the Business Combination amounted to €2,034 thousand, €2,099 thousand and €200,961 thousand in 2023, 2022 and 2021, respectively.
9. Marketing expenses
Marketing expenses in 2023, 2022 and 2021 amounted to €114,802 thousand, €85,147 thousand and €67,831 thousand, respectively, consisting mainly of costs for advertising and marketing activities, including personnel costs and costs for advertising, communications, media and events, such as fashion shows, store windows and displays. Marketing expenses also include depreciation, amortization and impairment of assets used in advertising and marketing activities.
F-43
10. Financial income, financial expenses and foreign exchange losses
The following table provides a breakdown for financial income, financial expenses and foreign exchange losses:
For the years ended December 31,
(€ thousands)
2023
2022
2021
Financial income
Options - Changes in fair value
14,792
470
20,675
Securities
8,652
8,154
17,845
Hedging operations
2,968
241
661
Interest on financial other assets
2,707
1,226
1,881
Interest on financial receivables/loans
187
501
583
Derivative financial instruments
6,767
1,022
2,760
Other financial income
1,209
1,706
1,484
Total financial income
37,282
13,320
45,889
Financial expenses
Options - Changes in fair value
—
(11,426)
(13,391)
Hedging operations
(6,736)
(11,701)
(7,044)
Interest and financial charges for lease liabilities
(17,030)
(9,882)
(8,982)
Warrants - Changes in fair value
(22,909)
(1,171)
(4,137)
Securities
(4,412)
(13,426)
(3,902)
Interest on bank loans and overdrafts
(13,361)
(4,785)
(2,845)
Interest expenses on interest rate swaps
(300)
(1,356)
(2,076)
Other financial expenses
(3,373)
(599)
(1,446)
Total financial expenses
(68,121)
(54,346)
(43,823)
Foreign exchange losses
(5,262)
(7,869)
(7,791)
Financial income and financial expenses relating to options represent the fair value changes during the period in the value of the put options owned by the non-controlling interests in the Group’s investments in Thom Browne Group and Gruppo Dondi S.p.A. (“Dondi”) and for 2021 only, in Lanificio, as well as for 2021 only the remeasurement of cash-settled share-based payments.
For the year ended December 31, 2021, financial income relating to options primarily relates to a gain of €20,675 thousand recognized following the purchase of an additional 5% of the Thom Browne Group on June 1, 2021. The put option relating to the remaining 10% of non-controlling interest was remeasured at fair value at December 31, 2023 and 2022, resulting in a decrease in the liability and financial income of €11,587 thousand for the year ended December 31, 2023, mainly due to the increase in the discount interest rate (an increase in the liability and financial expenses of €11,426 thousand and €7,833 thousand for the year ended December 31, 2022 and 2021, respectively).
For the year ended December 31, 2023, financial income relating to options also includes €3,205 thousand related to the fair value remeasurement of the Dondi put option.
For the year ended December 31, 2021 financial expenses relating to options also include €3,523 thousand related to the Lanificio put option (which was closed in July 2021 following the Group’s purchase of the remaining 10% of Lanificio for a total consideration of €9,600 thousand, following which the Group owns 100% of Lanificio), and €2,035 thousand related to the Dondi put option.
See Note 28 — Other current and non-current financial liabilities for additional details relating to the Group’s written put options on non-controlling interests.
As a result of the exercise and redemption of warrants in the first quarter of 2023, the Group remeasured the related warrant liabilities and recognized financial expenses of €22,909 thousand. For additional information see Note 28 — Other current and non-current financial liabilities.
F-44
Financial income and financial expenses for securities relate to investments in securities held by the Group. In line with the Group’s funding strategy, during 2023 the Group disposed of securities (primarily investments in insurance contracts, fixed income and hedge funds) amounting to €267,826 thousand for proceeds of €270,317 thousand that the Group primarily used to finalize the TFI Acquisition and for capital expenditures, as well as to repay borrowings.
Financial income and financial expenses for securities relate to investments in securities held by the Group.
Foreign exchange losses for the years ended December 31, 2023, 2022 and 2021 amounted to €5,262 thousand, €7,869 thousand and €7,791 thousand, respectively. Foreign exchange losses primarily relate to exchange rate effects deriving from the remeasurement of the put options owned by the non-controlling interests in the Group’s investments, and for the year ended December 31, 2023 only, to the reclassification of the cumulative translation losses related to the investment held in TFI, amounting to €4,705 thousand, from other comprehensive income to profit and loss at the date of the TFI Acquisition. For additional information relating to the TFI Acquisition see Note 39 — Business combinations.
11. Income taxes
The following table provides a breakdown for income taxes:
For the years ended December 31,
(€ thousands)
2023
2022
2021
Current taxes
(54,795)
(47,355)
(47,882)
Deferred taxes
21,362
11,553
17,180
Income taxes
(33,433)
(35,802)
(30,702)
The table below provides a reconciliation between actual income taxes and the theoretical income taxes, calculated on the basis of the applicable corporate tax rate in effect in Italy, which was 24.0% for each of the years ended December 31, 2023, 2022 and 2021.
For the years ended December 31,
(€ thousands, except percentages)
2023
2022
2021
Profit/(Loss) before taxes
169,094
101,081
(96,959)
Theoretical income tax (expense)/benefit - tax rate 24%
(40,583)
(24,259)
23,270
Tax effect on:
Non-taxable income/(Non-deductible costs)
11,454
(8,256)
(23,863)
Differences between foreign tax rates and the theoretical applicable tax rate
5,847
10,829
(2,849)
Tax benefit/(expense) relating to prior years
2,997
(96)
(2,668)
Deferred tax assets recognized from previous years
7,425
—
—
Deferred tax assets not recognized
(4,107)
1,876
(14,978)
Tax on dividends and earnings
(5,613)
(5,366)
(9,027)
Other tax items
(6,363)
(6,934)
449
Total tax expense, excluding IRAP
(28,943)
(32,206)
(29,666)
Effective tax rate, excluding IRAP
17.1
%
31.9
%
(30.6
%)
Italian regional income tax expense (IRAP)
(4,490)
(3,596)
(1,036)
Total income tax
(33,433)
(35,802)
(30,702)
Effective tax rate
19.8
%
35.4
%
(31.7
%)
In order to facilitate the understanding of the tax rate reconciliation presented above, income tax expense includes a presentation net of the Italian Regional Income Tax (“IRAP”), which is based on a measure of income defined by the Italian Civil Code as the difference between operating revenues and costs, before financial income and expense, the cost of fixed term employees, credit losses and any interest included in lease payments. The applicable IRAP rate was 5.57% for the Parent Company and 3.9% for the other Italian components, for each of the years ended December 31, 2023, 2022 and 2021.
In 2020 the Group sent a request to the Italian tax authorities to renew its application of the Patent Box tax regime in Italy, which provides for a partial exemption of the business income derived from certain trademarks, designs and models in the Group’s portfolio, for fiscal years up to 2021. The Italian tax authorities acknowledged the request and the outcome of the
F-45
renewal application is still pending at December 31, 2023. Following the enactment of new tax legislation in Italy in 2021, the previous Patent Box tax regime was replaced with a new Patent Box tax regime under which the amount of qualifying expenses are deductible by an additional 110% (for both IRES and IRAP purposes). Specific transitional rules regulate the transition from the previous Patent Box tax regime to the new regime. In the first quarter of 2024 the Group filed for the new Patent Box tax regime and its benefit will be recognized in financial year 2024 onwards.
For the year ended December 31, 2023, other tax items includes €5,100 thousand recognized for uncertain tax positions (€5,000 thousand for the year ended December 31, 2022).
In December 2021, the Organisation for Economic Co-operation and Development (“OECD”) released a draft legislative framework, widely referred as Pillar Two, to ensure large multinational corporations pay a minimum level of tax on the income arising in each of the jurisdictions where they operate. In March 2022, the OECD issued technical guidance and an overview of the potential impact of the OECD Pillar Two legislation on financial statements prepared in accordance with IFRS.
The Pillar Two legislation aims to address Base Erosion and Profit Shifting (BEPS) by introducing a global minimum tax rate of 15% and implementing tax legislation for the allocation of taxing rights.
Since the Group’s ultimate parent Company office is registered in Italy, and that the Italian tax authorities have enacted new tax legislation to implement the Pillar Two framework, the global minimum top-up tax should be applied with respect to all subsidiaries of the Group. The newly enacted tax legislation in Italy is effective for financial years starting from December 31, 2023 (January 1, 2024 for the Ermenegildo Zegna Group), therefore there was no current tax impact for the year ended December 31, 2023.
The Group has prepared a preliminary Transitional Country-by-Country Reporting (CbCR) Safe Harbour assessment concluding on fiscal year 2023, based on which it expects to be eligible for the Transitional CbCR Safe Harbour in the majority of jurisdictions in which the Group is expected to be operating during fiscal year 2024. Based on analysis performed to date, the Group does not expect the application of the Pillar Two legislation to have a material impact on the Group’s income taxes in 2024.
Deferred tax assets and deferred tax liabilities
Deferred taxes reflect the net tax effect of temporary differences between the book value and the taxable amount of assets and liabilities. The accounting of assets for deferred taxes was duly adjusted to take account of the effective possibility to be realized.
The Group’s Italian entities participate in a group Italian tax consolidation under the Ermenegildo Zegna N.V., and may therefore offset taxable income against tax losses of the companies participating in the Italian tax consolidation regime.
F-46
The following tables provide a breakdown for deferred tax assets and deferred tax liabilities:
(€ thousands)
At December 31, 2022
Recognized in profit and loss
Recognized in comprehensive income/(loss)
Business Combination
Exchange differences and other
At December 31, 2023
Deferred tax assets arising on:
Employee benefits
4,794
1,564
(297)
86
(118)
6,030
Property, plant and equipment
9,878
(1,401)
—
—
106
8,583
Lease liabilities
59,963
(4,373)
—
46,141
1,368
103,099
Intangible assets
3,229
(65)
—
—
215
3,379
Provision for obsolete inventory
27,647
2,348
—
(1,036)
28,959
Elimination of Intercompany margin on inventory
28,447
8,361
—
3,439
(546)
39,701
Provisions
3,647
(223)
(47)
—
(1,009)
2,368
Financial assets
1,596
—
(148)
—
—
1,448
Tax losses
41,622
1,601
—
—
3,143
46,366
Other
503
3,051
(17)
3,091
537
7,165
Total deferred tax assets
181,326
10,863
(509)
52,757
2,660
247,098
Deferred tax liabilities arising on:
Property, plant and equipment
448
(184)
—
—
32
296
Right-of-use assets
57,156
(7,288)
—
46,132
615
96,615
Intangible assets
45,301
1,370
—
327
(138)
46,860
Financial assets fair value
2,382
45
(210)
—
(400)
1,817
Other
11,946
(4,442)
(2,254)
4,776
4,492
14,517
Total deferred tax liabilities
117,233
(10,499)
(2,464)
51,235
4,601
160,105
(€ thousands)
At December 31, 2021
Recognized in profit and loss
Recognized in comprehensive income/(loss)
Exchange differences and other
At December 31, 2022
Deferred tax assets arising on:
Employee benefits
4,665
352
(85)
(138)
4,794
Property, plant and equipment
11,107
(1,668)
—
439
9,878
Lease liabilities
36,752
23,255
—
(43)
59,963
Intangible assets
3,246
(85)
—
68
3,229
Provision for obsolete inventory
21,077
4,602
—
1,968
27,647
Elimination of Intercompany margin on inventory
21,695
6,493
—
259
28,447
Provisions
2,851
1,463
—
(667)
3,647
Financial assets
1,533
(84)
—
147
1,596
Tax losses
36,766
100
—
4,756
41,622
Other
2,685
688
(18)
(2,852)
503
Total deferred tax assets
142,377
35,116
(103)
3,937
181,326
Deferred tax liabilities arising on:
Property, plant and equipment
—
452
—
(4)
448
Right-of-use assets
34,188
22,953
—
18
57,156
Intangible assets
45,420
(202)
—
83
45,301
Financial assets fair value
2,461
(1,423)
1,158
186
2,382
Other
5,944
1,783
2,278
1,941
11,946
Total deferred tax liabilities
88,013
23,563
3,436
2,224
117,233
The decision to recognize deferred tax assets is made for each company in the Group by assessing whether the conditions exist for the future recoverability of such assets by taking into account the basis of the most recent forecasts from budgets and business plans. Deferred tax assets and deferred tax liabilities of the individual companies are offset where they may be legally offset and management has the intention to settle them through netting.
F-47
The following table provides the details of tax losses carried forward for which no deferred tax assets were recognized:
At December 31,
(€ thousands)
2023
2022
Expiry within 1 year
15,265
9,936
Expiry 1-5 years
20,793
35,927
Expiry over 5 years
66,384
86,433
No expiration
328,736
321,389
Total tax losses carried forward
431,178
453,685
12. Earnings per share
Basic and diluted earnings per share are calculated as the ratio of net profit or (loss) attributable to the shareholders of the Company by the weighted average number of outstanding ordinary shares (basic and diluted) of the Company.
In accordance with IAS 33 — Earnings per share, for the calculation of both basic earnings per share and diluted earnings per share the number of ordinary and potential ordinary shares outstanding for all periods reflects the Share Split performed as part of the Business Combination. For additional information related to the Business Combination please refer to Note 1 — General information.
The following table summarizes the amounts used to calculate basic and diluted earnings per share:
For the years ended December 31,
(€ thousands, except per share data )
2023
2022
2021
Profit/(Loss) attributable to shareholders of the Parent Company
121,529
51,482
(136,001)
Weighted average number of shares for basic earnings per share
247,015,882
237,545,736
203,499,933
Adjustments for calculation of diluted earnings per share:
Long-Term Incentive Awards 2022-2025 (1)
1,775,976
946,990
—
CEO 2022-2024 PSUs (2)
1,149,273
1,031,673
—
CEO remuneration in shares (3)
1,134,108
1,081,513
—
IPO PSUs (4)
790,000
—
—
Long-term equity incentives (5)
307,242
—
Non-executive directors remuneration in shares (6)
149,836
41,601
—
2023 Restricted Stock Units Plan (7)
41,452
—
—
Weighted average number of shares for diluted earnings per share
252,363,769
240,647,513
203,499,933
Basic earnings per share in Euro
0.49
0.22
(0.67)
Diluted earnings per share in Euro
0.48
0.21
(0.67)
For the year ended December 31, 2023 and 2022, the diluted weighted average number of shares outstanding was increased to take into consideration the theoretical effect of the potential ordinary shares relating to equity awards granted by the Group, to the extent to which they are dilutive. All potential ordinary shares are assumed converted into ordinary shares at the beginning of the period or, if later, at the date of grant of the potential ordinary shares. The adjustments for the calculation of the weighted average number of shares for diluted earnings per share are further explained below. For additional information see also Note 37 — Share-based payments.
(1)Long-Term Incentive Awards 2022-2025 — Performance share units (“PSUs”) and retention restricted share units (“RSUs”) granted to the Group’s senior management (excluding the CEO) (“Senior Management Team”), which in the case of the PSUs are considered to be potential ordinary shares if the performance conditions relating to Adjusted EBIT and adjusted net financial indebtedness/(cash surplus) targets would have been met based on the Group’s performance
F-48
up to the reporting date, and in the case of the RSUs are considered to be potential ordinary shares if the recipient was still employed by the Group at the reporting date.
(2)CEO 2022-2024 PSUs — Performance share units (PSUs) granted to the CEO, which are considered to be potential ordinary shares if the performance conditions relating to Adjusted EBIT and adjusted net financial indebtedness/(cash surplus) targets would have been met based on the Group’s performance up to the reporting date.
(3)CEO remuneration in shares — Potential ordinary shares from the exercise of the share purchase rights of all or part of the CEO’s fixed remuneration.
(4)IPO PSUs — PSUs related to the Company’s public listing, granted to the CEO and certain members of the Senior Management Team, which are considered to be potential ordinary shares if the performance market conditions have been met and if the recipient was still employed by the Group at the reporting date.
(5)Long-term equity incentives — Potential ordinary shares of the Company granted to Senior Management Team equal to a value of $7,500 thousand, that will be assigned in 2024, which are considered to be potential ordinary shares if the recipient was still employed by the Group at the reporting date.
(6)Non-executive directors remuneration in shares — Potential ordinary shares of the Company granted to the non-executive directors for 50% of their annual base remuneration for services provided in 2022 and 2023 and that will be assigned to the recipients in 2024 and 2025.
(7)2023 Restricted Stock Units Plan — RSUs granted to Senior Management Team, which are considered to be potential ordinary shares if the recipient was still employed by the Group at the reporting date.
For the year ended December 31, 2021, as a result of the loss for the year, in accordance with IAS 33, the theoretical effect that would arise if all the outstanding stock options and warrants were exercised (represented by 1,417,947 weighted average potentially diluted shares) were not taken into consideration in the calculation of diluted loss per share as this would have had an anti-dilutive effect.
13. Other information by nature
The following table provides a breakdown of depreciation and amortization and of personnel costs within the consolidated statement of profit and loss:
For the years ended December 31,
(€ thousands)
2023
2022
2021
Depreciation and amortization
Personnel costs
Depreciation and amortization
Personnel costs
Depreciation and amortization
Personnel costs
Cost of sales
(16,376)
(132,447)
(13,557)
(116,330)
(13,034)
(98,384)
Selling, general and administrative expenses
(174,905)
(344,421)
(157,050)
(270,845)
(140,165)
(262,053)
Marketing expenses
(1,889)
(10,276)
(1,275)
(7,912)
(996)
(7,325)
Total
(193,170)
(487,144)
(171,882)
(395,087)
(154,195)
(367,762)
At December 31, 2023 and 2022 the Group had 7,201 and 6,256, employees, respectively. Headcount increased mainly due to the TFI Acquisition (580 TFI employees and 45 Pelletteria Tizeta employees at December 31, 2023).
F-49
14. Intangible assets
The following table provides a breakdown for intangible assets:
(€ thousands)
Goodwill
Brands with an indefinite useful life
Concessions, licenses, trademarks and patents
Other intangible assets
Intangible assets in progress
Total
Historical cost at January 1, 2022
227,230
158,864
45,003
126,661
4,181
561,939
Additions
—
—
1,620
23,474
164
25,258
Disposals
—
—
(3,164)
(4,651)
(3,199)
(11,014)
Exchange differences
12,479
9,830
82
518
—
22,909
Other movements and reclassifications
—
—
(1,202)
1,202
—
—
Balance at December 31, 2022
239,709
168,694
42,339
147,204
1,146
599,092
Additions
—
—
1,777
21,598
633
24,008
Disposals
—
—
(369)
(431)
(166)
(966)
Business combinations
23,966
—
99,295
3,520
305
127,086
Exchange differences
(7,405)
(5,862)
(765)
(851)
(43)
(14,926)
Other movements and reclassifications
—
—
1,644
(1,000)
(1,769)
(1,125)
Balance at December 31, 2023
256,270
162,832
143,921
170,040
106
733,169
Accumulated amortization at January 1, 2022
—
—
(39,132)
(97,587)
—
(136,719)
Amortization
—
—
(1,457)
(10,926)
—
(12,383)
Disposals
—
—
2,761
4,122
—
6,883
Impairment
—
—
1
(27)
—
(26)
Exchange differences
—
—
838
(1,777)
—
(939)
Balance at December 31, 2022
—
—
(36,989)
(106,195)
—
(143,184)
Amortization
—
—
(3,963)
(15,190)
—
(19,153)
Disposals
—
—
369
413
—
782
Impairment
—
—
—
(35)
—
(35)
Exchange differences
—
—
164
531
—
695
Other movements and reclassifications
—
—
(929)
929
—
—
Balance at December 31, 2023
—
—
(41,348)
(119,547)
—
(160,895)
Carrying amount at:
January 1, 2022
227,230
158,864
5,871
29,074
4,181
425,220
December 31, 2022
239,709
168,694
5,350
41,009
1,146
455,908
December 31, 2023
256,270
162,832
102,573
50,493
106
572,274
The intangible assets held by the Group increased primarily as a result of the TFI Acquisition and goodwill arising from the acquisition of the Thom Browne business in South Korea of €23,966 thousand.
In particular, as part of the TFI Acquisition, the Group recognized a license agreement asset at its fair value of €99,295 thousand determined through an income approach based on the multi-period excess earnings method. The estimated useful life of the license agreement is 30 years, which includes the 20 guaranteed years as per the contract plus the automatic renewal period of 10 years which is subject to certain minimum performance conditions that management believes will be satisfied based on the business plan and information currently available. For additional information related to the acquisition of TFI and the Thom Browne business in South Korea, see Note 39 — Business combinations.
F-50
Goodwill and brands with an indefinite useful life
Goodwill originated on acquisitions made by the Group and brands with an indefinite useful life that are acquired separately are attributable to the following operating segments:
At December 31,
(€ thousands)
2023
2022
ZEGNA
25,568
25,568
Thom Browne
393,534
382,835
Total goodwill and brands with an indefinite useful life
419,102
408,403
In accordance with IAS 36, goodwill and brands with an indefinite useful life are not amortized and are tested for impairment annually, or more frequently if facts or circumstances indicate that the asset may be impaired. Goodwill and brands with an indefinite useful life are allocated to each of the Group’s CGUs (or groups of CGUs) and the recoverable amount of all CGUs and groups of CGUs is based on a value in use calculation, which uses cash flow projections based on last approved budget forecast calculations, which are prepared separately for each CGU. These budget and forecast calculations generally cover a period of three years. A long-term growth rate is calculated and applied to project future cash flows after the third year. In assessing value in use, the estimated future cash flows are discounted to their present value using a post-tax discount rate that reflects current market assessments of the time value of money and the risks specific to the asset.
The main assumptions to calculate the recoverable amount are the following:
•Terminal value: determined using the perpetuity method at a long-term growth rate which represents the present value, at the last year of projection, of all expected future cash flows, and the growth rate used to calculate the terminal value was 3% for the Zegna segment and 3% for the Thom Browne segment, which has been determined according to the diverging inflation and GDP outlook in related geographical areas;
•Discount rate: the rate used to discount cash flows was calculated using the weighted average cost of capital (“WACC”) post tax. For the 2023 impairment test, the WACC used for discounting purposes ranged between 8.81% and 9.55% (between 8.41% and 12.04% for 2022). The WACC was calculated for each CGU and group of CGUs subject to impairment, considering the parameters specific to the geographical area: market risk premium and sovereign bond yield;
•EBITDA: See table below for the EBITDA compound annual growth rate (CAGR) assumptions utilized to calculate the expected future cash flows.
The calculation of value in use for all CGUs and groups of CGUs is most sensitive to the following assumptions:
•Discount rates or WACC;
•Growth rates used to extrapolate cash flows beyond the forecast period; and
•EBITDA CAGR rate.
The following tables detail the sensitivity of the impairment testing to reasonably possible changes in both assumptions, for those CGUs that have significant goodwill and brands with an indefinite useful life allocated to them.
F-51
2023
Existing assumption
Sensitivity effects on headroom
(€ millions, except percentages and basis points)
Headroom
WACC (bps)
Growth rate (bps)
EBITDA CAGR (%) vs. 2023
WACC +100 bps
Growth rate -50 bps
EBITDA -500 bps
CGU Thom Browne Group (*)
484
881
300
+15.9%
317
403
405
CGU Thom Browne Korea Ltd.
31
905
300
n.a.
22
27
25
CGU Gruppo Dondi S.p.A.
51
955
300
+15.5%
39
45
46
CGU Bonotto S.p.A.
6
955
300
-9.5%
3
5
5
CGU In.Co. S.p.A.
39
955
300
+11.2%
20
30
30
CGU Tessitura Ubertino S.r.l.
20
955
300
-2.8%
16
18
18
_________________
(*) Excluding the Thom Browne business in South Korea, which is part of the CGU Thom Browne Korea Ltd.
2022
Existing assumption
Sensitivity effects on headroom
(€ millions, except percentages and basis points)
Headroom
WACC (bps)
Growth rate (bps)
EBITDA CAGR (%) vs. 2022
WACC +100 bps
Growth rate -50 bps
EBITDA -500 bps
CGU Thom Browne Group
454
841
300
+20.8%
362
372
381
CGU Gruppo Dondi S.p.A.
66
878
300
+7.0%
52
59
61
CGU Bonotto S.p.A.
3
878
300
-1.0%
0
2
2
CGU In.Co. S.p.A.
110
878
300
+2.2%
85
98
98
CGU Tessitura Ubertino S.r.l.
22
878
300
+6.6%
18
20
21
Based on the analysis performed, no impairment of goodwill and brands with an indefinite useful life were recognized for the years ended December 31, 2023 and 2022.
F-52
15. Property, plant and equipment
The following table provides a breakdown for property, plant and equipment:
(€ thousands)
Land and buildings
Plant and machinery
Industrial and commercial equipment
Leasehold improvements
Other tangible assets
Tangible assets under construction and advances
Total
Historical cost at January 1, 2022
8,537
164,539
144,831
228,904
8,710
3,428
558,949
Additions
11
6,171
11,121
27,081
153
3,637
48,174
Disposals
—
(17,130)
(12,341)
(18,874)
(200)
—
(48,545)
Exchange differences
—
(37)
5,117
(2,353)
24
(30)
2,721
Reclassifications
—
320
(769)
3,432
(947)
(2,036)
—
Balance at December 31, 2022
8,548
153,863
147,959
238,190
7,740
4,999
561,299
Additions
33
10,812
14,342
31,390
562
8,461
65,600
Disposals
—
(4,245)
(8,302)
(26,049)
(104)
(36)
(38,736)
Business combinations
—
238
6,781
12,094
1,328
158
20,599
Exchange differences
—
121
(2,515)
(10,812)
(23)
(358)
(13,587)
Reclassifications
—
966
4,235
6,752
(3,074)
(7,798)
1,081
Balance at December 31, 2023
8,581
161,755
162,500
251,565
6,429
5,426
596,256
Accumulated depreciation at January 1, 2022
(3,735)
(142,469)
(120,599)
(173,351)
(6,841)
(480)
(447,475)
Depreciation
(296)
(6,879)
(11,504)
(20,356)
(1,167)
—
(40,202)
Disposals
—
17,048
12,262
18,747
193
—
48,250
Impairment
—
(23)
(438)
1,217
—
—
756
Exchange differences
—
(71)
(1,437)
4,139
880
—
3,511
Reclassifications
6
71
(1,443)
17
869
480
—
Balance at December 31, 2022
(4,025)
(132,323)
(123,159)
(169,587)
(6,066)
—
(435,160)
Depreciation
(250)
(6,454)
(13,538)
(26,558)
(278)
—
(47,078)
Disposals
—
4,101
7,840
24,677
94
—
36,712
Impairment
—
4
(406)
(513)
—
—
(915)
Exchange differences
(162)
(92)
2,195
7,834
18
—
9,793
Reclassifications
—
63
(1,844)
—
1,781
—
—
Balance at December 31, 2023
(4,437)
(134,701)
(128,912)
(164,147)
(4,451)
—
(436,648)
Carrying amount at:
January 1, 2022
4,802
22,070
24,232
55,553
1,869
2,948
111,474
December 31, 2022
4,523
21,540
24,800
68,603
1,674
4,999
126,139
December 31, 2023
4,144
27,054
33,588
87,418
1,978
5,426
159,608
The assets amortized or depreciated on a systematic basis are tested for impairment if there are indications of or changes to planning assumptions suggesting that the carrying amount of the assets is not recoverable. For this purpose, after preparing the annual budget plan, the Group conducts a triggering event test for each store. If defined year-on-year profitability indicators are not reached, the non-current assets of the store in question are tested for impairment.
The method used to identify the recoverable amount (value in use) of all the aforementioned CGUs, except for the brands, consisted of discounting the projected cash flows (Discounted Cash Flow) generated by the activities directly attributable to the segment to which the intangible asset or net invested capital has been assigned (CGU). Value in use was
F-53
the sum of the present value of future cash flows expected from the business plan projections prepared for each CGU and the present value of the related operating activities at the end of the period (terminal value).
The business plans used to prepare the impairment test cover the last three months of 2023 and the three years from 2024 to 2026.
The rate used to discount cash flows was calculated using the weighted average cost of capital (WACC). For the year ended December 31, 2023, the WACC used for discounting purposes ranged between 8.64% and 12.56% (between 8.84% and 17.20% at December 31, 2022). The WACC was calculated for each CGU subject to impairment, considering the parameters specific to the geographical area: market risk premium and sovereign bond yield. The “g” rate of growth used to calculate the terminal value has been determined according to the diverging inflation and GDP outlooks in the various countries. The growth rate ranged between 2.0% and 3.0% for Zegna segment, between 2.5% and 3.0% for Thom Browne segment and 3.0% for Tom Ford Fashion segment.
DOS impairment test
The impairment test of DOS assets takes into consideration those right-of-use assets, intangible assets and property, and plant and equipment elements relating to directly operated stores of Zegna segment, Thom Browne segment and Tom Ford Fashion segment. The result of the impairment test of DOS on the consolidated financial statements is obtained by comparing the recoverable amount, based on the value in use, of each CGU with the carrying amount of the tangible and intangible assets allocated to the CGU, including leases (according to the IFRS 16).
Impairment of €1,782 thousand recognized in 2023 was composed of:
(a)impairment of €959 thousand and reversal of impairment of €44 thousand related to property, plant and equipment;
(b)impairment of €832 thousand related to right-of-use assets; and
(c)impairment of €37 thousand and reversal of impairment of €2 thousand related to intangible assets.
Impairment by segment, was composed of:
(a)impairment of €901 thousand and reversal of impairment of €46 thousand relating to the Zegna segment;
(b)impairment of €17 thousand related to the Thom Browne segment; and
(c)impairment of €910 thousand related to the Tom Ford Fashion segment
The calculation of value in use for this CGU is most sensitive to the following assumptions:
•Discount rates;
•Growth rates used to extrapolate cash flows beyond the forecast period;
•Revenue compounded annual rate of growth (“CAGR”).
In order to ensure that the changes to the main assumptions did not significantly affect the results of the impairment tests, sensitivity analyses were conducted.
F-54
The following tables present the sensitivity of the 2023 and 2022 Zegna, Thom Browne and Tom Ford Fashion segments DOS impairment test to reasonably possible changes in the aforementioned assumptions:
Existing assumption
Sensitivity effects on impairment
(€ millions, except percentages and basis points)
Impairment
WACC (%)
Growth rate (%)
Revenues CAGR (%) vs. current year
WACC +100 bps
Growth rate -50 bps
Revenues -250 bps
Zegna segment DOS
2023
(855)
8.64% / 12.56%
2.00% / 3.00%
+15.7%
(965)
(917)
(1,480)
2022
(2,231)
(1)
8.84% / 17.20%
1.50% / 5.00%
+7.6%
(2,413)
(2,258)
(2,714)
Thom Browne segment DOS
2023
(17)
11.16% / 12.56%
2.50% / 3.00%
+7.5%
(17)
(17)
(17)
2022
(820)
8.84% / 11.59%
1.50% / 3.00%
+9.5%
(1,003)
(848)
(1,120)
Tom Ford Fashion segment DOS
2023
(910)
11.27% / 12.16%
3.00%
+18.2%
(925)
(912)
(1,029)
_________________
(1)Gross of reversals related to the reduction of right-of-use assets of €1,412 thousand.
The sensitivity analysis of the aforementioned assumptions (WACC, growth rate and revenues) used to determine the recoverable value, carried out on the CGUs subject to impairment testing, showed that negative changes in the basic assumptions could lead to an additional impairment loss.
Impairment test of corporate assets
The impairment test of corporate assets takes into consideration those assets whose recoverability is assessed at the reporting segment level: Zegna segment (including corporate costs) and Thom Browne segment. There were no impairments arising from the 2023, 2022 and 2021 impairment tests performed.
Sensitivity analysis
The calculation of value in use for all CGUs is most sensitive to the following assumptions:
•Discount rates or WACC;
•Growth rates used to extrapolate cash flows beyond the forecast period;
•EBITDA growth rate over the explicit period of the business plan.
In order to ensure that the changes to the main assumptions did not significantly affect the results of the impairment tests, sensitivity analyses were conducted.
The following tables present the sensitivity analysis of the 2023 and 2022 impairment test of corporate assets to reasonably possible changes in aforementioned assumptions:
Existing assumption
Sensitivity effects on headroom
(€ millions, except percentages and basis points)
Headroom
WACC (bps)
Growth rate (bps)
EBITDA CAGR (%) vs current year
WACC +100 bps
Growth rate -50 bps
Revenues -250 bps
CGU Zegna segment
2023
2,036
898
300
+18.9%
1,588
1,822
1,741
2022
1,590
855
300
+16.3%
1,196
1,399
1,337
CGU Thom Browne segment
2023
484
881
300
+15.9%
317
403
405
2022
454
841
300
+20.8%
362
372
381
F-55
Based on the analysis performed, except for the impairments of non-current assets indicated above, these stress tests continued to show ample headroom.
16. Right-of-use assets
The following table provides a breakdown for right-of-use assets:
(€ thousands)
Land and buildings
Industrial and commercial equipment
Plant and machinery
Other right-of-use assets
Total
Historical cost at January 1, 2022
715,325
572
168
5,784
721,849
Additions
135,933
32
—
1,816
137,781
Disposals
(101,692)
(80)
—
(1,789)
(103,561)
Exchange differences
9,357
—
—
(18)
9,339
Balance at December 31, 2022
758,923
524
168
5,793
765,408
Additions
139,057
66
—
2,872
141,995
Disposals
(65,322)
(545)
—
(2,091)
(67,958)
Business combinations
160,659
—
—
210
160,869
Exchange differences
(22,284)
—
—
(19)
(22,303)
Balance at December 31, 2023
971,033
45
168
6,765
978,011
Accumulated amortization at January 1, 2022
(347,403)
(449)
(81)
(3,446)
(351,379)
Amortization
(117,488)
(117)
(34)
(1,658)
(119,297)
Impairments
(2,369)
—
—
—
(2,369)
Disposals
82,858
80
—
1,694
84,632
Exchange differences
(1,494)
—
—
7
(1,487)
Balance at December 31, 2022
(385,896)
(486)
(115)
(3,403)
(389,900)
Amortization
(125,096)
(75)
(35)
(1,733)
(126,939)
Impairments
(832)
—
—
—
(832)
Disposals
58,161
546
—
1,653
60,360
Exchange differences
13,229
—
—
23
13,252
Balance at December 31, 2023
(440,434)
(15)
(150)
(3,460)
(444,059)
Carrying amount at:
January 1, 2022
367,922
123
87
2,338
370,470
December 31, 2022
373,027
38
53
2,390
375,508
December 31, 2023
530,599
30
18
3,305
533,952
The Group leases various retail stores, warehouses, equipment and vehicles. Rental contracts are typically made for fixed periods of 1 year to 15 years but may have extension options. Contracts may contain both lease and non-lease components. Lease terms are negotiated on an individual basis and contain a wide range of different terms and conditions. The lease agreements do not impose any covenants other than the security interests in the leased assets that are held by the lessor. Extension options in a range of 1 year to 10 years are included in a number of property leases across the Group. These are used to maximize operational flexibility in terms of managing the assets used in the Group’s operations. Such extension options are exercisable only by the Group and not by the respective lessor. Other tangible assets mainly refer to vehicles.
For the years ended December 31, 2023 and 2022 impairments were recognized for an amount of €832 thousand and €2,369 thousand, respectively, and primarily related to leased stores in Greater China Region and Europe that are part of the Zegna segment, to a leased stores in Greater China Region that is part of the Tom Ford Fashion segment, for 2023 only, and to a leased stores in Europe that is part of the Thom Browne segment, for 2022 only. For details related to the impairment testing performed over right-of-use assets, please refer to Note 15 — Property, plant and equipment.
F-56
17. Investments accounted for using the equity method
The Group’s ownership percentages and the carrying value of investments accounted for using the equity method were as follows:
(€ thousands, except percentages)
Tom Ford International LLC
Pelletteria Tizeta S.r.l.
Norda Run Inc.
Filati Biagioli Modesto S.p.A.
Luigi Fedeli e Figlio S.r.l.
Total investments accounted for using the equity method
Group’s percentage interest at December 31, 2023
100
%
100
%
25
%
40
%
15
%
Group’s percentage interest at December 31, 2022
15
%
50
%
—
%
40
%
—
%
At January 1, 2022
18,345
3,416
—
686
—
22,447
Disposal
—
—
—
(2)
—
(2)
Net income
76
1,292
—
831
—
2,199
Translation differences
(1,996)
—
—
—
—
(1,996)
At December 31, 2022
16,425
4,708
—
1,515
—
22,648
Additions
1,845
—
6,580
6,700
4,656
19,781
Disposal
—
—
—
(13)
—
(13)
Net (loss)/income
(2,587)
350
(2)
(712)
(2)
(2,953)
Translation differences
764
—
43
—
—
807
Business combinations
(16,447)
(5,058)
—
—
—
(21,505)
At December 31, 2023
—
—
6,621
7,490
4,654
18,765
At December 31, 2022 and January 1, 2022, although the Group owned 15% of the equity shares of Tom Ford International LLC (“TFI”), the Group accounted for the investment under the equity method as the following requirements of IAS 28—lnvestments in Associates and Joint Ventures (“IAS 28”) were met: the representation on the board of directors and the participation in policy-making processes. Furthermore, there were material transactions between the Group and TFI. The results of impairment tests performed in 2021 and 2022 resulted in no impairment.
As a result of the TFI Acquisition completed on April 28, 2023, the Group obtained 100% of TFI and 100% of Pelletteria Tizeta, which was previously 50% owned by the Group and 50% owned by TFI. The Group’s previously held equity interests in TFI and Pelletteria Tizeta were measured at their fair value as of the acquisition date and recognized as part of the consideration transferred according to IFRS 3 — Business Combinations (“IFRS 3”). The cumulative translation losses related to the previously held investment in TFI, amounting to €4,705 thousand, were reclassified from other comprehensive income to profit and loss at the acquisition date as foreign exchange losses. Following completion of the TFI Acquisition, TFI and Pelletteria Tizeta are consolidated by the Group. For additional information relating to the TFI Acquisition see Note 39 — Business combinations.
Additions for the year ended December 31, 2023 included:
(i)€6,700 thousand for the capital increase in Filati Biagioli Modesto S.p.A, of which €4,500 thousand was contributed in cash and €2,200 thousand related to a financial receivables converted to equity as a capital contribution in July 2023;
(ii)€6,580 thousand for the acquisition of a 25% minority stake interest in Canadian technical trail running shoe company Norda which was completed on March 31, 2023;
(iii)€4,656 thousand for the acquisition of a 15% minority stake interest in Luigi Fedeli e Figlio S.r.l., the world-renowned maker of fine Italian knitwear and yarns; and
(iv)€1,845 thousand for the conversion of financial receivables from TFI into a capital contribution prior to the TFI Acquisition.
F-57
Certain financial information of companies accounted for using the equity method is provided below at and for the period from the acquisition date to December 31, 2023 or for the year ended December 31, 2023, as required by IFRS 12—Disclosure of Interest in Other Entities (“IFRS 12”).
(€ thousands)
Norda Run Inc.
Filati Biagioli Modesto S.p.A.
Luigi Fedeli e Figlio S.r.l.
Total assets
8,291
61,084
30,121
Total liabilities
2,871
42,266
21,592
Total equity
5,420
18,818
8,529
Net revenues
4,433
52,253
7,048
Net income/(loss)
(7)
(1,789)
(13)
18. Other non-current financial assets
The following table provides a breakdown for other non-current financial assets:
At December 31,
(€ thousands)
2023
2022
Guarantee deposits
28,362
26,814
Financial loans to related parties
—
2,240
Financial loans to TFI
—
1,862
Lease receivables from sublease
1,115
1,366
Other
4,421
3,958
Total other non-current financial assets
33,898
36,240
There are no expected credit losses associated with the guarantee deposits.
Financial loans to related parties consist of a loan to a company beneficially owned by a director of the Group in December 2021 for a principal amount of €2.2 million in order to acquire the Company’s ordinary shares in December 2021. In August 2023 the receivable was fully repaid.
Financial loans to TFI that were settled during the period. For additional information relating to TFI see Note 17 — Investments accounted for using the equity method.
Other primarily related to investments in other companies, which are measured at fair value at December 31, 2023 and 2022.
19. Inventories
The following table provides a breakdown for inventories (net of the provision for slow moving and obsolete inventories):
At December 31,
(€ thousands)
2023
2022
Raw materials, ancillary materials and consumables
90,460
61,822
Work-in-progress and semi-finished products
46,735
63,019
Finished goods
385,394
286,010
Total inventories
522,589
410,851
The amount of provisions for slow moving and obsolete inventories recognized for the years ended December 31, 2023, 2022 and 2021 was €59,558 thousand, €28,561 thousand and €29,600 thousand, respectively.
F-58
The following table provides the changes in the total provision for slow moving and obsolete inventories for the years ended December 31, 2023 and 2022.
2023
2022
At January 1,
(147,819)
(136,822)
Provisions
(59,558)
(28,561)
Utilizations and releases
27,708
22,707
Exchange differences and other changes
4,447
(5,143)
At December 31,
(175,222)
(147,819)
20. Trade receivables
The following table provides a breakdown for trade receivables:
At December 31,
(€ thousands)
2023
2022
Trade receivables
247,138
183,725
Loss allowance
(6,681)
(6,512)
Total trade receivables
240,457
177,213
The following table provides a breakdown for the loss allowance relating to trade receivables:
Loss allowance
(€ thousands)
2023
2022
At January 1,
(6,512)
(6,643)
Provisions
(3,276)
(806)
Utilizations
285
131
Releases
2,829
645
Exchange differences and other
(7)
161
At December 31,
(6,681)
(6,512)
The Group applies the simplified approach available under IFRS 9 to always measure the loss allowance for trade receivables at an amount equal to lifetime expected credit losses. The expected credit losses on trade receivables are estimated using a provision matrix by reference to past default experience of the debtor and an analysis of the debtor’s current financial position, adjusted for factors that are specific to the debtors, general economic conditions of the industry in which the debtors operate and an assessment of both the current as well as the forecast direction of conditions at the reporting date (See Note 35 — Qualitative and quantitative information on financial risks for additional information).
The Group has recognized a loss allowance of 100% against all receivables that are greater than 180 days past due because historical experience has indicated that these receivables are generally not recoverable, except in certain cases where the receivables are covered by insurance agreements. The Group generally writes off a trade receivable when there is information indicating that the debtor is in severe financial difficulty and there is no realistic prospect of recovery (e.g. when the debtor has been placed under liquidation or has entered into bankruptcy proceedings). None of the trade receivables that have been written off are subject to enforcement activities.
F-59
The following table presents trade receivables by geographic area:
At December 31,
(€ thousands)
2023
2022
EMEA (1)
102,653
77,817
of which Italy
60,174
50,897
North America (2)
38,636
24,523
of which United States
33,028
20,669
Latin America (3)
8,936
5,770
APAC (4)
90,232
69,103
of which Greater China Region
61,990
47,924
Total trade receivables
240,457
177,213
_________________
(1)EMEA includes Europe, the Middle East and Africa.
(2)North America includes the United States of America and Canada.
(3)Latin America includes Mexico, Brazil and other Central and South American countries.
(4)APAC includes the Greater China Region, Japan, South Korea, Thailand, Malaysia, Vietnam, Indonesia, Philippines, Australia, New Zealand, India and other Southeast Asian countries.
21. Derivative financial instruments
The Group enters into certain derivative contracts in the course of its risk management activities, primarily to hedge the interest rate risk on its bank debt and the currency risk on sales made in currencies other than the Euro. The Company only enters into these contracts for hedging purposes as the Group’s financial management policy does not permit trading in financial instruments for speculative purposes. Derivative financial instruments meeting the hedge requirements of IFRS 9 are accounted for using hedge accounting. Changes in the fair value of derivative financial instruments not qualifying for hedge accounting are recognized in profit or loss in the relevant reporting period. The interest rate and currency derivatives used by the Company are over the counter (OTC) instruments, meaning those negotiated bilaterally with market counterparties, and the determination of their current value is based on valuation techniques that use input parameters (such as interest rate curves, foreign exchange rates, etc.) observable on the market (level 2 of the fair value hierarchy defined in IFRS 13 — Fair Value Measurement).
Derivatives are measured at fair value each reporting date by taking as a reference the applicable foreign currency exchange rates or the interest rates and yield curves observable at commonly quoted intervals.
At the reporting date, the Group had outstanding hedges as detailed in the tables below:
At December 31, 2023
At December 31, 2022
(€ thousands)
Notional Amount
Positive Fair Value
Negative Fair Value
Notional Amount
Positive Fair Value
Negative Fair Value
Foreign currency exchange risk
Forward contracts
595,819
6,371
(897)
481,110
13,075
(2,362)
Interest rate risk
Interest rate swaps
133,962
4,739
—
320,000
9,379
—
Total derivatives instruments - Asset/(Liabilities)
729,781
11,110
(897)
801,110
22,454
(2,362)
Hedging derivatives
All contracts in place at the reporting date were entered into with major financial institutions, and no counterparties are expected to default. A liquidity analysis of the derivative contract maturities is provided in the financial risks section of these notes.
The cash flows resulting from the Group’s international activities are exposed to exchange rate volatility. In order to hedge this risk, the Group enters into forward sale and purchase agreements, so as to guarantee the value of identified cash flows in Euro (or in other currencies used locally). The projected future cash flows mainly relate to the collection of trade
F-60
receivables, the settlement of trade payables and financial cash flows. The notional amount of foreign exchange forward contracts to hedge projected future cash flows are detailed as follows:
For the years ended December 31,
(€ thousands)
2023
2022
USD
206,232
203,611
CHF
—
8,145
CNY
201,153
94,203
GBP
54,282
36,984
JPY
34,749
35,119
HKD
31,735
59,160
Other
67,668
43,888
Total notional amount
595,819
481,110
The key features of the interest rate swap (IRS) agreements are summarized as follows:
(€ thousands, except percentages)
Notional amount at December 31,
Fair value at December 31,
Contract
Maturity date
Fixed interest rate
2023
2022
2023
2022
IRS 1
1/27/2023
0.27%
—
20,000
—
67
IRS 2
2/8/2023
0.17%
—
20,000
—
45
IRS 3
4/27/2023
0.26%
—
50,000
—
428
IRS 4
8/3/2023
0.28%
—
40,000
—
676
IRS 5
11/17/2023
0.34%
—
60,000
—
1,564
IRS 6
4/15/2024
(0.24%)
80,000
80,000
2,190
3,775
IRS 7
12/20/2024
0.01%
50,000
50,000
2,380
2,824
IRS 8
9/30/2027
0.22%
2,775
—
128
—
IRS 9
12/31/2025
(0.15%)
1,187
—
41
—
Total
133,962
320,000
4,739
9,379
22. Other current financial assets
The following table provides a breakdown for other current financial assets (see Note 34 — Fair value measurement for a breakdown of other current financial assets by fair value level):
At December 31,
(€ thousands)
2023
2022
Securities
85,320
316,595
Guarantee deposits
5,431
2,075
Financial receivables
166
2,224
Total other current financial assets
90,917
320,894
F-61
The following table provides a breakdown for securities:
(€ thousands)
At December 31, 2022
Investments
Disposals
Fair value adjustments
Realized gains/(losses)
Exchange rate gains/(losses)
At December 31, 2023
FVPL
Private equity
18,311
3,035
(802)
2,266
—
(411)
22,399
Real estate funds
12,129
2,096
—
(1,887)
—
(192)
12,146
Private debt
13,644
1,001
(4,224)
(347)
32
—
10,106
Hedge funds
46,761
4,009
(42,658)
706
264
(87)
8,995
Money market funds
2,587
18,578
(19,038)
(71)
209
(172)
2,093
Equity
14,592
997
(14,999)
(159)
703
7
1,141
Insurance contracts
114,975
—
(115,485)
545
(35)
—
—
Fixed income
64,017
—
(65,018)
—
1,001
—
—
Commodities
2,727
—
(2,601)
—
(126)
—
—
Total FVPL
289,743
29,716
(264,825)
1,053
2,048
(855)
56,880
FVOCI
Floating income
17,742
—
(1,005)
(45)
—
—
16,692
Fixed income
9,110
3,884
(1,996)
304
446
—
11,748
Total FVOCI
26,852
3,884
(3,001)
259
446
—
28,440
Total securities
316,595
33,600
(267,826)
1,312
2,494
(855)
85,320
(€ thousands)
At December 31, 2021
Investments
Disposals
Fair value adjustments
Realized gains/(losses)
Exchange rate gains/(losses)
At December 31, 2022
FVPL
Private equity
15,925
6,230
(7,533)
3,282
17
390
18,311
Real estate funds
32,898
2,496
(24,633)
248
800
320
12,129
Private debt
7,945
5,201
—
498
—
—
13,644
Hedge funds
41,483
7,304
—
(2,631)
—
605
46,761
Money market funds
2,007
966
(370)
77
—
(93)
2,587
Equity
25,408
—
(7,101)
(3,354)
(590)
229
14,592
Insurance contracts
113,919
—
—
1,056
—
—
114,975
Fixed income
68,947
—
—
(4,930)
—
—
64,017
Commodities
—
2,991
—
(264)
—
—
2,727
Total FVPL
308,532
25,188
(39,637)
(6,018)
227
1,451
289,743
FVOCI
Floating income
20,687
—
(2,500)
(445)
—
—
17,742
Fixed income
5,025
5,000
—
(915)
—
—
9,110
Total FVOCI
25,712
5,000
(2,500)
(1,360)
—
—
26,852
Total securities
334,244
30,188
(42,137)
(7,378)
227
1,451
316,595
In line with the Group’s funding strategy, during 2023, the Group disposed of securities (primarily investments in insurance contracts, fixed income and hedge funds) amounting to €267,826 thousand for proceeds of €270,317 thousand that the Group primarily used to finalize the TFI Acquisition and for capital expenditures, as well as to repay borrowings.
23. Other current assets
Other current assets amount to €95,260 thousand and €84,574 thousand at December 31, 2023 and 2022, respectively, and mainly relate to accrued income, deferred charges and indirect tax receivables.
F-62
24. Cash and cash equivalents
The following table provides a breakdown for cash and cash equivalents:
At December 31,
(€ thousands)
2023
2022
Cash on hand
3,275
2,322
Bank balances
293,004
251,999
Total cash and cash equivalents
296,279
254,321
The Group may be subject to restrictions which limit its ability to use cash. In particular, cash held in China is subject to certain repatriation restrictions and may only be repatriated as dividends or capital distributions, or to repay debt or other liabilities. The Group does not believe that such transfer restrictions have any adverse impacts on its ability to meet liquidity requirements. Cash held in China at December 31, 2023 amounted to €22,549 thousand (€24,257 thousand at December 31, 2022). Certain restrictions over cash also exist in Argentina; however, such restrictions do not significantly impact the Group as cash held in Argentina amounted to €216 thousand at December 31, 2023 (€233 thousand at December 31, 2022).
25. Shareholder’ equity
Share capital and share premium
At December 31, 2023 the fully paid up share capital of the Company was €9,154 thousand, consisting of 302,704,726 ordinary shares and 154,981,350 special voting shares A, all with a nominal value of €0.02 (€5,939 thousand, consisting of 296,943,659 ordinary shares at December 31, 2022).
Each ordinary share confers the right to cast one vote. Holders of ordinary shares become entitled to special voting shares upon registering their ordinary shares in the loyalty register (thereby blocking such shares from trading on the NYSE) and maintaining them registered in such register for an uninterrupted period of time as prescribed by the articles of association of the Company. Ordinary shares carry the right to receive dividends and each ordinary share carries the right to repayment of capital in the event of dissolution and liquidation, with the remaining equity, after all debts are satisfied, for the benefit of the holders of ordinary shares in proportion to the aggregate nominal value of their ordinary shares. Ordinary shares carry preemptive rights in proportion to the aggregate number of ordinary shares held upon the issuance of new ordinary shares or the granting of rights to subscribe for ordinary shares, subject to certain exceptions.
If ordinary shares have been registered in the loyalty register for an uninterrupted period of two years in the name of the same shareholder, such shares become eligible to receive Special Voting Shares A of the Company. The relevant shareholder will receive one of the Company Special Voting Share A per eligible ordinary share. Each of the Company Special Voting Share A will automatically be converted into a Special Voting Share B of the Company after holding a number of ordinary shares for an uninterrupted period of five years following the registration of such ordinary shares in the loyalty register, and each of the Company Special Voting Share B will automatically be converted into a Special Voting Share C of the Company after holding a number of ordinary shares for an uninterrupted period of ten years following the registration of such ordinary shares in the loyalty register. Each class of the Company Special Voting Shares will entitle the relevant holders to the following number of votes, in addition to the voting rights attached to each ordinary share: each Special Voting Share A of the Company confers the right to cast one vote, each Special Voting Share B of the Company confers the right to cast four votes and each Special Voting Share C of the Company confers the right to cast nine votes in the Company General Meeting. Holders of the Company Special Voting Shares will not receive any dividends in respect of the Company Special Voting Shares; however, the Company will maintain a separate dividend reserve for each class of the Company Special Voting Shares for the sole purpose of the allocation of the mandatory minimum profits that accrue to the Company Special Voting Shares.
F-63
The following table summarizes the changes in the share capital, share premium and number of ordinary shares and special voting shares of the Company for the years ended December 31, 2022 and 2023:
Share capital (€ thousand)
Share premium (€ thousand)
Outstanding ordinary shares
Ordinary shares held in treasury
Total ordinary shares
Special voting shares
At January 1, 2022
5,939
721,187
242,343,659
54,600,000
296,943,659
—
Ordinary shares issued to warrant holders
—
—
1
(1)
—
—
Ordinary shares assigned under share-based payments (1)
—
—
459,086
(459,086)
—
—
At December 31, 2022
5,939
721,187
242,802,746
54,140,913
296,943,659
—
Ordinary shares issued to warrant holders (2)
115
64,500
5,761,067
—
5,761,067
—
Ordinary shares assigned delivered under share-based payments (3)
—
—
1,746,450
(1,746,450)
—
—
Special Voting Shares A issued (4)
3,100
(3,100)
—
—
—
154,981,350
At December 31, 2023
9,154
782,587
250,310,263
52,394,463
302,704,726
154,981,350
__________________
(1)Includes 459,086 ordinary shares, which were previously held in treasury, delivered to the CEO as a result of the conversion of the CEO’s fixed remuneration for 2021 for an aggregate purchase price of €3,390 thousand.
(2)The Company issued an aggregate of 5,761,067 newly issued ordinary shares as a result of the exercise of warrants in the first quarter of 2023. For additional information see Note 28 — Other current and non-current financial liabilities - Warrant liabilities.
(3)As a result of the vesting of certain equity incentive arrangements, ordinary shares, which were previously held in treasury, were assigned to participants of the share-based payments plans. It includes:
(a)588,000 ordinary shares delivered to the CEO under the CEO 2022-2024 LTIP in relation to the 2022 performance period;
(b)240,000 ordinary shares delivered to the CEO under the CEO IPO PSUs plan.
(c)450,000 ordinary shares delivered to the directors of the Group (excluding the CEO), key executives with strategic responsibilities and other employees of the Group under the Management IPO PSUs plan.
(d)468,450 ordinary shares delivered to the CEO under the right to convert the CEO’s fixed remuneration in shares of the Company for an aggregate purchase price of €3,654 thousand.
For additional information relating to the equity incentive arrangements of the Group, see Note 37 — Share-based payments.
(4)On December 18, 2023, upon the fulfillment of the conditions outlined in the Company’s Articles of Association 154,981,350 Special Voting Shares A were issued and delivered to Monterubello s.s. and Ermenegildo (Gildo) Zegna di Monte Rubello for no consideration.
Legal reserves
Legal reserves include the following:
•a translation reserve for the translation differences arising from the consolidation of subsidiaries with a functional currency different from the Euro;
•a cash flow hedge reserve for the changes in the fair value of derivative financial instruments held by the Group designated as a hedge of the exposure to variability in currency exchange rate and interest rate risk;
•gains and losses on the remeasurement of defined benefit plans for actuarial gains and losses arising during the period which are offset against the related net defined benefit liabilities;
•the financial assets at FVOCI reserve which arises from changes in the fair value of debt instruments held by the company under a hold to collect and sell business model, which will be reversed when the investment is derecognized or impaired;
F-64
•legal reserves for subsidiaries consisting of earnings of subsidiaries and associates that are subject to restrictions on distributions to the Company for €17,856 thousand at December 31, 2023 (€22,183 thousand at December 31, 2022) and capitalized development costs recognized by subsidiaries of the Company for €4,277 thousand at December 31, 2023 (€3,095 thousand at December 31, 2022).
Reserve for treasury shares
At December 31, 2023, the reserve for treasury shares amounted to €436,622 thousand (€451,174 thousand at December 31, 2022) and 52,394,463 ordinary shares were held in treasury (54,140,913 ordinary shares at December 31, 2022).
Other reserves
Other reserves are detailed as follows:
At December 31,
(€ thousands)
2023
2022
Share-based payments reserve
96,008
88,557
Non-controlling interests options reserve
(183,525)
(183,525)
Other
(66,479)
(74,764)
Other reserves
(153,996)
(169,732)
The non-controlling interests options reserve includes a reduction of equity attributable to shareholders of the Company resulting from the initial recognition of the financial liabilities at fair value (which are subsequently remeasured at the end of each period through the statement of profit and loss) relating to the put options held by non-controlling interests in Thom Browne Group for €162,066 thousand at December 31, 2023 and 2022 originally recognized in 2018 and Gruppo Dondi S.p.A. for €21,459 thousand at December 31, 2023 and 2022 originally recognized in 2019.
Retained earnings
Retained earnings include the Group’s accumulated earnings, less dividends paid to equity holders and other changes. Among other changes, retained earnings also include the first-time IFRS adoption reserve, reflecting the combined effects of the equity adjustments, net of tax effects, arising from the transition to IFRS from previous local GAAP, which occurred on January 1, 2018.
At the Annual General Meeting of the Shareholders held on June 27, 2023, the shareholders approved a dividend distribution of €0.10 per ordinary share, corresponding to a total dividend of €25,031 thousand. The dividend distribution was paid on July 28, 2023 and was made from the retained earnings reserve.
At the Annual General Meeting of the Shareholders held on June 28, 2022, the shareholders approved a dividend distribution of €0.09 per ordinary share, corresponding to a total dividend of €21,852 thousand. The dividend distribution was paid on July 28, 2022 and was made from the retained earnings reserve.
F-65
26. Non-controlling interests
The following tables show the financial information of consolidated companies not entirely controlled by the Group, as required by IFRS 12. The amounts disclosed for each subsidiary are before intercompany eliminations and at and for the year ended December 31, 2023 and 2022.
At and for the year ended December 31, 2023
(Functional currency thousands)
Country
Group’s percentage interest
Non- controlling interest percentage
Functional currency
Total assets
Total equity
Net revenues
Net income / (loss)
Dividends paid to non- controlling shareholders
Company
Thom Browne Inc.
U.S.A.
90%
10%
USD
378,736
199,275
411,192
49,988
—
Ermenegildo Zegna Vietnam LLC
Vietnam
90%
10%
VTD
42,201,273
27,134,951
40,281,928
5,446,184
—
Ermenegildo Zegna Madrid S.A.
Spain
70%
30%
EUR
4,591
1,811
5,412
34
—
Gruppo Dondi S.p.A.
Italy
65%
35%
EUR
39,369
22,387
44,588
3,935
(708)
E. Z. Thai Holding Ltd
Thailand
49%
51%
THB
12,338
(264)
—
(283)
—
Bonotto S.p.A.
Italy
60%
40%
EUR
25,596
10,974
25,657
2,709
(451)
Tessitura Ubertino S.r.l.
Italy
60%
40%
EUR
8,404
4,863
11,051
1,479
(600)
Cappellificio Cervo S.r.l.
Italy
51%
49%
EUR
2,186
938
3,281
119
(11)
Zegna South Asia Private LTD
India
51%
49%
INR
732,458
271,079
473,553
71,215
—
Zegna Gulf Trading LLC
UAE
49%
51%
AED
193,655
79,300
250,244
60,856
(17,150)
The Italian Fashion Co. LTD
Thailand
65%
35%
THB
238,912
(2,053)
255,389
14,880
—
Zegna for Retail of Readymade and Novelty Clothes W.L.L.
Kuwait
49%
51%
KWD
1,439
384
791
(227)
—
At and for the year ended December 31, 2022
(Functional currency thousands)
Country
Group’s percentage interest
Non- controlling interest percentage
Functional currency
Total assets
Total equity
Net revenues
Net income / (loss)
Dividends paid to non- controlling shareholders
Company
Thom Browne Inc.
U.S.A.
90%
10%
USD
298,901
146,879
348,445
43,277
(2,000)
Ermenegildo Zegna Vietnam LLC
Vietnam
90%
10%
VTD
59,373,311
21,638,614
45,647,540
7,913,295
—
Ermenegildo Zegna Madrid S.A.
Spain
70%
30%
EUR
3,718
1,741
3,838
120
(90)
Gruppo Dondi S.p.A.
Italy
65%
35%
EUR
39,469
20,507
47,655
4,901
(1,113)
E. Z. Thai Holding Ltd
Thailand
49%
51%
THB
12,669
19
—
(309)
—
Bonotto S.p.A.
Italy
60%
40%
EUR
23,739
9,431
24,552
2,075
(797)
Tessitura Ubertino S.r.l.
Italy
60%
40%
EUR
8,351
4,921
10,245
983
(312)
Cappellificio Cervo S.r.l.
Italy
51%
49%
EUR
1,630
864
2,371
85
—
Zegna South Asia Private LTD
India
51%
49%
INR
590,989
199,864
395,827
76,155
—
Zegna Gulf Trading LLC
UAE
49%
51%
AED
140,841
53,895
191,749
52,806
—
The Italian Fashion Co. LTD
Thailand
65%
35%
THB
198,556
(16,584)
190,048
11,015
—
F-66
27. Borrowings
The following table provides a breakdown for non-current and current borrowings:
2023
2022
(€ thousands)
Committed Loans
Other financial loans
Total borrowings
Committed Loans
Other financial loans
Total borrowings
At January 1,
470,627
428
471,055
578,213
50,725
628,938
Business combinations
21,258
8,632
29,890
—
—
—
Repayments
(298,256)
(7,894)
(306,150)
(109,422)
(50,297)
(159,719)
Proceeds
119,924
84,500
204,424
—
—
—
Other
3,403
—
3,403
1,836
—
1,836
At December 31,
316,956
85,666
402,622
470,627
428
471,055
Of which:
Non-current
113,244
41
113,285
184,661
219
184,880
Current
203,712
85,625
289,337
285,966
209
286,175
The repayment schedule for borrowings is summarized below:
(€ thousands)
At December 31, 2023
Year 1
Year 2
Year 3
Year 4
Year 5 and beyond
Committed loans
316,956
203,712
84,936
19,670
4,586
4,052
Other financial liabilities
85,666
85,625
41
—
—
—
Total borrowings
402,622
289,337
84,977
19,670
4,586
4,052
(€ thousands)
At December 31, 2022
Year 1
Year 2
Year 3
Year 4
Year 5 and beyond
Committed loans
470,627
285,966
137,206
35,387
3,994
8,074
Other financial liabilities
428
209
211
8
—
—
Total borrowings
471,055
286,175
137,417
35,395
3,994
8,074
Interest on certain of the Group’s borrowings is calculated based on variable rates. Management may use interest rate swaps (“IRS”) or other derivative financial instruments to hedge exposure to fluctuations in interest rates associated with monetary flows and not for speculative purposes. See Note 35 — Qualitative and quantitative information on financial risks for additional information related to the Group’s management of interest rate and other financial risks.
F-67
The following tables provide details relating to the Group’s individual borrowings.
At December 31, 2023
Borrower
Interest rate
Interest rate terms
Expiry date
of which current portion
of which non-current portion
(€ thousands)
Co.Ti Service S.A.
Fixed
0.75%
August 2025
—
20,000
Co.Ti Service S.A.
Fixed
0.75%
April 2025
—
10,000
Ermenegildo Zegna N.V.
Variable
IRS + 0.60%
December 2024
50,808
—
Ermenegildo Zegna N.V.
Variable
IRS + 0.81%
April 2024
81,351
—
Ermenegildo Zegna N.V.
Variable
Euribor 1m + 0.79%
May 2025
3,331
1,494
Ermenegildo Zegna N.V.
Fixed
0.73%
September 2028
3,979
16,034
Ermenegildo Zegna N.V.
Variable
Euribor 3m + 0.60%
February 2024
20,078
—
Ermenegildo Zegna N.V.
Variable
Euribor 6m + 0.77%
December 2026
33
19,988
Ermenegildo Zegna N.V.
Variable
Euribor 6m + 0.97%
December 2025
13
39,971
Ermenegildo Zegna N.V.
Variable
Euribor 3m + 0.80%
February 2024
40,234
—
Ermenegildo Zegna N.V.
Fixed
4.00%
February 2024
15,123
—
Ermenegildo Zegna N.V.
Variable
Euribor 1m + 0.05%
February 2024
19,592
—
Ermenegildo Zegna N.V.
Fixed
4.05%
March 2024
35,122
—
Ermenegildo Zegna N.V.
Fixed
4.05%
March 2024
15,052
—
Lanificio Ermenegildo Zegna e Figli S.p.A.
Fixed
1.35%
June 2024
109
31
Tom Ford Distribution S.r.l.
Fixed
1.57%
October 2026
124
232
Tom Ford Distribution S.r.l.
Variable
Euribor 3m + 0.80%
September 2024
384
—
Tom Ford Distribution S.r.l.
Fixed
2.20%
June 2026
143
220
Tom Ford Distribution S.r.l.
Variable
Euribor 3m + 1.48%
November 2026
199
408
Tom Ford Distribution S.r.l.
Variable
Euribor 3m + 1.48%
November 2026
399
815
Tom Ford Distribution S.r.l.
Fixed
1.60%
January 2027
101
217
Tom Ford Distribution S.r.l.
Fixed
2.02%
November 2026
124
255
Tom Ford Distribution S.r.l.
Variable
IRS + 3.09%
September 2027
716
2,035
Tom Ford Distribution S.r.l.
Variable
Euribor 1m + 0.45%
January 2024
1,000
—
Pelletteria Tizeta S.r.l.
Variable
Euribor 6m + 1.65%
September 2026
195
368
Pelletteria Tizeta S.r.l.
Fixed
2.02%
October 2026
99
204
Pelletteria Tizeta S.r.l.
Fixed
1.58%
July 2026
124
201
Pelletteria Tizeta S.r.l.
Fixed
1.63%
August 2026
122
207
Pelletteria Tizeta S.r.l.
Variable
IRS + 1.39%
December 2025
591
595
Other borrowings
Fixed
0.05% - 0.49%
Up to 2029
191
10
Total
289,337
113,285
of which fixed
70,413
47,611
of which variable
218,924
65,674
F-68
At December 31, 2022
Borrower
Interest rate
Interest rate terms
Expiry date
of which current portion
of which non-current portion
(€ thousands)
Ermenegildo Zegna N.V.
Variable
IRS + 1.48%
January 2023
20,099
—
Ermenegildo Zegna N.V.
Variable
IRS + 0.80%
February 2023
20,000
—
Ermenegildo Zegna N.V.
Fixed
0.77%
March 2023
15,000
—
Ermenegildo Zegna N.V.
Fixed
0.49%
April 2023
50,042
—
Ermenegildo Zegna N.V.
Variable
Euribor 6m + 0.75%
May 2023
45,139
—
Ermenegildo Zegna N.V.
Variable
Euribor 6m + 0.86%
June 2023
6,250
—
Ermenegildo Zegna N.V.
Variable
IRS + 1.05%
August 2023
40,168
—
Ermenegildo Zegna N.V.
Variable
IRS + 0.78%
November 2023
60,139
—
Ermenegildo Zegna N.V.
Variable
Euribor 6m + 0.78%
November 2023
5,000
—
Ermenegildo Zegna N.V.
Fixed
1.22%
November 2023
20,000
—
Ermenegildo Zegna N.V.
Variable
IRS + 0.81%
April 2024
409
79,986
Lanificio Ermenegildo Zegna e Figli S.p.A.
Fixed
1.35%
June 2024
194
195
Ermenegildo Zegna N.V.
Variable
IRS + 0.60%
December 2024
200
49,951
Co.Ti Service S.A.
Fixed
0.75%
March 2025
—
20,000
Co.Ti Service S.A.
Fixed
0.75%
April 2025
—
10,000
Ermenegildo Zegna N.V.
Variable
Euribor 1m + 0.77%
May 2025
3,324
4,750
Ermenegildo Zegna N.V.
Fixed
0.73%
September 2028
33
19,973
Other borrowings
Fixed
0.05% - 0.49%
Up to 2029
178
25
Total
286,175
184,880
of which fixed
85,447
50,193
of which variable
200,728
134,687
At December 31, 2023, the Group has committed revolving lines amounting to an aggregate of €335 million with a maturity ranging between 5 to 7 years (€240 million at December 31, 2022 with a maturity of 7 years). A portion of the committed revolving lines (€190 million) have interest rates linked to the following two important Environment, Social and Governance (“ESG”) targets previously disclosed by the Group: (i) at least 50% of top priority raw materials are traced to their geography of origin and from lower-impact sources by 2026; and (ii) 100% of the electricity is from renewable sources in Europe and the United States by 2024. The lines were drawn down for €40 million at December 31, 2023 (undrawn at December 31, 2022).
28. Other current and non-current financial liabilities
The following table provides a breakdown for other current and non-current financial liabilities:
At December 31,
(€ thousands)
2023
2022
Written put options on non-controlling interests
136,466
178,766
of which Thom Browne option
116,456
155,551
of which Dondi option
20,010
23,215
Other
90
27
Other non-current financial liabilities
136,556
178,793
Written put options on non-controlling interests
22,102
—
of which Thom Browne option
22,102
—
Warrant liabilities
—
37,258
Other current financial liabilities
22,102
37,258
Total
158,658
216,051
F-69
Written put options on non-controlling interests
Thom Browne
The Group is party to an option agreement which provides Mr. Thom Browne a put option giving him the right to sell to the Group his remaining 10% interest in the Thom Browne Group not owned by the Group, in three tranches. The exercise price of the option is established as the EBITDA of the Thom Browne Group recorded in 2023, 2028 and 2030, multiplied by a given multiple (“TB Exercise Formula”). The financial liability arising from the obligation of the Group to purchase the non-controlling interest in the Thom Browne Group is measured at the present value of the expected exercise amount, calculated through the TB Exercise Formula as per projections contained in the latest business plan, which cover the period from 2024 to 2026. The liability was initially recognized against equity for €162,066 thousand, which was related to the put option of the 15% interest, and is remeasured at each reporting date in profit or loss based on the latest available information. In June 2021, the Group purchased an additional 5% of the Thom Browne Group for a total consideration of €30,653 thousand, following which the Group owns 90% of the Thom Browne Group. The liability related to this written put option at December 31, 2023 amounted to €138,558 thousand, of which €22,102 thousand was classified as current (relating to the first tranche representing 2% of the non-controlling interests that is based on 2023 EBITDA of the Thom Browne Group) and €116,456 thousand was classified as non-current (relating to the second and third tranches representing 5% and 3% of the non-controlling interests that are based on 2028 and 2030 EBITDA of the Thom Browne Group, respectively (€155,551 thousand at December 31, 2022 relating to all three tranches).
Dondi
The Group is party to an option agreement which provides the Dondi family with a put option giving them the right to sell to the Group the Dondi family’s remaining 35% interest in Dondi not owned by the Group, in two tranches in 2029 and 2034. The exercise price of the option is established as the EBITDA of Dondi at the exercise date, less its net indebtedness, multiplied by a given multiple less a given discount (“Dondi Exercise Formula”). The financial liability arising from the obligation is measured at the present value of the expected exercise amount, calculated through the Dondi Exercise Formula as per projections contained in the approved Business Plan. The remeasurement of the liability at each reporting date is recognized through profit or loss based on the latest available information. The liability related to this written put option at December 31, 2023 amounted to €20,010 thousand and was classified as non-current (€23,215 thousand at December 31, 2022).
Warrant liabilities
On February 27, 2023, the Group completed the previously announced redemption of its outstanding public and private placement warrants to purchase ordinary shares of the Company that remained outstanding at 5:00 p.m. New York City time on February 27, 2023 (the “Redemption Date”), following which (i) 408,667 warrants were exercised by the warrant holders at an exercise price of $11.50 per ordinary share and the Group received total cash proceeds of $4.7 million in exchange for 408,667 newly issued ordinary shares, and (ii) 19,322,846 warrants were exercised by the warrant holders on a cashless basis in exchange for 0.277 ordinary shares of the Company per warrant, with the Company issuing an aggregate of 5,761,067 newly issued ordinary shares. As a result of these transactions, approximately 98% of the outstanding warrants were exercised, of which approximately 2% were exercised for cash and approximately 96% were exercised on a cashless basis. The remaining 385,123 warrants remained unexercised on the Redemption Date and were redeemed by the Company for cash at a redemption price of $0.10 per warrant in accordance with the terms of the related warrant agreements, for a total of $38.5 thousand.
Following the aforementioned transactions, there are no remaining public or private placement warrants outstanding. At December 31, 2022, 13,416,636 public warrants and 6,700,000 private warrants were outstanding. The warrants were assumed by the Company from Investindustrial Acquisition Corp. (IIAC) as part of the Business Combination completed in December 2021.
F-70
29. Lease liabilities
The following table provides a breakdown for lease liabilities.
(€ thousands)
2023
2022
At January 1,
443,507
438,052
Interest expense
17,030
9,882
Repayment of lease liabilities (including interest expense)
(142,762)
(124,321)
Business combinations
160,869
—
IFRS 16 lease amendment: lease renegotiation
—
(7,194)
Additions due to new leases and store renewals
142,005
140,875
Decrease of lease liabilities due to store closures
(14,750)
(21,726)
Translation differences
(12,174)
7,939
At December 31,
593,725
443,507
Of which:
Non-current
471,083
332,050
Current
122,642
111,457
In certain countries, leases for stores entail the payment of both minimum amounts and variable amounts, especially for stores with lease payments indexed to revenue. As required by IFRS 16, only the minimum fixed lease payments are capitalized.
The following table summarizes the lease liabilities by maturity date:
(€ thousands)
At December 31,
Year 1
Year 2
Year 3
Year 4
Beyond
2023
593,725
122,642
102,631
82,248
68,876
217,328
2022
443,507
111,457
91,081
62,502
46,528
131,939
See Note 35 — Qualitative and quantitative information on financial risks—Liquidity risks for information relating to the contractual cash flows of the Group’s lease agreements.
30. Provisions for risks and charges
The provisions for risks and charges, which amount to €35,868 thousand in 2023 (€33,550 thousand in 2022), represent management’s best estimate of the amount of potential liabilities. In the Directors’ opinion, based on the information available to them, the total amount allocated for risks and charges at the reporting date is adequate in respect of the liabilities that could arise from the underlying circumstances.
F-71
The following tables show the movement of the provision for risks and charges in 2023 and 2022:
(€ thousands)
Legal and fiscal risks
Leased store restoration
Refund liability returns
Other provisions
Total provisions
At January 1, 2023
664
14,808
9,546
8,532
33,550
of which current
—
909
9,546
3,514
13,969
of which non-current
664
13,899
—
5,018
19,581
Provisions
390
2,782
8,373
—
11,545
Releases
(159)
(1,533)
(94)
(2,810)
(4,596)
Utilizations
(119)
(1,515)
(4,547)
(539)
(6,720)
Exchange differences
43
(966)
(282)
31
(1,174)
Business Combination
—
3,254
250
—
3,504
Reclassifications and other
(49)
(25)
(154)
(13)
(241)
At December 31, 2023
770
16,805
13,092
5,201
35,868
of which current
136
672
13,092
2,119
16,019
of which non-current
634
16,133
—
3,082
19,849
The Group is a defendant in various other legal and fiscal lawsuits arising in the ordinary course of business. It is the opinion of the management of the Company that it has meritorious defenses against all such outstanding claims, which the Company will vigorously pursue, and that the outcome of such claims, individually or in the aggregate, will not have a material adverse effect on the Group’s consolidated financial position or results of operations, except as otherwise described above.
31. Employee benefits
The following table presents a breakdown of employee benefits.
At December 31,
(€ thousands)
2023
2022
Italian leaving indemnities (TFR)
10,507
7,613
Other leaving indemnities
10,392
10,486
Post-employment benefits
7,247
5,675
Other long-term employee benefits
1,165
1,469
Termination benefits
334
311
Total defined benefit obligations
29,645
25,554
Other long-term payables to employees
—
26,030
Total employee benefits
29,645
51,584
F-72
Defined benefit obligations
The following table shows the changes in defined benefit obligations.
(€ thousands)
2023
2022
At January 1,
25,554
32,029
Changes through statement of profit and loss
5,236
3,280
- of which: Service cost
4,342
3,018
- of which: Financial charges
894
262
Changes through statement of comprehensive income and loss
(1,838)
(755)
- of which: Actuarial (gain)/loss
(1,376)
(1,220)
- of which: Translation differences
(462)
465
Benefits paid
(2,566)
(8,676)
Business Combination
3,259
—
Reclassifications and other
—
(324)
At December 31,
29,645
25,554
Italian leaving indemnities relate to the Italian employee severance indemnity (“TFR”) obligation required under Italian Law and other leaving indemnities primarily relate to leaving indemnities relating to the Group’s subsidiaries in Spain and China.
The following table summarizes the main financial assumptions used in determining the present value of the TFR and other leaving indemnities.
At December 31, 2023
At December 31, 2022
Italy
Spain
China
Italy
Spain
China
Discount rate
2.90% / 3.40%
3.00% / 3.30%
2.60%
3.60% / 3.80%
3.70% / 3.80%
2.80% / 2.90%
Inflation rate
2.00% / 3.00%
2.00%
1.50% / 9.00%
2.00% / 3.00%
1.00%
5.50% / 8.00%
Turn-over rate
1.00% / 10.00%
4.00% / 5.00%
2.00% / 4.50%
0.50% / 7.90%
2.50% / 4.00%
3.50% / 5.50%
In determining the defined benefit obligations of the Group’s Italian companies, the Group used the Italian National Institute of Statistics (“ISTAT”) benchmark for the estimated mortality rates in Italy, broken down by age and gender, while for defined benefit obligations of the Group’s non-Italian companies, the Group used the standard mortality rate benchmark for each individual country, broken down by age and gender. Estimated annual staff turnover rates have been calculated based on the individual companies’ data.
The following table presents a quantitative sensitivity analysis for the main assumptions relating to the Group’s main employee benefit obligations and service costs.
At December 31, 2023
At December 31, 2022
+50 bps
-50 bps
+50 bps
-50 bps
+50 bps
-50 bps
+50 bps
-50 bps
(€ thousands)
Employee benefit obligations
Service costs
Employee benefit obligations
Service costs
Discount rate
(797)
854
(107)
116
(720)
770
(109)
60
Inflation rate
728
(689)
113
(105)
680
(645)
61
(111)
Turn-over rate
2,209
(3,292)
381
(570)
2,511
(3,708)
372
(582)
The average duration of the defined benefit obligations for the Italian TFR at the end of the reporting period was 8.7 years (2022: 7.8 years), for leaving indemnities in China was 9.9 years (2022: 10.5 years) and for leaving indemnities in Spain was 9.7 years (2022: 8.2 years).
Post-employment benefits at December 31, 2023 and 2022 primarily relate to the Group’s CEO.
F-73
Other long-term payables to employees
Other long-term payables at December 31, 2022 include €24,855 thousand related to bonuses earned by Senior Management Team which were expected to be paid in 2024 in accordance with the related contractual terms, which was classified as due to employees within other current liabilities at December 31, 2023.
In 2023, the Group modified the contractual terms of the agreement in order to entitle Senior Management Team to settle a portion of the bonus in ordinary shares equal to a value of $7,500 thousand in 2024. As a result, the compensation that will be settled in ordinary shares is accounted for as equity-settled share-based compensation and measured at the fair value of the related compensation, with an offsetting increase to equity of €6,562 thousand.
32. Trade payables and customer advances
The following table provides a breakdown for trade payables and customer advances:
At December 31,
(€ thousands)
2023
2022
Trade payables
261,099
220,789
Customer advances
53,038
50,147
Total trade payables including customer advances
314,137
270,936
33. Other current and non-current liabilities
The following table provides a breakdown for other current and non-current liabilities:
At December 31,
(€ thousands)
2023
2022
Due to employees
90,864
44,705
VAT and other taxes
25,100
15,102
Accrued expenses
28,512
23,162
Social security institutions
21,260
11,660
Deferred income
9,790
7,650
Other current liabilities
29,487
16,549
Total other current liabilities
205,013
118,828
Other non-current liabilities
9,689
—
Total other non-current liabilities
9,689
—
Amounts due to employees include deferred compensation, accrued and untaken leave and related social contributions. At December 31, 2023, €43,034 thousand related to bonuses earned by key management that are expected to be paid in 2024 are also included in the amounts due to employees.
Accrued expenses primarily include payroll accruals and rental expenses.
At December 31, 2023, other current and non-current liabilities include deferred consideration related to the acquisition of the Thom Browne business in South Korea in 2023 of €18,991 thousand, of which €9,302 thousand is expected to be paid in 2024 and was classified as current and €9,689 thousand is expected to be paid in 2025 and was classified as non-current. For additional information see Note 39 — Business combinations.
Other current liabilities also include the Company’s Board of Directors for board fees, liabilities relating to customs and vouchers and other sundry amounts as well as, for 2022 only, the remaining 50% of the contingent consideration for the acquisition of Tessitura Ubertino subject to the company achieving certain predetermined operating performance targets for the year 2022. As a result of the operating performance targets achieved in 2022, the remaining 50% portion of the earn-out payment, amounting to €585 thousand was paid in cash in 2023.
F-74
34. Fair value measurement
The reported amount of derivative instruments, whether assets or liabilities, reflects their fair value at the reporting date.
The carrying amount of cash and cash equivalents, financial assets and trade receivables, as adjusted for impairment where necessary as required by IFRS 9, approximates their estimated realizable value and their fair value. Lease liabilities are reported at present value, while all of the other financial liabilities recorded at amortized cost approximate fair value.
For units in investment funds sensitivity has not been calculated as the valuation is made on the basis of the latest available net asset value (NAV).
Categories of financial assets and liabilities according to IFRS 7
The following tables provide a breakdown for financial assets by category at December 31, 2023:
At December 31, 2023
Financial assets
Fair value Level
(€ thousands)
FVPL
FVOCI
Amortized cost
Total
Note
1
2
3
Derivative financial instruments
—
11,110
—
11,110
21
—
11,110
—
Cash and cash equivalents
—
—
296,279
296,279
24
—
296,279
—
Trade receivables
—
—
240,457
240,457
20
—
240,457
—
Other non-current financial assets
4,421
—
29,477
33,898
18
—
30,133
3,765
Other current financial assets
56,880
28,440
5,597
90,917
22
29,581
7,970
53,366
Total Financial assets
61,301
39,550
571,810
672,661
29,581
585,949
57,131
The following table provides an additional breakdown for other current financial assets at December 31, 2023:
At December 31, 2023
Financial assets
Fair value Level
(€ thousands)
FVPL
FVOCI
Amortized cost
Total
1
2
3
Private equity
22,399
—
—
22,399
—
—
22,399
Money market funds and floating income
2,093
16,692
—
18,785
16,692
2,093
—
Real estate funds
12,146
—
—
12,146
—
—
12,146
Fixed income
—
11,748
—
11,748
11,748
—
—
Private debt
10,106
—
—
10,106
—
280
9,826
Hedge funds
8,995
—
—
8,995
—
—
8,995
Guarantee deposits
—
—
5,431
5,431
—
5,431
—
Equity
1,141
—
—
1,141
1,141
—
—
Financial receivables
—
—
166
166
—
166
—
Total other current financial assets
56,880
28,440
5,597
90,917
29,581
7,970
53,366
F-75
The following table presents the changes in level 3 items for the years ended December 31, 2023 and 2022:
(€ thousands)
Fair value Level 3
2023
2022
At January 1
215,727
201,290
Investments
10,140
21,343
Disposals
(169,645)
(12,529)
Fair value adjustments
1,647
4,355
Realized gains
(49)
254
Exchange rate gains
(689)
1,014
At December 31
57,131
215,727
The fair value of Level 2 items is mainly estimated on the basis of data provided by pricing services (non-active markets) and the fair value of Level 3 items is estimated on the basis of the last available NAV.
At December 31, 2022
Financial assets
Fair value Level
(€ thousands)
FVPL
FVOCI
Amortized cost
Total
Note
1
2
3
Derivative financial instruments
—
22,454
—
22,454
21
—
22,454
—
Cash and cash equivalents
—
—
254,321
254,321
24
—
254,321
—
Trade receivables
—
—
177,213
177,213
20
—
177,213
—
Other non-current financial assets
3,958
—
32,282
36,240
18
—
32,861
3,379
Other current financial assets
289,743
26,852
4,299
320,894
22
30,076
78,470
212,348
Total Financial assets
293,701
49,306
468,115
811,122
30,076
565,319
215,727
The following table provides an additional breakdown for other current financial assets at December 31, 2022:
At December 31, 2022
Financial assets
Fair value Level
(€ thousands)
FVPL
FVOCI
Amortized cost
Total
1
2
3
Insurance contracts (*)
114,975
—
—
114,975
—
—
114,975
Fixed income
64,017
9,110
—
73,127
9,110
47,114
16,903
Hedge funds
46,761
—
—
46,761
—
10,116
36,645
Real estate funds
12,129
—
—
12,129
—
—
12,129
Equity
14,592
—
—
14,592
497
14,095
—
Money market funds and floating income
2,587
17,742
—
20,329
17,742
2,587
—
Private equity
18,311
—
—
18,311
—
—
18,311
Private debt
13,644
—
—
13,644
—
259
13,385
Commodities
2,727
—
—
2,727
2,727
—
—
Guarantee deposits and others
—
—
2,075
2,075
—
2,075
—
Financial receivables
—
—
2,224
2,224
—
2,224
—
Total other current financial assets
289,743
26,852
4,299
320,894
30,076
78,470
212,348
_________________
*A sensitivity analysis was performed at December 31, 2022 on the fair value of the Group’s insurance contracts (recorded within other current financial assets), with the support of an external actuarial expert, using the discounted cash flow method. The main assumptions used to perform the sensitivities are: (i) the vector of prospective returns is calculated from the last certified management rate (known at the valuation date) assuming a trend to the market forward rate, consistent with the current Italian government curve; (ii) the target duration has been assumed to be 5 years; (iii) the prospective investment returns are netted against the management fees; (iv) the cash flow projection was made in line with the underlying contractual conditions; (v) a probability of surrender has been assumed, based on market data and depending on the type of insurance contract considered, ranging from 5.61% to 8.31%. Based on the analysis performed, no significant differences from fair value were noted.
The fair value of Level 2 items is mainly estimated on the basis of data provided by pricing services (non-active markets) and the fair value of Level 3 items is estimated on the basis of the last available NAV.
F-76
The following tables provide a breakdown for financial liabilities by category:
At December 31, 2023
Financial liabilities
Fair value Level
(€ thousands)
FVPL
FVOCI
Amortized cost
Total
Note
1
2
3
Derivative financial instruments
—
897
—
897
21
—
897
—
Non-current borrowings
—
—
113,285
113,285
27
—
113,285
—
Current borrowings
—
—
289,337
289,337
27
—
289,337
—
Other non-current financial liabilities
136,466
—
90
136,556
28
—
136,466
90
Other current financial liabilities
22,102
—
—
22,102
28
—
22,102
—
Trade payables and customer advances
—
—
314,137
314,137
32
—
314,137
—
Lease liabilities – Current / Non-current
—
—
593,725
593,725
29
—
—
593,725
Financial liabilities
158,568
897
1,310,574
1,470,039
—
876,224
593,815
At December 31, 2022
Financial liabilities
Fair value Level
(€ thousands)
FVPL
FVOCI
Amortized cost
Total
Note
1
2
3
Derivative financial instruments
—
2,362
—
2,362
21
—
2,362
—
Non-current borrowings
—
—
184,880
184,880
27
—
184,880
—
Current borrowings
—
—
286,175
286,175
27
—
286,175
—
Other non-current financial liabilities
178,766
—
27
178,793
28
—
178,766
27
Other current financial liabilities
37,258
—
—
37,258
28
37,258
—
Trade payables and customer advances
—
—
270,936
270,936
32
—
270,936
—
Lease liabilities – Current / Non-current
—
—
443,507
443,507
29
—
—
443,507
Financial liabilities
216,024
2,362
1,185,525
1,403,911
—
960,377
443,534
35. Qualitative and quantitative information on financial risks
The Group is exposed to several financial risks connected with its operations:
•financial market risk, primarily related to foreign currency exchange rates, interest rates and commodity prices;
•liquidity risk relating to the availability of funds and access to credit, if required, and to financial instruments in general;
•credit risk relating to counterparties failing to repay amounts owed or meet contractual obligations.
These risks could significantly affect the Group’s financial position, results of operations and cash flows, and for this reason the Group identifies and monitors these risks, in order to detect potential negative effects in advance and take the necessary action to mitigate them, primarily through the Group’s operating and financing activities and if required, through the use of derivative financial instruments.
A summary of qualitative and quantitative factors relating to these risks is provided below. The quantitative data reported in the following section does not have any predictive value. In particular, the sensitivity analysis on finance market risks does not reflect the complexity of the market or the reaction which may result from any changes that are assumed to take place.
Foreign currency risk
The Group operates in numerous markets worldwide and is exposed to market risks stemming from fluctuations in currency exchange rates. The exposure to currency risk is mainly linked to the differences in geographic distribution of the Group’s sourcing and manufacturing activities from those in its commercial activities, as a result of which its cash flows from sales are denominated in currencies different from those related to purchases or production activities. In particular, the Group incurs a large portion of its capital and operating expenses in Euro (which is the Group’s functional and presentation
F-77
currency) while it receives the majority of its revenues in currencies other than Euro (mainly in Chinese Renminbi, U.S. Dollars, Japanese Yen, United Arab Emirates Dirham and British Pound). Risk management is mainly centralized at the Group’s distribution companies. Goods transferred for consideration to associates are settled directly in the currency of the country where they operate and sell (with the exception of countries where local currency cannot be delivered outside the country). This creates the risk that the corresponding value in Euro of revenues at the moment of collection is insufficient to cover production costs or to achieve the desired profit margin. This risk is heightened during the period between the moment when the sale prices of a collection are set and the moment when revenues are converted into Euro, which may extend up to 18 months. For the Zegna and the Tom Ford Fashion segments, the Group manages risks associated with fluctuations in currency through financial hedging instruments, mainly forward contracts for the sale of foreign currencies, in order to establish the conversion rate in advance, or a predefined range of conversion rates at future dates. The Group continues to implement similar policies also for the Thom Browne segment, which has become more exposed to currency impact as it expands into international markets. For the years ended December 31, 2023, 2022 and 2021 the Zegna segment covered its exchange rate risk almost exclusively with currency forward exchange contracts. To this end, before the preparation of the price list and based on market expectations and conditions, the Group arranges hedges that cannot exceed 50% - 60% of forecast sales in foreign currencies. In the period following the preparation of the price list, the total outstanding hedge is adjusted on the basis of market conditions and of the orders effectively managed and entered into production.
In addition, the Group controls and hedges exposure deriving from changes due to exchange rate changes in the value of assets or liabilities denominated in currencies other than the accounting currency of the individual company (typically intercompany financial receivables/payables), which may affect the Group’s net results, through financial instruments, whose recognition in accordance with IFRS follows the rules of fair value hedges: the profit or loss arising from subsequent remeasurements of the fair value of the hedging instrument and the hedged item are recorded within profit and loss. The hedges of the Group’s future transactions in foreign currencies (which can be classified as cash flow hedges pursuant to IFRS) are accounted for in accordance with hedge accounting rules.
The Group has estimated the potential effects of a shock change of +/-5% on the main currencies to which the Group is exposed at each reporting date, by using internal assessment models based on generally accepted principles.
The following table presents the potential effects on profit before tax of a hypothetical change of +/- 500 bps in year-end exchange-rates, applied to the Group’s net balances of trade receivables and trade payables in foreign currencies.
At December 31, 2023
At December 31, 2022
(€ thousands, except basis points)
Trade receivables and trade payables
+500 bps
-500 bps
Trade receivables and trade payables
+500 bps
-500 bps
Currency
Impact on profit before tax
Impact on profit before tax
USD
145,836
(6,945)
7,676
59,523
(2,834)
3,133
JPY
22,735
(1,083)
1,197
17,055
(812)
898
CNY
113,962
(5,427)
5,998
43,398
(2,067)
2,284
HKD
24,843
(1,183)
1,308
19,139
(911)
1,007
GBP
16,283
(775)
857
(2,227)
106
(117)
SGD
7,965
(379)
419
9,496
(452)
500
CHF
(25,940)
1,235
(1,365)
(9,285)
442
(489)
KRW
23,753
(1,131)
1,250
n.a.
n.a.
n.a.
Total
329,437
(15,688)
17,340
137,099
(6,528)
7,216
The following table presents the potential impact on profit before tax of a hypothetical change of +/- 500 bps in year-end exchange-rates, applied to the Group’s hedged positions on the main currencies to which the Group is exposed.
F-78
At December 31, 2023
At December 31, 2022
(€ thousands, except basis points)
Notional amount
+500 bps
-500 bps
Notional amount
+500 bps
-500 bps
Currency
Impact on profit before tax
Impact on profit before tax
USD
117,479
5,594
(6,183)
53,320
2,539
(2,806)
JPY
21,116
1,006
(1,111)
15,979
761
(841)
CNY
96,021
4,572
(5,054)
42,817
2,039
(2,254)
GBP
12,233
583
(644)
(816)
(39)
43
HKD
17,422
830
(917)
19,940
950
(1,049)
CHF
—
—
—
—
—
—
SGD
7,525
358
(396)
9,463
451
(498)
KRW
11,999
571
(632)
n.a.
n.a.
n.a.
Total
283,795
13,514
(14,937)
140,703
6,701
(7,405)
The following table presents the potential change in equity gross of tax of a hypothetical change of +/- 500 bps in year-end exchange-rates, applied to the Group’s foreign currency hedging instruments on highly probable transactions.
At December 31, 2023
At December 31, 2022
(€ thousands, except basis points)
Notional amount
+500 bps
-500 bps
Notional amount
+500 bps
-500 bps
Currency
Impact on hedge reserve
Impact on hedge reserve
USD
75,308
3,586
(3,964)
61,821
2,944
(3,254)
CHF
—
—
—
(8,272)
(394)
435
JPY
9,181
437
(483)
10,433
497
(549)
HKD
11,531
549
(607)
6,153
293
(324)
GBP
20,924
996
(1,101)
8,280
394
(436)
CNY
88,176
4,199
(4,641)
48,918
2,329
(2,575)
SGD
4,709
224
(248)
5,206
248
(274)
KRW
—
—
—
n.a.
n.a.
n.a.
Total
209,829
9,991
(11,044)
132,539
6,311
(6,977)
The following table presents the potential impact on profit before tax of a hypothetical change of +/- 500 bps in the EUR/USD year-end exchange-rate, applied to the Thom Browne put option in U.S. Dollars on non-controlling interests (recorded within other non-current financial liabilities).
At December 31, 2023
At December 31, 2022
(€ thousands, except basis points)
Notional amount
+500 bps
-500 bps
Notional amount
+500 bps
-500 bps
Currency
Impact on profit before tax
Impact on profit before tax
USD
(116,456)
6,598
(7,293)
(155,551)
7,407
(8,187)
Total
(116,456)
6,598
(7,293)
(155,551)
7,407
(8,187)
Interest rate risk
Overall exposure to interest rate risk is monitored at the Group level through coordinated management of debt and available liquidity and of the relevant due dates. The Group’s principal sources of exposure to interest rate risk derive from loans and revolving credit lines at variable rates. At December 31, 2023, the notional value of interest rate swap derivatives to hedge the risk of a potential increase in the cost of servicing of financial debt due to fluctuations in market rates was €133,962 thousand (€320,000 thousand at December 31, 2022) with a positive fair value of €4,739 thousand (€9,379 thousand at December 31, 2022). The short-term portion of bank debt, used mainly to finance working capital needs, is not covered by interest rate hedges. The cost of bank debt is equal to Euribor for the period plus a spread that depends on the type of credit facility used.
For the year ended December 31, 2023 a hypothetical 20% increase in short-term interest rates on such floating rate non-current financial liabilities, with all other variables held constant, would have resulted in financial expenses, on an annual basis, of approximately €8,124 thousand (€2,273 thousand for the year ended December 31, 2022). For the year ended December 31, 2023 a hypothetical 20% decrease in short-term interest rates on such floating rate non-current financial
F-79
liabilities, with all other variables held constant, would have resulted in financial expenses, on an annual basis, of approximately €5,774 thousand (€1,670 thousand for the year ended December 31, 2022).
The following table presents the sensitivity on floating rate borrowings not covered by interest rate swaps.
At December 31, 2023
Amount
Total interest rate (*)
Interest expense
-20%
Impact on profit before tax
+20%
Impact on profit before tax
(€ thousands, except percentages)
4,829
4.690%
226
3.910%
189
5.470%
264
20,000
4.560%
912
3.770%
754
5.360%
1,071
20,000
4.770%
954
3.970%
794
5.570%
1,114
40,000
4.900%
1,960
4.110%
1,645
5.680%
2,274
40,000
4.850%
1,940
4.040%
1,616
5.660%
2,264
19,500
3.910%
761
3.130%
611
4.680%
912
384
4.800%
18
4.000%
15
5.600%
22
608
5.480%
33
4.680%
28
6.280%
38
1,217
5.480%
67
4.680%
57
6.280%
76
1,000
4.450%
45
3.650%
37
5.250%
53
565
5.700%
32
4.890%
28
6.510%
37
148,103
6,949
5,774
8,124
_________________
*The overall rate indicated is compounded of the fixed spread plus the variable rate (+-20% is on the variable rate).
At December 31, 2022
Amount
Total interest rate (*)
Interest expense
-20%
Impact on profit before tax
+20%
Impact on profit before tax
(€ thousands, except percentages)
5,000
3.091%
155
2.629%
131
3.553%
178
6,250
3.620%
226
2.760%
173
3.928%
246
8,080
2.690%
217
2.304%
186
3.064%
248
45,000
3.090%
1,391
2.622%
1,180
3.558%
1,601
64,330
1,989
1,670
2,273
_________________
*The overall rate indicated is compounded of the fixed spread plus the variable rate (+-20% is on the variable rate).
Liquidity risk
Liquidity risk represents the risk that the Group cannot meet its financial obligations due to problems in obtaining funds at current market price conditions (funding liquidity risk) or in liquidating assets on the market to find the necessary financial resources (asset liquidity risk), which could negatively impact the Group’s results if the Group is forced to incur additional costs to obtain liquidity or meet its commitments.
F-80
The following tables summarize the Group’s financial liabilities into relevant maturity groupings based on their contractual maturities:
(€ thousands)
Within 1 year
Within 2 Years
Within 3 years
Beyond
Total contractual cash flows
Carrying amount at December 31, 2023
Derivative financial instruments
897
—
—
—
897
897
Trade payables and customer advances
314,137
—
—
—
314,137
314,137
Borrowings
294,537
88,235
20,123
8,705
411,600
402,622
Lease liabilities
142,283
119,128
95,035
320,141
676,587
593,725
Other current and non-current financial liabilities
22,102
—
—
136,556
158,658
158,658
Total
773,956
207,363
115,158
465,402
1,561,879
1,470,039
(€ thousands)
Within 1 year
Within 2 Years
Within 3 years
Beyond
Total contractual cash flows
Carrying amount at December 31, 2022
Derivative financial instruments
2,362
—
—
—
2,362
2,362
Trade payables and customer advances
270,936
—
—
—
270,936
270,936
Borrowings
290,470
139,257
36,536
16,650
482,913
471,055
Lease liabilities
119,287
97,148
66,812
193,368
476,615
443,507
Other current and non-current financial liabilities
37,258
23,632
—
155,161
216,051
216,051
Total
720,313
260,037
103,348
365,179
1,448,877
1,403,911
The factors which mainly influence the Group’s liquidity are the resources generated or absorbed by current operating and investing activities, the possible distribution of dividends, the maturity or refinancing of debt and the management of surplus cash. Liquidity needs or surpluses are monitored on a daily basis by the Parent Company in order to guarantee effective sourcing of financial resources or adequate investment of excess liquidity.
The negotiation and management of credit lines is coordinated by the Parent Company with the aim of satisfying the short and medium-term financing needs of the individual companies within the Group according to efficiency and cost-effectiveness criteria. It has always been the Group’s policy to sign and constantly maintain with various and diversified banks a total amount of committed credit lines that is considered consistent with the needs of the individual companies and suitable to ensure at any time the liquidity needed to satisfy and comply with all the Group’s financial commitments, at the established economic conditions, as well as guaranteeing the availability of an adequate level of operational flexibility for any expansion programs.
Credit risk
Credit risk is defined as the risk of financial loss caused by the failure of a counterparty to repay amounts owed or meet its contractual obligations. The maximum risk to which an entity is exposed is represented by all the financial assets recognized in the financial statements. Management considers its credit risk to relate primarily to trade receivables generated from the wholesale channel and mitigates the related effects through specific commercial and financial strategies.
F-81
With regards to trade receivables, credit risk management is carried out by monitoring the reliability and solvency of customers, as well as through insurance agreements. The following table provides the aging of trade receivables:
(€ thousands)
Not yet due
0-120 days overdue
121-180 days overdue
>180 days overdue
Total
Trade receivables, gross
189,324
46,078
6,907
4,829
247,138
Loss allowance
(418)
(1,387)
(1,262)
(3,614)
(6,681)
Total trade receivables at December 31, 2023
188,906
44,691
5,645
1,215
240,457
Trade receivables, gross
146,486
29,772
1,877
5,590
183,725
Loss allowance
(894)
(1,287)
(278)
(4,053)
(6,512)
Total trade receivables at December 31, 2022
145,592
28,485
1,599
1,537
177,213
F-82
36. Related party transactions
Pursuant to IAS 24 — Related Party Disclosures (“IAS 24”), the related parties of the Group are all entities and individuals, including their close family members, capable of exercising control, joint control or significant influence over the Group and its subsidiaries, including the Group’s controlling shareholder, Monterubello, as well as other companies owned by Monterubello and its shareholders. Related parties also include the Group’s associates and joint arrangements, members of the Group Board and executives with strategic responsibilities, as well as their families and entities controlled by them.
The Group carries out transactions with related parties on commercial terms that are normal in the respective markets, considering the characteristics of the goods or services involved.
Transactions carried out by the Group with these related parties are primarily of a commercial and financial nature and are mainly relate to:
Transactions with associates
•Transactions with TFI and its subsidiaries (the “TFI Group”), prior to the completion of the TFI Acquisition related to:
◦a licensing agreement for the production and worldwide distribution of luxury men’s ready to wear and made to measure clothing, footwear and accessories under the TOM FORD brand (which ended with the deliveries of the Fall/Winter 2022 collection), as well as a supply agreement to act as exclusive supplier for certain TOM FORD menswear products starting with the Spring/Summer 2023 collection (for which the supply commenced in 2022);
◦financial loans to TFI that were settled during the period; and
◦a financial guarantee provided in 2020 by the Group to TFI (which at the time was an associate of the Group) for an amount of $7,500 thousand in relation to its payment obligations under a bank loan issued to TFI. Such guarantee was subsequently reduced to $6,875 thousand in 2022 and terminated in 2023 as part of the transactions contemplated by the TFI Acquisition. No amounts were claimed under the guarantee.
•The purchase of raw materials, in particular carded yarns from Filati Biagioli Modesto.
•The purchase of finished products from Norda Run Inc. and Luigi Fedeli e Figlio S.r.l..
Transactions with Monterubello and companies controlled by Monterubello or its shareholders, the Company’s directors or Senior Management Team
•The purchase of raw materials, in particular of wool, from Gruppo Schneider S.p.A. and its subsidiaries (the “Schneider Group”).
•The purchase of industrial services, in particular of fabrics’ finishing, from Finissaggio e Tintoria Ferraris S.p.A.
•The purchase of industrial services from Pettinatura di Verrone S.r.l.
•Transactions with PKB Bank AG relating to an interest-bearing loan amounting to €5,000 thousand which was fully repaid in the first half of 2022.
•The Disposition, which was completed in November 2021, of certain of its businesses, through the statutory demerger under Italian law to a new company owned by its existing shareholders. The Disposition included, inter alia, the Group’s real estate business, consisting of the Group’s former subsidiary EZ Real Estate, which directly and indirectly holds substantially all of the real estate assets formerly owned by the Group, as well as certain properties previously owned by Lanificio.
•Following the Disposition, the rental of properties from EZ Real Estate or its subsidiaries under lease agreements.
F-83
•Following the Disposition, the Group receives licensing, marketing and other sustainability-related services from Oasi Zegna.
•As part of the Disposition, on January 14, 2021, the Group sold 70% of its equity stake in Agnona to a related party for consideration of €1 and as a result Agnona was deconsolidated from the beginning of the year and became a related party of the Group. The Group subsequently disposed of the remaining 30% stake in Agnona in two tranches during September and October 2021 for total consideration of €500 thousand. Following the initial disposal of Agnona, the Group sold products and recharged costs for services to Agnona, as well as compensated amounts related to losses incurred by Agnona subsequent to the Group’s sale of a majority stake in accordance with the terms of the related sale agreement.
•Support to the activities of Fondazione Zegna, a charitable organization which provides an opportunity for charitable work on the part of the Zegna family and Group employees. Fondazione Zegna supports and funds projects in cooperation with non-profit organizations operating in various fields and different parts of the world.
•Put contracts entered into as part of the Group’s investments in the Thom Browne Group and Lanificio whereby the Group has been required to, and may in the future be required to, purchase all or a portion of the remaining non-controlling interests in the Thom Browne Group and Lanificio. In July 2021, the Group purchased the additional 10% of Lanificio for a total consideration of €9,600 thousand, following which the Group owns 100% of Lanificio. In June 2021, the Group purchased an additional 5% of the Thom Browne Group for a total consideration of €30,653 thousand, following which the Group owns 90% of the Thom Browne Group. For additional information relating to the Thom Browne put contract see Note 28 — Other current and non-current financial liabilities.
Transactions with other related parties connected to directors and shareholders, including in connection with the Business Combination in 2021
•Transactions with UBS Group AG and its subsidiaries (together referred to as the “UBS Group AG”) for borrowings, revolving credit lines and financial assets the Group holds (mainly cash and cash equivalents and other securities), as well as derivative contracts in the course of the Group’s risk management activities. UBS Group AG also provides certain financial guarantees to third parties on behalf of the Group. Following Mr. Sergio Ermotti's appointment as Group Chief Executive Officer of UBS Group AG effective April 5, 2023, UBS Group AG and its subsidiaries qualify as related parties of the Group.
In connection with the closing of the Business Combination and the public listing of the Company (as further described in the Note 1 — General information), the Company entered into various transactions with Monterubello and other shareholders and related parties, including the following:
•The repurchase by the Company of 54,600,000 of its own shares from Monterubello for total consideration of €455,000 thousand.
•The reimbursement to the Company by Monterubello of a special gift to all employees of the Group for an amount of €10,923 thousand.
•The issuance of 800,000 private warrants to certain Non-Executive Directors, for which the Group recognized personnel costs of €1,236 thousand and an offsetting increase to other reserves within equity for the year ended December 31, 2021. As a result of a warrant redemption completed on February 27, 2023, there are no remaining private warrants outstanding. For additional information see Note 28 — Other current and non-current financial liabilities.
•The grant of equity-settled share-based payments to key management. For additional information see Note 37 — Share-based payments.
•In connection with the Business Combination, certain of the Company’s related parties (including certain directors and officers and affiliates of Monterubello) entered into PIPE Subscription Agreements with the Company pursuant to which they subscribed for ordinary shares at the closing of the Business Combination. The amount of each such subscription was immaterial. Under the terms of the PIPE Subscription Agreements, such related parties are entitled to certain registration rights in respect of their ordinary shares. In addition, at the Closing of the Business
F-84
Combination, the Company entered into certain agreements with related parties, including the Shareholders Agreement, the Zegna Shareholders Lock-Up Agreement, the IIAC Sponsor Lock-Up Agreement and the Registration Rights Agreement. Such agreements are filed as exhibits to this annual report on Form 20-F.
F-85
The following table summarizes transactions with related parties for the years ended December 31, 2023, 2022 and 2021.
For the year ended December 31,
2023
2022
2021
(€ thousands)
Revenues
Cost of sales
Selling, general and administrative expenses
Marketing expenses
Financial income/(expenses)
Foreign exchange gains/(losses)
Revenues
Cost of sales
Selling, general and administrative expenses
Marketing expenses
Financial income/(expenses)
Foreign exchange gains/(losses)
Revenues
Cost of sales
Selling, general and administrative expenses
Marketing expenses
Financial income/(expenses)
Foreign exchange gains/(losses)
Associates
TFI Group(1)(2)
3,233
288
740
—
(7)
—
35,525
—
6,396
—
136
—
23,047
—
7,730
—
596
—
Filati Biagioli Modesto S.p.A.
5
4,782
141
—
96
—
—
3,304
61
—
—
—
49
177
—
—
—
—
Norda Run Inc.
—
2,072
122
—
—
(14)
—
—
—
—
—
—
—
—
—
—
—
—
Pelletteria Tizeta S.r.l.(1)
—
—
—
—
—
—
1
—
—
—
—
—
—
—
—
—
—
—
Luigi Fedeli e Figlio S.r.l.
86
85
—
—
—
—
—
—
—
—
—
—
—
—
—
—
—
—
Total associates
3,324
7,227
1,003
—
89
(14)
35,526
3,304
6,457
—
136
—
23,096
177
7,730
—
596
—
Companies controlled by Monterubello or its shareholders, the Company's directors or Senior Management Team
EZ Real Estate(3)
4
2,580
4,100
2,072
(545)
—
8
2,545
3,638
—
(490)
—
58
830
1,659
84
—
—
Schneider Group
25
14,209
14
—
—
23
14,785
52
—
—
—
20
5,623
—
—
—
—
Alan Real Estate S.A.(3)
—
1,650
3,100
—
(310)
(8)
1,692
1,415
—
(13)
—
—
274
520
—
—
—
Agnona S.r.l.
64
35
210
32
(1)
(1)
195
262
81
—
—
—
373
—
5,665
—
—
—
61 West 23rd Street LLC(3)
—
—
—
—
—
—
—
—
(16)
—
—
—
—
—
(14)
—
—
—
Other companies controlled by Monterubello or its shareholders, the Company's directors or Senior Management Team(4)
195
5,827
614
6
3
—
1
6,086
33
—
(8)
—
9
491
—
—
(40)
—
Other related parties connected to directors and shareholders
UBS Group AG
—
—
3,108
—
(1,522)
350
—
—
—
—
—
—
—
—
—
—
—
—
Other
—
—
3,038
—
—
—
—
—
2,563
—
—
—
—
—
1,284
—
(20,675)
—
Total transactions with related parties
3,612
31,528
15,187
2,110
(2,286)
327
35,753
28,674
14,223
—
(375)
—
23,556
7,395
16,844
84
(20,119)
—
Total for the Group
1,904,549
680,235
901,364
114,802
(30,839)
(5,262)
1,492,840
564,832
695,084
85,147
(41,026)
(7,869)
1,292,402
495,702
822,897
67,831
2,066
(7,791)
_________________
(1)Following the TFI Acquisition completed on April 28, 2023, TFI Group and Pelletteria Tizeta S.r.l. are controlled by the Group and are no longer related parties.
(2)Costs with TFI Group include royalties amounting to €181 thousand for the year ended December 31, 2023 (€3,956 thousand and €4,081 thousand for the year ended December 31, 2022 and 2021, respectively).
(3)Entities disposed of as part of the disposition in November 2021 of certain businesses that were previously part of the Group.
(4)Includes transactions with Fondazione Zegna, Finissaggio e Tintoria Ferraris S.p.A., PKB Privatbank AG and Pettinatura di Verrone S.r.l.
F-86
The following table summarizes assets and liabilities with related parties at December 31, 2023 and 2022.
At December 31, 2023
At December 31, 2022
(€ thousands)
Non-current assets
Current assets
Non-current liabilities
Current liabilities
Non-current assets
Current assets
Non-current liabilities
Current liabilities
Associates
TFI Group(1)
—
—
—
—
—
11,808
—
366
Filati Biagioli Modesto S.p.A.
—
598
—
927
—
2,200
—
2,830
Norda Run Inc.
—
—
—
2
—
—
—
—
Pelletteria Tizeta S.r.l.(1)
—
—
—
—
—
1
—
—
Luigi Fedeli e Figlio S.r.l.
—
3
—
—
—
—
—
—
Total associates
—
601
—
929
—
14,009
—
3,196
Monterubello and Companies controlled by Monterubello or its shareholders, the Company's directors or Senior Management Team
Monterubello
—
—
—
—
—
—
—
Agnona S.r.l.
—
55
—
56
—
32
—
67
Schneider Group
—
—
—
4,176
—
4
—
4,102
EZ Real Estate (2)
43,215
82
37,320
8,503
41,671
69
35,776
6,476
61 West 23rd Street LLC(2)
—
—
—
—
—
24
—
—
Alan Real Estate S.A.(2)
37,154
—
33,245
5,291
9,875
—
7,565
2,471
Other companies controlled by Monterubello or its shareholders, the Company's directors or Senior Management Team(3)
406
188
—
2,144
—
240
—
2,204
Other related parties connected to directors and shareholders
UBS Group AG
—
43,202
20,000
3,017
—
—
—
—
Other
—
—
—
530
—
—
—
384
Total transactions with related parties
80,775
44,128
90,565
24,646
51,546
14,378
43,341
18,900
Total for the Group
1,479,375
1,287,636
853,992
1,012,123
1,141,070
1,285,657
827,422
866,984
_________________
(1)Following the TFI Acquisition completed on April 28, 2023, TFI Group and Pelletteria Tizeta S.r.l. are controlled by the Group and are no longer related parties.
(2)Entities disposed of as part of the disposition in November 2021 of certain businesses that were previously part of the Group.
(3)Includes transactions with Fondazione Zegna, Finissaggio e Tintoria Ferraris S.p.A., PKB Privatbank AG, Achill Station Pty Ltd., and Pettinatura di Verrone S.r.l.
F-87
The following table summarizes remuneration of and outstanding balances with the directors of the Group and key executives with strategic responsibilities:
Key Management Personnel
Outstanding Balance
(Euro thousands)
Short-term employee benefits(1)
Post- employment benefits
Other long-term benefits
Share-based payments
Financial income
Employee benefits
Other current and non-current financial liabilities(2)
Other current liabilities
Non-current financial assets
2023
17,516
3,047
9,110
14,251
—
4,346
138,558
43,034
—
2022
17,337
1,015
13,623
9,358
(24)
28,648
156,782
6,861
2,240
2021
16,853
4,012
8,702
14,012
—
12,865
135,726
7,990
2,219
__________________
(1)Includes corporate bodies fees, consultancy fees and personnel compensation.
(2)Primarily relates to liabilities on put contracts entered into as part of the Group’s investments in Thom Browne and Lanificio (in 2021).
F-88
37. Share-based payments
The Group has several equity incentive arrangements under which share-based payments have been awarded to the Chief Executive Officer (“CEO”), other members of the Senior Management Team and certain other employees of the Group. The equity incentives primarily consist of performance share units (“PSUs”) and retention restricted share units (“RSUs”), which each represent the right to receive one of the Company ordinary share, and are further described below.
2023 Restricted Stock Units Plan
In October 2023, the Company granted 170,000 RSUs to Senior Management Team (the “2023 RSUs Plan”), of which:
•80,000 RSUs vest in two equal installments on April 10, 2024 and December 10, 2024, in connection with the achievement of the service condition through the vesting periods, and
•90,000 RSUs vest in three equal installments on December 10, 2024, December 10, 2025, and December 10, 2026, in connection with the achievement of the service condition through the vesting periods.
For the year ended December 31, 2023, the Group recognized €499 thousand as share-based compensation expense and an offsetting increase to other reserves within equity in relation to the 2023 RSUs Plan. At December 31, 2023, unrecognized compensation expense relating to the 2023 RSUs Plan amounted to €1,680 thousand and is expected to be recognized over the remaining vesting periods.
The following table summarizes the fair value for accounting purposes at grant dates and the key assumptions used in the valuation:
2023 RSUs
Fair value
€12.64 - €12.95
Grant date share price
€12.95
Dividend yield
0.801%
Risk-free rate
4.93% - 5.46%
The following table summarizes the changes in the number of the outstanding number awards under the 2023 Restricted Stock Units Plan, all of which were unvested:
2023 RSUs
Outstanding at December 31, 2022
—
Granted
170,000
Outstanding at December 31, 2023
170,000
Long-Term Incentive Awards 2022-2025
In 2022, the Company granted the following equity-settled share-based payments to Senior Management Team (excluding the CEO) and certain other employees of the Group:
(i)A target number of 1,461,950 PSUs (the “2022-2024 PSUs”) that vest in 2025 based on the achievement of defined targets related to the Adjusted EBIT and the change in the adjusted net financial indebtedness/(cash surplus) compared to the previous year for the performance periods 2022, 2023 and 2024, and the recipient’s continued service to the Group at the date of vesting. Each of the performance targets will be settled independently of the other target and the total number of shares to be assigned upon vesting depends on the level of achievement of the performance targets, as well as a multiplier that is based on the performance of certain environmental, social and governance indicators over the performance period. In case of over- or underachievement of the targets and/or the multiplier, the number of awards that vest will be adjusted according to predefined parameters. For the year ended December 31, 2023, the Group recognized €4,062 thousand as share-based compensation expense and an offsetting increase to other reserves within
F-89
equity in relation to the 2022-2024 PSUs (€2,816 thousand for the year ended December 31, 2022). At December 31, 2023 unrecognized compensation expense relating to the 2022-2024 PSUs amounted to €4,408 thousand and is expected to be recognized over the remaining vesting period through 2024.
(ii)Up to a maximum of 626,550 RSUs (the “2022-2025 RSUs”) that vest in 2026 based on the recipient’s continued service with the Group. For the year ended December 31, 2023, the Group recognized €1,456 thousand as share-based compensation expense and an offsetting increase to other reserves within equity in relation to the 2022-2025 RSUs (€1,046 thousand for the year ended December 31, 2022). At December 31, 2023, unrecognized compensation expense relating to the 2022-2025 RSUs amounted to €3,123 thousand and is expected to be recognized over the remaining vesting period through 2025.
The fair value of the 2022-2024 PSUs and the 2022-2025 RSUs for accounting purposes was measured at the grant dates using a Monte Carlo Simulation model. The following table summarizes the fair value for accounting purposes at grant dates and the key assumptions used in the valuation:
2022-2024 PSUs
2022-2025 RSUs
Fair value
€8.68 - €11.52
€8.62 - €11.40
Grant date share price
€9.71 - €12.68
Expected volatility based on the historical and implied volatility of a group of comparable companies
35.0% - 37.5%
Dividend yield
0.90% - 1.24%
Risk-free rate
1.96% - 4.86%
2.07% - 4.05%
The following table summarizes the changes in the number of the outstanding number awards under the Long-Term Incentive Awards 2022-2025, all of which were unvested:
2022-2024 PSUs
2022-2025 RSUs
Total Awards
Outstanding at December 31, 2021
—
—
—
Granted
1,461,950
626,550
2,088,500
Forfeited
(95,900)
(41,100)
(137,000)
Outstanding at December 31, 2022
1,366,050
585,450
1,951,500
Granted
114,800
49,200
164,000
Outstanding at December 31, 2023
1,480,850
634,650
2,115,500
CEO equity-settled share-based payments
In February 2021 and as amended in July 2021 and August 2022, the Company granted the following equity-settled share-based payments to the CEO:
(i)Up to a maximum of 2,520,000 PSUs (the “CEO 2022-2024 PSUs”) that vest in three tranches in 2023, 2024 and 2025 according to the achievement of defined targets based on the Group’s Adjusted EBIT and the change in the adjusted net financial indebtedness/(cash surplus) (as defined in the related agreement) compared to the previous year for the performance periods 2022, 2023 and 2024, and the CEO’s continued service to the Group at the date of vesting. Each of the performance targets will be settled independently of the other target and the total number of shares to be assigned upon vesting depends on the level of achievement of the performance targets, as well as a multiplier that is based on the performance of certain ESG indicators over the performance period. For the year ended December 31, 2023, the Group recognized €4,266 thousand as share-based compensation expense and an offsetting increase to other reserves within equity in relation to the CEO 2022-2024 PSUs (€6,789 thousand and €6,138 thousand for the years ended December 31, 2022 and 2021, respectively). At December 31, 2023, unrecognized compensation expense relating to the CEO 2022-2024 PSUs amounted to €1,842 thousand and is expected to be recognized over the remaining vesting periods through 2024 (€6,108 thousand at December 31, 2022). The fair value of the CEO 2022-2024 PSUs for accounting purposes was €7.43 to €9.13 per PSU and was measured at the grant dates using a Monte Carlo Simulation model. Key assumptions used in the valuation include the following: (i) grant date share price:
F-90
€7.43 per share to €9.13 per share (ii) expected volatility: 30%-40% based on the historical and implied volatility of a group of comparable companies, (iii) risk free rate: 0%. On April 5, 2023, the Board of Directors determined the level of achievement of the performance conditions applicable to the awards under the CEO 2022-2024 LTIP in relation to the 2022 performance period. As a result of such determination, 588,000 ordinary shares vested and were delivered to the Chairman and CEO. At December 31, 2023 1,932,000 2022-2024 PSUs were outstanding and unvested.
(ii)The right to buy a maximum number of 15,832 shares of the Company (791,600 shares following the Share Split) for a purchase price of €186 per share (€3.72 per share following the Share Split) (the “CEO Stock Options”). In May 2021, the CEO exercised the option and purchased 15,832 shares of the Company (791,600 shares following the Share Split) for total consideration of €2,946 thousand. For the year ended December 31, 2021, the Company recognized €2,938 thousand as share-based compensation expense and an offsetting increase to other reserves within equity, representing the difference between the fair value of the shares sold and the consideration received.
(iii)The share purchase rights, under which the CEO is entitled to purchase ordinary shares of the Company at a rate based on a multiplier of EBIT, for a maximum amount corresponding to his base salary, net of personal income tax, plus short-term variable cash compensation for the previous year (the “CEO Remuneration in Shares”). The annual right vests each year and can be exercised directly by the CEO within 12 months after the end of each year. In June 2022, as a result of the exercise of the share purchase rights, 459,086 ordinary shares, which were previously held in treasury, were delivered to the CEO for an aggregate purchase price of €3,390 thousand. In June 2023, as a result of the exercise of the share purchase rights, 468,450 ordinary shares, which were previously held in treasury, were delivered to the CEO for an aggregate purchase price of €3,654 thousand.
(iv)600,000 PSUs related to the Company’s public listing (the “CEO IPO PSUs”), of which:
•240,000 CEO IPO PSUs vest upon the satisfaction of the following conditions: (i) a public listing of the Company’s shares, and (ii) a Company share price of at least $11.50 for twenty consecutive trading days following the public listing and before December 31, 2023, and
•360,000 CEO IPO PSUs vest upon the satisfaction of the following conditions: (i) a public listing of the Company’s shares, (ii) a Company share price of at least $12.50 for twenty consecutive trading days following the public listing and before December 31, 2023, and (iii) the CEO’s continued service with the Company from the award grant date until December 31, 2023.
For the year ended December 31, 2023, the Group recognized €840 thousand as share-based compensation expense in relation to the CEO IPO PSUs and an offsetting increase to other reserves in equity (€840 thousand and €2,047 thousand for the years ended December 31, 2022 and 2021, respectively). The fair value of the CEO IPO PSUs for accounting purposes was €5.77 to €6.93 per PSU and was measured at the grant date using a Monte Carlo Simulation model. Key assumptions used in the valuation include the following: (i) grant date share price: $10.48 (ii) expected volatility: 30% based on the historical and implied volatility of a group of comparable companies, (iii) risk free rate: 0.73%. On April 5, 2023, the Board of Directors verified the achievement of the vesting conditions applicable to the first tranche of awards under the IPO Performance Bonus plan conditioned upon the completion of the public listing of the Company’s shares by December 31, 2021 and the attainment of predefined targets relating to the Company’s share price. The Board of Directors determined that the conditions were satisfied and as a result, 240,000 CEO IPO PSUs vest and the same number of ordinary shares held in treasury were delivered to the CEO in the second quarter of 2023. At December 31, 2023 360,000 CEO IPO PSUs vested as a result of the achievement of the vesting conditions applicable to the second tranche of the awards under the IPO Performance Bonus plan conditioned upon the completion of the public listing of the Company’s shares by December 31, 2021, the attainment of predefined targets relating to the Company’s share price and the recipient’s continued employment with the Company from the award grant date until December 31, 2023. The same number of ordinary shares held in treasury will be delivered to the CEO in due course.
In December 2021, the Company granted 900,000 PSUs to the directors of the Group (excluding the CEO), key executives with strategic responsibilities and other employees of the Group (the “Management IPO PSUs”), of which:
F-91
•450,000 Management IPO PSUs vest upon the satisfaction of the following conditions: (i) a public listing of the Company’s shares before December 31, 2021 and, (ii) a Company share price of at least $11.50 for ten consecutive trading days following the public listing and before December 31, 2023, and
•450,000 Management IPO PSUs vest upon the satisfaction of the following conditions: (i) a public listing of the Company’s shares before December 31, 2021, (ii) a Company share price of at least $12.50 for twenty consecutive trading days following the public listing and before December 31, 2023, and (iii) the recipient’s continued employment with the Company from the award grant date until December 31, 2023.
For the year ended December 31, 2023, the Group recognized €1,300 thousand as share-based compensation expense in relation to the Management IPO PSUs (€1,297 thousand and €3,349 thousand for the years ended December 31, 2022 and 2021, respectively). The fair value of the Management IPO PSUs for accounting purposes was €6.18 to €7.35 per PSU and was measured at the grant dates using a Monte Carlo Simulation model. Key assumptions used in the valuation include the following: (i) grant date share price: $10.48 (ii) expected volatility: 30% based on the historical and implied volatility of a group of comparable companies, (iii) risk free rate: 0.73%.
The following table summarizes the changes in the number of the outstanding number awards under the Management IPO equity-settled share-based payments:
Management IPO PSUs
Outstanding at December 31, 2021
900,000
Forfeited
(20,000)
Outstanding at December 31, 2022
880,000
Vested
(880,000)
Outstanding at December 31, 2023
—
On April 5, 2023, the Board of Directors verified the achievement of the vesting conditions applicable to the first tranche of awards under the IPO Performance Bonus plan conditioned upon the completion of the public listing of the Company’s shares by December 31, 2021 and the attainment of predefined targets relating to the Company’s share price. The Board of Directors determined that the conditions were satisfied and as a result, 450,000 Management IPO PSUs vest and the same number of ordinary shares held in treasury were delivered to the directors of the Group (excluding the CEO), key executives with strategic responsibilities and other employees of the Group in the second quarter of 2023. At December 31, 2023 430,000 Management IPO PSUs vested as a result of the achievement of the vesting conditions applicable to the second tranche of the awards under the IPO Performance Bonus plan conditioned upon the completion of the public listing of the Company’s shares by December 31, 2021, the attainment of predefined targets relating to the Company’s share price and the recipient’s continued employment with the Company from the award grant date until December 31, 2023. The same number of ordinary shares held in treasury will be delivered to the directors of the Group (excluding CEO) in due course.
As part of the Business Combination, the Company issued 800,000 private warrants to certain Group’s non-executive directors (the “Private Warrant Awards”) and recognized €1,236 thousand as share-based compensation expense and an offsetting increase to other reserves within equity for the year ended December 31, 2021.
Management stock options
In 2021 a member of key management exercised a right to buy 16,237 shares of the Company (811,850 shares following the Share Split) for a purchase price of €137 per share (€2.74 per share following the Share Split) (the “Management Stock Options”) for total consideration of €2,216 thousand. For the year ended December 31, 2021, the Group recognized €3,834 thousand as share-based compensation expense and an offsetting increase to other reserves within equity.
Non-executive directors remuneration in shares
Under the Group’s remuneration policy, non-executive directors will receive 50% of their annual base remuneration in cash and 50% in the Company’s ordinary shares (“Non-Executive Directors’ Equity Compensation”). The number of ordinary shares in the Company to be assigned to the non-executive directors is determined based on the closing share price of the Company’s ordinary shares on the last trading date of the month preceding the grant date. If a non-executive director
F-92
ceases to be employed by the Group within a given year, the shares will vest on a pro-rata basis until the date on which the non-executive director provided their services. A total of 76,400 and 78,460 ordinary shares of the Company were earned by the non-executive directors for 50% of their annual base remuneration for services provided in 2023 and 2022, and will be delivered to the recipients two years following the grant date, which for the 2023 remuneration was in January and for the 2022 remuneration was in June. For the year ended December 31, 2023, the Group recognized €795 thousand as share-based compensation expense and an offsetting increase to other reserves within equity (€791 thousand for the year ended December 31, 2022.
38. Notes to consolidated cash flow statement
Operating activities
Other non-cash expenses/(income), net in the consolidated cash flow statement primarily include:
•in 2023 and 2022: equity-settled share-based compensation and bonuses earned by the Senior Management Team and other employees of the Group that were not paid during the period; and
•in 2021: (i) €114,963 thousand relating to the excess of the fair value of the Company’s ordinary shares issued as part of the Business Combination and the fair value of IIAC’s identifiable net assets acquired, (ii) €37,906 thousand for the issuance of 5,031,250 the Company’s ordinary shares, to be held in escrow, to the holders of IIAC class B shares, (iii) €16,290 thousand of equity-settled share-based compensation, and (iv) rent reductions received as a result of the COVID-19 pandemic and defined benefit obligations.
The change in other operating assets and liabilities primarily relates to indirect taxes, accrued income and expenses, and deferred charges.
Non-cash investing activities
Non-cash investing activities primarily related to:
•acquisitions of right-of-use assets of €141,995 thousand in 2023 (€137,781 thousand in 2022 and €148,299 thousand in 2021);
•acquisitions of property, plant and equipment of €13,301 thousand in 2023 (€5,891 thousand in 2022 and €16,507 thousand in 2021);
•acquisitions of intangible assets of €5,859 thousand in 2023 (€4,561 thousand in 2022 and €3,488 thousand in 2021), and
•deferred consideration relating to the acquisition of the Thom Browne business in South Korea amounting to €18,583 thousand.
F-93
39. Business combinations
Acquisition of Thom Browne business in South Korea
On July 1, 2023, Thom Browne began directly operating its business in South Korea and its network of 17 stores. The business is now wholly owned through Thom Browne Korea Ltd., a newly formed and wholly owned company, and operates in the region with external support from the former franchise partner.
Details of the purchase consideration, the net assets acquired and goodwill are as follows:
(€ thousands)
At acquisition date
Cash consideration paid
7,991
Deferred consideration
18,583
Total consideration
26,574
At the acquisition date, the Group recognized the net present value of the deferred consideration related to the acquisition of the Thom Browne business in South Korea for €18,583 thousand. At December 31, 2023, the deferred consideration amounted to €18,991 thousand, of which €9,302 thousand is expected to be paid in 2024 and was classified within current liabilities and €9,689 thousand is expected to be paid in 2025 and was classified within non-current liabilities.
The assets and liabilities recognized as a result of the acquisition are as follows:
(€ thousands)
Fair value at acquisition date
Inventories
1,054
Other current assets
800
Property, plant and equipment
949
Other current liabilities
(123)
Deferred tax liabilities
(72)
Net identifiable assets acquired
2,608
Goodwill
23,966
Net assets acquired including goodwill
26,574
Goodwill arising from the acquisition of €23,966 thousand is primarily attributable to the expected synergies from combining operations of the acquiree and the acquirer. Acquisition-related costs of €263 thousand were expensed.
Details of the net cash outflows related to the acquisition are presented below.
(€ thousands)
At acquisition date
Cash consideration paid
(7,991)
Net cash outflow - Investing activities
(7,991)
The acquired business contributed revenues of €19,668 thousand and a net loss of €1,003 thousand to the Group for the period from the date of acquisition until December 31, 2023.
Acquisition of Tom Ford International (TFI)
On April 28, 2023, the Group completed the TFI Acquisition, through which it acquired TFI, the company that owns and operates the TOM FORD FASHION business, as part of a transaction in which sole ownership of the TOM FORD brand, its trademarks, and other intellectual property rights were acquired by ELC and the Group has become a long-term licensee for all TOM FORD men’s and women’s fashion as well as accessories and underwear, fine jewelry, childrenswear, textile, and home design products. The Group will be in charge of the end-to-end TOM FORD FASHION business, from collection creation and development to production and merchandising, as well as retail and wholesale distribution. TOM
F-94
FORD FASHION, under the Group, operates a network of 51 directly operated TOM FORD FASHION stores globally at December 31, 2023.
Before the completion of the TFI Acquisition, the Group already owned 15% of TFI, through its fully owned subsidiary EZ US Holding Inc., and, through the TFI Acquisition, acquired the remaining 85% equity interest. The transaction implied a value for the acquired 85% stake of TFI at $150 million in cash, on a cash-free and debt-free basis and assuming a normalized working capital. The final purchase price has been subject to customary final confirmation of purchase price adjustments related primarily to indebtedness, trade working capital and transaction expenses, as stipulated in the related agreements. No contingent consideration arrangements were agreed as part of the transaction.
In connection with the TFI Acquisition, the Group entered into a long-term license agreement through TFI with ELC under which the Group will be licensee for all TOM FORD men’s and women’s fashion as well as accessories and underwear, fine jewelry, childrenswear, textile, and home design products (as further described below).
As a result of the TFI Acquisition, the Group also obtained 100% of Pelletteria Tizeta, for which it previously held a 50% interest and accounted for the investment using the equity method, with the remaining 50% interest owned by TFI and being acquired by the Group through the TFI Acquisition. See Note 17 — Investments accounted for using the equity method for additional information. A financial guarantee provided to TFI in relation to its payment obligations under a bank loan for an amount of $6,875 thousand was closed as part of the transactions contemplated by the TFI Acquisition. No amounts were claimed under the guarantee.
The Group has accounted for the TFI Acquisition using the acquisition method of accounting in accordance with IFRS 3 — Business Combinations (“IFRS 3”), which applies the fair value concepts defined in IFRS 13 — Fair Value Measurement (“IFRS 13”) and requires the Group to recognize the assets acquired and the liabilities assumed at their fair values as of the acquisition date of April 28, 2023 (with certain exceptions). Following the TFI Acquisition, the earnings of the Group reflect the impacts of purchase accounting adjustments, including the amortization and depreciation of certain acquired assets.
Acquisition-related costs amounted to €5,436 thousand and were expensed in the consolidated statement of profit and loss.
Details of the purchase consideration, previously equity interest held and the net assets acquired are presented below.
(€ thousands)
At acquisition date
Cash consideration paid for 85% of TFI
91,619
Fair value of the previously equity interests held
21,505
Settlement of pre-existing intercompany balances
5,949
Total consideration
119,073
F-95
(€ thousands)
Fair value at acquisition date
Cash and cash equivalents
109,667
Trade receivables
23,329
Inventories
82,694
Right-of-use assets
160,869
Intangible assets and property, plant and equipment
122,770
Other current and non-current assets
70,014
Other current and non-current liabilities
(176,147)
Current and non-current lease liabilities
(160,869)
Current and non-current borrowings
(29,890)
Trade payables and customer advances
(28,942)
Employee benefits
(3,259)
Deferred tax liabilities
(51,163)
Net identifiable assets acquired
119,073
Intangible assets and property, plant and equipment include the fair value of the license agreement under which the Group has become a long-term licensee for all TOM FORD men’s and women’s fashion as well as accessories and underwear, fine jewelry, childrenswear, textile, and home design products, amounting to €99,295 thousand and determined through an income approach based on the multi-period excess earnings method, which requires an estimate of future expected cash flows. The estimated useful life of the license agreement is 30 years, which includes the 20 guaranteed years as per the contract plus the automatic renewal period of 10 years which is subject to certain minimum performance conditions that management believes will be satisfied based on the business plan and information currently available.
Details of the net cash outflows related to the acquisition are presented below.
(Euro thousands)
At acquisition date
Consideration paid for 85% of TFI
(91,619)
Cash and cash equivalents acquired
109,667
Payment of TFI acquisition-related liabilities
(127,158)
Net cash outflow - Investing activities
(109,110)
TFI contributed revenues of €235,531 thousand and a loss of €14,926 thousand to the Group from the acquisition date until December 31, 2023 (including additional costs as a result of the purchase price accounting). If the acquisition had occurred on January 1, 2023, the consolidated statement of profit and loss for the year ended December 31, 2023 would have included additional revenues of €97 million and an additional loss of €17 million (including transaction costs incurred by TFI prior to the closing of the TFI Acquisition).
Total assets and total revenues of TFI represent approximately 15.7% and approximately 12.4%, respectively, of the related consolidated financial statement amounts at and for the year ended December 31, 2023.
Trade receivables had a gross contractual value of €24,571 thousand and the best estimate at the acquisition date of the contractual cash flows not to be collected is €1,242 thousand.
As part of the license agreement, the Group has become a long-term licensee of ELC for all TOM FORD men’s and women’s fashion as well as accessories and underwear, fine jewelry, childrenswear, textile, and home design products, by virtue of a long-term licensing and collaboration agreement with ELC for 20 years with an automatic renewal for one further 10 year period subject to certain minimum performance conditions. As part of the license agreement, the Group is required to pay minimum annual guaranteed royalties for the term of the license agreement.
F-96
At December 31, 2023, the remaining minimum annual guaranteed royalties covering the first 10-year period of the license agreement were as follows (undiscounted):
At December 31, 2023
(€ millions)*
Due within 1 year
16.9
Due in 1 to 5 years
71.8
Due in 5 to 10 years
81.9
Total
170.6
(*) Translated from U.S. Dollars to Euro at the December 31, 2023 end of day exchange rate.
For the remaining term of the license the minimum annual guaranteed royalties to be paid by the Group will be calculated based on a percentage of the net sales of the preceding annual period.
The license agreement also requires the Group to make minimum investments for marketing activities as a percentage of net sales of the licensed products as per customary market practices.
Acquisition of Tessitura Ubertino
On June 4, 2021 the Group acquired 60% of Tessitura Ubertino, a company active in the textile business. As a result of acquisition, the Group has expanded its textile activities and product offering. Details of the purchase consideration, the net assets acquired and goodwill were as follows:
(€ thousands)
At acquisition date
Cash consideration paid
5,880
Contingent consideration
1,170
Total consideration
7,050
The cash consideration of approximately €7,050 thousand included a €1,170 thousand earn-out payment, subject to Tessitura Ubertino achieving certain predetermined operating performance targets for the years 2021 and 2022. The operating performance targets for 2021 and 2022 were achieved and the earn-out payment, amounting to €1,170 thousand, was paid by the Group in cash, of which €585 thousand in 2022 and €585 thousand in 2023.
(€ thousands)
Fair value at acquisition date
Cash and cash equivalents
2,366
Trade receivables
1,681
Inventories
1,564
Other current assets
626
Property, plant and equipment
641
Intangible assets
4,200
Account payables
(1,872)
Other current liabilities
(712)
Employee benefits
(272)
Deferred tax liabilities
(1,172)
Net identifiable assets acquired
7,050
Less: Non-controlling interests
(2,820)
Goodwill
2,820
Net assets acquired including goodwill
7,050
Goodwill arising from the acquisition of €2,820 thousand is primarily attributable to the expected synergies from combining operations of the acquiree and the acquirer. The goodwill is not deductible for tax purposes. Minor acquisition-related costs were expensed and recorded within purchased, outsourced and other costs in the consolidated statement of profit
F-97
and loss. The Group elected to recognize non-controlling interests at its proportionate share of the acquired net identifiable assets. The details of the net cash outflows related to the acquisition are shown below:
(€ thousands)
At acquisition date
Cash consideration paid
(5,880)
Cash and cash equivalents acquired
2,366
Net cash outflow - Investing activities
(3,514)
Tessitura Ubertino was consolidated in the Group’s consolidated financial statements starting on June 4, 2021, and contributed revenues of €5,625 thousand and profit of €561 thousand to the Group from that date until December 31, 2021 and revenues of €11,015 thousand and profit of €1,479 thousand in 2023 (€10,210 thousand and €938 thousand in 2022, respectively). If the acquisition had occurred on January 1, 2021, the consolidated statement of profit and loss the year ended December 31, 2021 would have included additional revenues for €3,987 thousand and profit for the year of €674 thousand.
Contingent deferred consideration relating to the acquisition of Gruppo Dondi S.p.A.
In 2021 the Group paid contingent deferred consideration of €710 thousand relating to the acquisition of Dondi, which was completed in July 2019, based on the achievement of certain predetermined performance targets by Dondi.
40. Subsequent events
The Group has evaluated subsequent events through April 4, 2024 which is the date the Consolidated Financial Statements were authorized for issuance, and identified the following events, all of which are non-adjusting as defined in IAS 10:
On January 1, 2024, the Group acquired the 100% interests in Ermenegildo Zegna Korea Co. Ltd. for a consideration of €9 million, through which, the Group began directly operating its South Korean business and its network of 15 stores. The purchase price allocation process is still at a preliminary stage due to the proximity of the acquisition date to the date of the issuance of the financial statements. Therefore, certain valuations have yet to commence or progress to a stage where there is sufficient information for these measurements to be made. The finalization of fair values for assets acquired and liabilities assumed, with limited exceptions as provided under IFRS 3, will occur during the one year measurement period provided for by IFRS 3.
On January 30, 2024, the Group announced the renewal of its licensing agreement with Marcolin to produce ZEGNA-branded eyewear through the end of 2030, continuing the strong partnership built between the companies since it was launched in 2015.
On January 30, 2024, the Board confirmed the level of achievement of the performance market condition and the service condition applicable at December 31, 2023 to the second tranche of awards under the CEO IPO PSUs. As a result of such confirmation, 360,000 ordinary shares vested at December 31, 2023 and will be delivered to the CEO in due course.
On January 30, 2024, the Board confirmed the level of achievement of the performance market condition and the service condition applicable at December 31, 2023 to the second tranche of awards under the Management IPO PSUs. As a result of such confirmation, 430,000 ordinary shares vested at December 31, 2023 and will be delivered to the members of management in due course.
On February 8, 2024, the Group announced plans to open a new luxury footwear and leather goods production facility in Sala Baganza (Parma, Italy). Encompassing 12,500 square meters, the facility is expected to be completed by the end of 2026 and will expand the Group’s production capacity, focusing mainly on men’s footwear and leather goods. The new facility will also act as a research and development center and is expected to employ over 300 employees at full capacity in 2027. In February 2024, the Group spent €8.5 million for the acquisition of the plot of land on which it will build the new facility. Details of the construction project, including the overall expenditure, are yet to be determined.
F-98
On April 4, 2024, the Board of Directors determined the level of achievement of the performance conditions applicable to the awards under the CEO 2022-2024 LTIP in relation to the 2023 performance period. As a result of such determination, 588,000 ordinary shares vested and will be delivered to the Chairman and CEO in due course.
On April 4, 2024, the Board of Directors of Zegna proposed to make a dividend distribution of €0.12 per share to holders of the Company's ordinary shares, corresponding to a total dividend distribution of approximately €30 million. The dividend proposal is subject to the finalization and adoption of the annual statutory accounts of the Company (provided that the distribution is permitted under Dutch law) and to the approval of the Company's shareholders at the 2024 annual general meeting, which is expected to be held on June 26, 2024.