


Investors in Fidelity National Information Services (NYSE:FIS) Have Unfortunately Lost 39% Over the Last Five Years
Investors in Fidelity National Information Services (NYSE:FIS) Have Unfortunately Lost 39% Over the Last Five Years
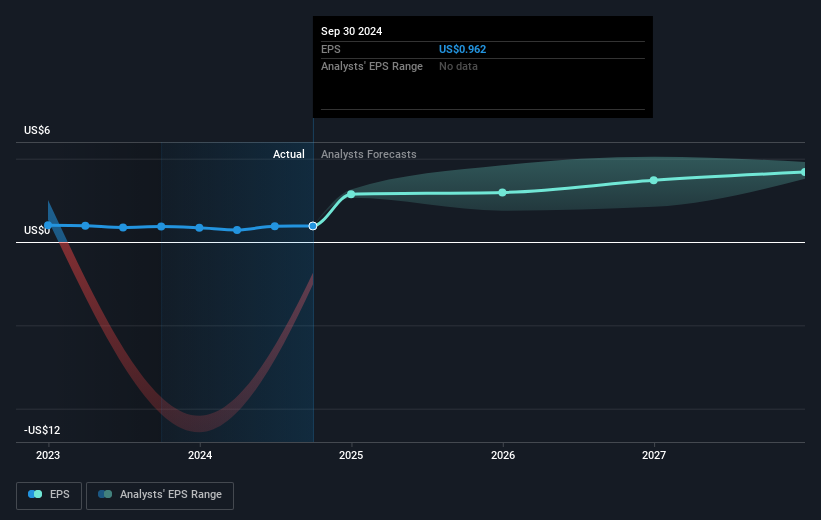
 Looking back five years, both Fidelity National Information Services' share price and EPS declined; the latter at a rate of 13% per year. Notably, the share price has fallen at 11% per year, fairly close to the change in the EPS. That suggests that the market sentiment around the company hasn't changed much over that time. Rather, the share price change has reflected changes in earnings per share.
The main aim of stock picking is to find the market-beating stocks. But even the best stock picker will only win with some selections. So we wouldn't blame long term Fidelity National Information Services, Inc. (NYSE:FIS) shareholders for doubting their decision to hold, with the stock down 44% over a half decade.
選擇股票的主要目標是找到超越市場的股票。但即使是最優秀的選股者,最終也只能在某些選擇中獲勝。因此,我們不會指責長揸繁德信息技術公司(紐交所:FIS)股份的股東對他們決定持有的懷疑,因爲在過去五年中,該股票下跌了44%。
With that in mind, it's worth seeing if the company's underlying fundamentals have been the driver of long term performance, or if there are some discrepancies.
鑑於此,值得看看該公司的基本面是否一直是長期業績的驅動因素,或者是否存在一些不一致之處。
To paraphrase Benjamin Graham: Over the short term the market is a voting machine, but over the long term it's a weighing machine. One imperfect but simple way to consider how the market perception of a company has shifted is to compare the change in the earnings per share (EPS) with the share price movement.
用本傑明·格雷厄姆的話說:短期內市場是投票機,但長期來看它是稱重機。有一個不完美但簡單的方法來考慮市場對公司看法的變化,就是比較每股收益(EPS)的變化和股價的波動。
Looking back five years, both Fidelity National Information Services' share price and EPS declined; the latter at a rate of 13% per year. Notably, the share price has fallen at 11% per year, fairly close to the change in the EPS. That suggests that the market sentiment around the company hasn't changed much over that time. Rather, the share price change has reflected changes in earnings per share.
回顧五年前,繁德信息技術的股價和每股收益都在下降;後者的年降幅爲13%。值得注意的是,股價每年下降11%,與每股收益的變化非常接近。這表明,該公司的市場情緒在這段時間內並沒有太大變化。相反,股價的變化反映了每股收益的變化。
The image below shows how EPS has tracked over time (if you click on the image you can see greater detail).
下面的圖像顯示了EPS隨時間的變化(如果你點擊圖像,可以看到更詳細的信息)。
It is of course excellent to see how Fidelity National Information Services has grown profits over the years, but the future is more important for shareholders. Take a more thorough look at Fidelity National Information Services' financial health with this free report on its balance sheet.
當然,看到繁德信息技術多年來利潤增長是非常好的,但對股東來說,未來才更爲重要。請查看這份關於其資產負債表的免費報告,以更全面地了解繁德信息技術的財務健康狀況。
What About Dividends?
關於分紅派息的問題
When looking at investment returns, it is important to consider the difference between total shareholder return (TSR) and share price return. The TSR is a return calculation that accounts for the value of cash dividends (assuming that any dividend received was reinvested) and the calculated value of any discounted capital raisings and spin-offs. Arguably, the TSR gives a more comprehensive picture of the return generated by a stock. As it happens, Fidelity National Information Services' TSR for the last 5 years was -39%, which exceeds the share price return mentioned earlier. This is largely a result of its dividend payments!
在考慮投資回報時,重要的是要考慮總股東回報(TSR)和股票價格回報之間的差異。TSR是一種回報計算,考慮了現金分紅的價值(假設收到的任何分紅被再投資)以及任何折扣融資和分拆的計算價值。可以說,TSR提供了更全面的股票回報生成情況。實際上,繁德信息技術過去5年的TSR爲-39%,這超過了之前提到的股票價格回報。這在很大程度上是由於其分紅支付所致!
A Different Perspective
不同的視角
It's good to see that Fidelity National Information Services has rewarded shareholders with a total shareholder return of 33% in the last twelve months. And that does include the dividend. That certainly beats the loss of about 7% per year over the last half decade. The long term loss makes us cautious, but the short term TSR gain certainly hints at a brighter future. While it is well worth considering the different impacts that market conditions can have on the share price, there are other factors that are even more important. Take risks, for example - Fidelity National Information Services has 3 warning signs we think you should be aware of.
看到繁德信息技術在過去十二個月內爲股東帶來了33%的總股東回報,令人欣慰。並且這包括了分紅。這絕對超過了過去五年每年約7%的損失。長期的損失讓我們感到謹慎,但短期的TSR增長無疑暗示了更光明的未來。在考慮市場條件對股票價格的不同影響時,確實值得注意,還有其他更重要的因素。例如風險——繁德信息技術有3個我們認爲您應當注意的警示信號。
Of course, you might find a fantastic investment by looking elsewhere. So take a peek at this free list of companies we expect will grow earnings.
當然,你可能會通過其他地方尋找一個絕佳的投資機會。所以請查看這個我們預計將增長每股收益的公司免費列表。
Please note, the market returns quoted in this article reflect the market weighted average returns of stocks that currently trade on American exchanges.
請注意,本文中引用的市場回報反映了當前在美國交易所上市股票的市場加權平均回報。
Have feedback on this article? Concerned about the content? Get in touch with us directly. Alternatively, email editorial-team (at) simplywallst.com.
This article by Simply Wall St is general in nature. We provide commentary based on historical data and analyst forecasts only using an unbiased methodology and our articles are not intended to be financial advice. It does not constitute a recommendation to buy or sell any stock, and does not take account of your objectives, or your financial situation. We aim to bring you long-term focused analysis driven by fundamental data. Note that our analysis may not factor in the latest price-sensitive company announcements or qualitative material. Simply Wall St has no position in any stocks mentioned.
對本文有反饋?對內容有疑慮?請直接與我們聯繫。或者,發送電子郵件至 editorial-team (at) simplywallst.com。
這篇來自Simply Wall ST的文章是一般性的。我們根據歷史數據和分析師預測提供評論,採用無偏見的方法,我們的文章並不旨在提供財務建議。它不構成對任何股票的買入或賣出建議,也未考慮到您的目標或財務狀況。我們旨在爲您提供以基本數據驅動的長期分析。請注意,我們的分析可能未考慮最新的價格敏感公司公告或定性材料。Simply Wall ST在提到的任何股票中均沒有持倉。
譯文內容由第三人軟體翻譯。


評論(0)
請選擇舉報原因