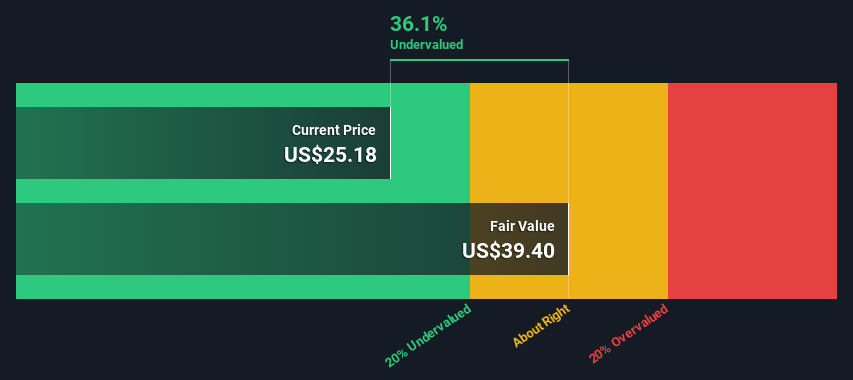
Using the 2 Stage Free Cash Flow to Equity, Quanex Building Products fair value estimate is US$39.40
Current share price of US$25.18 suggests Quanex Building Products is potentially 36% undervalued
The US$36.33 analyst price target for NX is 7.8% less than our estimate of fair value
How far off is Quanex Building Products Corporation (NYSE:NX) from its intrinsic value? Using the most recent financial data, we'll take a look at whether the stock is fairly priced by taking the expected future cash flows and discounting them to today's value. We will take advantage of the Discounted Cash Flow (DCF) model for this purpose. Models like these may appear beyond the comprehension of a lay person, but they're fairly easy to follow.
Companies can be valued in a lot of ways, so we would point out that a DCF is not perfect for every situation. If you still have some burning questions about this type of valuation, take a look at the Simply Wall St analysis model.
The Model
We use what is known as a 2-stage model, which simply means we have two different periods of growth rates for the company's cash flows. Generally the first stage is higher growth, and the second stage is a lower growth phase. In the first stage we need to estimate the cash flows to the business over the next ten years. Where possible we use analyst estimates, but when these aren't available we extrapolate the previous free cash flow (FCF) from the last estimate or reported value. We assume companies with shrinking free cash flow will slow their rate of shrinkage, and that companies with growing free cash flow will see their growth rate slow, over this period. We do this to reflect that growth tends to slow more in the early years than it does in later years.
A DCF is all about the idea that a dollar in the future is less valuable than a dollar today, so we discount the value of these future cash flows to their estimated value in today's dollars:
10-year free cash flow (FCF) forecast
2025
2026
2027
2028
2029
2030
2031
2032
2033
2034
Levered FCF ($, Millions)
US$95.6m
US$116.4m
US$121.9m
US$126.9m
US$131.6m
US$136.0m
US$140.2m
US$144.4m
US$148.5m
US$152.7m
Growth Rate Estimate Source
Analyst x2
Analyst x2
Est @ 4.74%
Est @ 4.10%
Est @ 3.66%
Est @ 3.35%
Est @ 3.13%
Est @ 2.98%
Est @ 2.87%
Est @ 2.79%
Present Value ($, Millions) Discounted @ 9.0%
US$87.7
US$98.0
US$94.1
US$89.9
US$85.5
US$81.0
US$76.7
US$72.4
US$68.3
US$64.4
("Est" = FCF growth rate estimated by Simply Wall St) Present Value of 10-year Cash Flow (PVCF) = US$818m
The second stage is also known as Terminal Value, this is the business's cash flow after the first stage. The Gordon Growth formula is used to calculate Terminal Value at a future annual growth rate equal to the 5-year average of the 10-year government bond yield of 2.6%. We discount the terminal cash flows to today's value at a cost of equity of 9.0%.
Present Value of Terminal Value (PVTV)= TV / (1 + r)10= US$2.5b÷ ( 1 + 9.0%)10= US$1.0b
The total value, or equity value, is then the sum of the present value of the future cash flows, which in this case is US$1.9b. To get the intrinsic value per share, we divide this by the total number of shares outstanding. Compared to the current share price of US$25.2, the company appears quite good value at a 36% discount to where the stock price trades currently. Valuations are imprecise instruments though, rather like a telescope - move a few degrees and end up in a different galaxy. Do keep this in mind.
NYSE:NX Discounted Cash Flow December 25th 2024
Important Assumptions
Now the most important inputs to a discounted cash flow are the discount rate, and of course, the actual cash flows. If you don't agree with these result, have a go at the calculation yourself and play with the assumptions. The DCF also does not consider the possible cyclicality of an industry, or a company's future capital requirements, so it does not give a full picture of a company's potential performance. Given that we are looking at Quanex Building Products as potential shareholders, the cost of equity is used as the discount rate, rather than the cost of capital (or weighted average cost of capital, WACC) which accounts for debt. In this calculation we've used 9.0%, which is based on a levered beta of 1.551. Beta is a measure of a stock's volatility, compared to the market as a whole. We get our beta from the industry average beta of globally comparable companies, with an imposed limit between 0.8 and 2.0, which is a reasonable range for a stable business.
SWOT Analysis for Quanex Building Products
Strength
Dividends are covered by earnings and cash flows.
Dividend information for NX.
Weakness
Earnings declined over the past year.
Interest payments on debt are not well covered.
Dividend is low compared to the top 25% of dividend payers in the Building market.
Shareholders have been diluted in the past year.
Opportunity
Annual earnings are forecast to grow faster than the American market.
Good value based on P/E ratio and estimated fair value.
Threat
Debt is not well covered by operating cash flow.
Revenue is forecast to grow slower than 20% per year.
Is NX well equipped to handle threats?
Looking Ahead:
Valuation is only one side of the coin in terms of building your investment thesis, and it ideally won't be the sole piece of analysis you scrutinize for a company. It's not possible to obtain a foolproof valuation with a DCF model. Preferably you'd apply different cases and assumptions and see how they would impact the company's valuation. If a company grows at a different rate, or if its cost of equity or risk free rate changes sharply, the output can look very different. Why is the intrinsic value higher than the current share price? For Quanex Building Products, we've compiled three important elements you should consider:
Risks: Be aware that Quanex Building Products is showing 3 warning signs in our investment analysis , and 1 of those is a bit unpleasant...
Future Earnings: How does NX's growth rate compare to its peers and the wider market? Dig deeper into the analyst consensus number for the upcoming years by interacting with our free analyst growth expectation chart.
Other High Quality Alternatives: Do you like a good all-rounder? Explore our interactive list of high quality stocks to get an idea of what else is out there you may be missing!
PS. Simply Wall St updates its DCF calculation for every American stock every day, so if you want to find the intrinsic value of any other stock just search here.
Have feedback on this article? Concerned about the content?Get in touch with us directly. Alternatively, email editorial-team (at) simplywallst.com. This article by Simply Wall St is general in nature. We provide commentary based on historical data and analyst forecasts only using an unbiased methodology and our articles are not intended to be financial advice. It does not constitute a recommendation to buy or sell any stock, and does not take account of your objectives, or your financial situation. We aim to bring you long-term focused analysis driven by fundamental data. Note that our analysis may not factor in the latest price-sensitive company announcements or qualitative material. Simply Wall St has no position in any stocks mentioned.
關鍵洞察
在利用二階段自由現金流法計算權益時,Quanex Building Products的公允價值估計爲39.40美元
目前的股價爲25.18美元,表明Quanex Building Products可能被低估了36%
分析師對NX的目標價爲36.33美元,比我們的公允價值估計低7.8%
Quanex Building Products Corporation(紐交所:NX)離其內在價值還有多遠?根據最新的財務數據,我們將查看該股票是否合理定價,通過將預期未來現金流折現到今天的價值。我們將利用折現現金流(DCF)模型來實現這一目標。這樣的模型可能看起來超出普通人的理解,但其實相對容易跟隨。
進行折現現金流計算時,最重要的輸入是折現率,當然還有實際的現金流。如果你不同意這些結果,可以自己重新計算一下,修改假設。DCF還不考慮行業的週期性或公司的未來資本需求,因此並不能全面展現一家公司的潛在表現。考慮到我們將Quanex Building Products視爲潛在股東,使用股本成本作爲折現率,而不是資本成本(或加權平均資本成本,WACC),後者考慮了債務。在這個計算中,我們使用了9.0%,基於1.551的槓桿貝塔。貝塔衡量的是股票相對於整個市場的波動性。我們從全球可比公司的行業平均貝塔中獲得我們的貝塔,設定的範圍在0.8到2.0之間,這是一個穩定業務的合理區間。
Quanex Building Products的SWOT分析
優勢
分紅派息由收入和現金流決定。
NX的分紅派息信息。
劣勢
過去一年盈利下降。
債務的利息支付覆蓋率不高。
與建築市場中前25%的分紅派息公司相比,分紅較低。
過去一年,股東們的股份被稀釋了。
機會
預計年度盈利增長將快於美國市場。
基於市盈率和估計公允價值,具有良好的價值。
威脅
運營現金流無法很好地覆蓋債務。
預計營業收入的年增長率將低於20%。
NX是否具備應對威脅的能力?
展望未來:
估值只是構建投資論點的一個方面,理想情況下它不會是你對一家公司進行審視的唯一分析內容。通過貼現現金流(DCF)模型不可能獲得萬無一失的估值。最好是應用不同的案例和假設,看看它們如何影響公司的估值。如果一家公司以不同的速度成長,或者其股本成本或無風險利率發生劇烈變化,輸出結果可能會大相徑庭。爲什麼內在價值高於當前的股票價格?對於Quanex Building Products,我們整合了你應該考慮的三個重要因素:
風險:請注意,Quanex Building Products在我們的投資分析中顯示出3個警告信號,其中有1個信號稍顯不宜...

 A DCF is all about the idea that a dollar in the future is less valuable than a dollar today, so we discount the value of these future cash flows to their estimated value in today's dollars:
  DCF的核心理念是,未來的一美元不如今天的一美元有價值,因此我們將這些未來現金流的價值折算爲今天的估計值: