
Cabot's (NYSE:CBT) Five-year Total Shareholder Returns Outpace the Underlying Earnings Growth
Cabot's (NYSE:CBT) Five-year Total Shareholder Returns Outpace the Underlying Earnings Growth
 Over half a decade, Cabot managed to grow its earnings per share at 21% a year. This EPS growth is higher than the 14% average annual increase in the share price. So it seems the market isn't so enthusiastic about the stock these days.
 It might be of some concern to shareholders to see the Cabot Corporation (NYSE:CBT) share price down 16% in the last month. While that's not great, the returns over five years have been decent. The share price is up 97%, which is better than the market return of 96%.
股東們可能會對卡博特公司(紐交所:CBT)在過去一個月股價下跌16%感到擔憂。雖然這不是很好,但過去五年的回報相對不錯。股價上漲了97%,這比市場回報的96%還要好。
Since the long term performance has been good but there's been a recent pullback of 11%, let's check if the fundamentals match the share price.
由於長期表現良好,但最近出現了11%的回調,我們來檢查一下基本面是否與股價相符。
In his essay The Superinvestors of Graham-and-Doddsville Warren Buffett described how share prices do not always rationally reflect the value of a business. One flawed but reasonable way to assess how sentiment around a company has changed is to compare the earnings per share (EPS) with the share price.
在他的文章《Graham-and-Doddsville超級投資者》中,禾倫·巴菲特描述了股價並不總是理性反映業務價值的情況。一個有缺陷但合理的評估公司情緒變化的方法是將每股收益(EPS)與股價進行比較。
Over half a decade, Cabot managed to grow its earnings per share at 21% a year. This EPS growth is higher than the 14% average annual increase in the share price. So it seems the market isn't so enthusiastic about the stock these days.
在過去的五年中,卡博特公司每年的每股收益增長達21%。這個每股收益的增長高於股價平均每年14%的增長。因此,看來市場對這隻股票的熱情近來並不高。
The company's earnings per share (over time) is depicted in the image below (click to see the exact numbers).
公司的每股收益(隨時間)如下圖所示(點擊查看確切數字)。
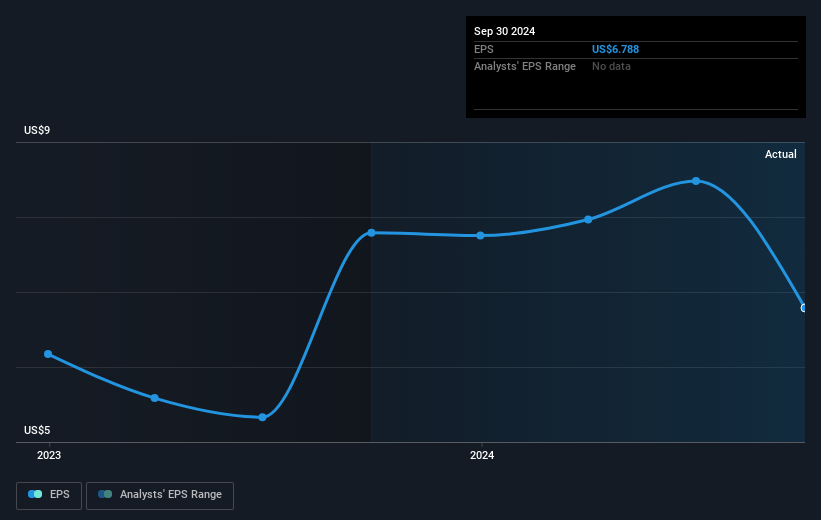
Dive deeper into Cabot's key metrics by checking this interactive graph of Cabot's earnings, revenue and cash flow.
通過查看卡博特的收益、營業收入和現金流的互動圖表,深入了解卡博特的關鍵指標。
What About Dividends?
關於分紅派息的問題
When looking at investment returns, it is important to consider the difference between total shareholder return (TSR) and share price return. The TSR incorporates the value of any spin-offs or discounted capital raisings, along with any dividends, based on the assumption that the dividends are reinvested. It's fair to say that the TSR gives a more complete picture for stocks that pay a dividend. We note that for Cabot the TSR over the last 5 years was 122%, which is better than the share price return mentioned above. And there's no prize for guessing that the dividend payments largely explain the divergence!
在考慮投資回報時,重要的是要考慮總股東回報(TSR)與股價回報之間的差異。TSR包含任何分拆或折扣融資的價值,以及任何分紅派息,前提是假設這些分紅派息被再投資。可以公平地說,TSR爲支付分紅的股票提供了更完整的圖景。我們注意到,卡博特在過去5年中的TSR爲122%,這優於上述的股價回報。而且,不用猜測,分紅派息的發放在很大程度上解釋了這種差異!
A Different Perspective
不同的視角
Cabot provided a TSR of 9.9% over the last twelve months. Unfortunately this falls short of the market return. It's probably a good sign that the company has an even better long term track record, having provided shareholders with an annual TSR of 17% over five years. It may well be that this is a business worth popping on the watching, given the continuing positive reception, over time, from the market. It's always interesting to track share price performance over the longer term. But to understand Cabot better, we need to consider many other factors. Consider risks, for instance. Every company has them, and we've spotted 2 warning signs for Cabot you should know about.
卡博特在過去十二個月提供了9.9%的TSR。不幸的是,這不及市場回報。可能這是一個好兆頭,該公司長期以來的業績更好,在五年內爲股東提供了17%的年TSR。這可能是一個值得關注的業務,因爲隨着時間的推移,市場對其的持續積極反應。長期跟蹤股價表現總是很有趣。但要更好地了解卡博特,我們需要考慮許多其他因素。例如,考慮風險。每個公司都有風險,我們發現卡博特有2個您應該知道的警示信號。
Of course, you might find a fantastic investment by looking elsewhere. So take a peek at this free list of companies we expect will grow earnings.
當然,你可能會通過其他地方尋找一個絕佳的投資機會。所以請查看這個我們預計將增長每股收益的公司免費列表。
Please note, the market returns quoted in this article reflect the market weighted average returns of stocks that currently trade on American exchanges.
請注意,本文中引用的市場回報反映了當前在美國交易所上市股票的市場加權平均回報。
Have feedback on this article? Concerned about the content? Get in touch with us directly. Alternatively, email editorial-team (at) simplywallst.com.
This article by Simply Wall St is general in nature. We provide commentary based on historical data and analyst forecasts only using an unbiased methodology and our articles are not intended to be financial advice. It does not constitute a recommendation to buy or sell any stock, and does not take account of your objectives, or your financial situation. We aim to bring you long-term focused analysis driven by fundamental data. Note that our analysis may not factor in the latest price-sensitive company announcements or qualitative material. Simply Wall St has no position in any stocks mentioned.
對本文有反饋?對內容有疑慮?請直接與我們聯繫。或者,發送電子郵件至 editorial-team (at) simplywallst.com。
這篇來自Simply Wall ST的文章是一般性的。我們根據歷史數據和分析師預測提供評論,採用無偏見的方法,我們的文章並不旨在提供財務建議。它不構成對任何股票的買入或賣出建議,也未考慮到您的目標或財務狀況。我們旨在爲您提供以基本數據驅動的長期分析。請注意,我們的分析可能未考慮最新的價格敏感公司公告或定性材料。Simply Wall ST在提到的任何股票中均沒有持倉。
譯文內容由第三人軟體翻譯。
