
Is Rush Street Interactive, Inc. (NYSE:RSI) Trading At A 32% Discount?
Is Rush Street Interactive, Inc. (NYSE:RSI) Trading At A 32% Discount?
 A DCF is all about the idea that a dollar in the future is less valuable than a dollar today, so we discount the value of these future cash flows to their estimated value in today's dollars:
 Key Insights
關鍵洞察
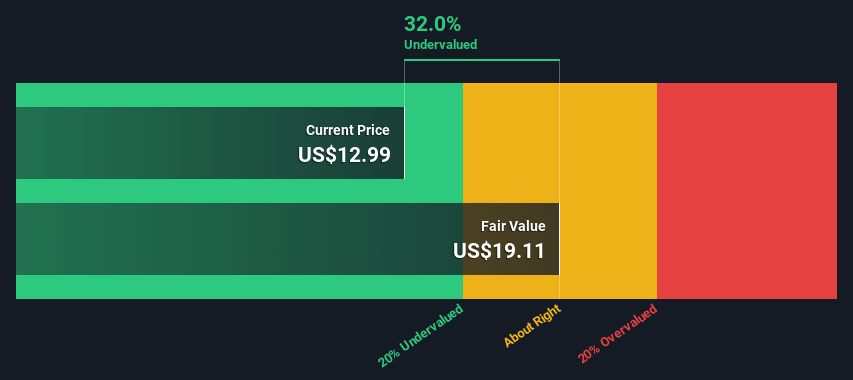
- The projected fair value for Rush Street Interactive is US$19.11 based on 2 Stage Free Cash Flow to Equity
- Rush Street Interactive is estimated to be 32% undervalued based on current share price of US$12.99
- The US$14.38 analyst price target for RSI is 25% less than our estimate of fair value
- Rush Street Interactive的預計公允價值爲19.11美元,基於2階段自由現金流對股本的計算。
- Rush Street Interactive的當前股價爲12.99美元,預計被低估32%。
- 分析師對RSI的14.38美元目標價比我們估算的公允價值低25%。
In this article we are going to estimate the intrinsic value of Rush Street Interactive, Inc. (NYSE:RSI) by estimating the company's future cash flows and discounting them to their present value. We will take advantage of the Discounted Cash Flow (DCF) model for this purpose. It may sound complicated, but actually it is quite simple!
在本文中,我們將通過估算Rush Street Interactive, Inc.(紐交所:RSI)的未來現金流並將其折現至現值來估算其內在價值。我們將利用折現現金流(DCF)模型來實現這一目的。這聽起來可能很複雜,但實際上非常簡單!
We generally believe that a company's value is the present value of all of the cash it will generate in the future. However, a DCF is just one valuation metric among many, and it is not without flaws. Anyone interested in learning a bit more about intrinsic value should have a read of the Simply Wall St analysis model.
我們通常認爲公司的價值是它未來所有現金流的現值。然而,DCF只是一種估值指標,並不是沒有缺陷的。任何對內在價值感興趣的人都應該閱讀一下Simply Wall St的分析模型。
The Calculation
計算
We're using the 2-stage growth model, which simply means we take in account two stages of company's growth. In the initial period the company may have a higher growth rate and the second stage is usually assumed to have a stable growth rate. To start off with, we need to estimate the next ten years of cash flows. Where possible we use analyst estimates, but when these aren't available we extrapolate the previous free cash flow (FCF) from the last estimate or reported value. We assume companies with shrinking free cash flow will slow their rate of shrinkage, and that companies with growing free cash flow will see their growth rate slow, over this period. We do this to reflect that growth tends to slow more in the early years than it does in later years.
我們使用的是兩階段增長模型,這意味着我們考慮公司的兩個增長階段。在初始階段,公司可能會有更高的增長率,而第二階段通常假設有穩定的增長率。首先,我們需要估算未來十年的現金流。在可能的情況下,我們使用分析師的估計,但當這些不可用時,我們從最近的估算或報告值中推算出之前的自由現金流(FCF)。我們假設自由現金流減少的公司會減緩其減小速度,而自由現金流增長的公司在這一期間將會看到其增長率放緩。我們這樣做是爲了反映出,增長在早期往往比晚期更容易減緩。
A DCF is all about the idea that a dollar in the future is less valuable than a dollar today, so we discount the value of these future cash flows to their estimated value in today's dollars:
DCF的核心理念是,未來的一美元不如今天的一美元有價值,因此我們將這些未來現金流的價值折算爲今天的估計值:
10-year free cash flow (FCF) forecast
10年自由現金流(FCF)預測
| 2025 | 2026 | 2027 | 2028 | 2029 | 2030 | 2031 | 2032 | 2033 | 2034 | |
| Levered FCF ($, Millions) | US$103.5m | US$137.3m | US$163.1m | US$186.0m | US$205.6m | US$222.5m | US$237.0m | US$249.7m | US$261.0m | US$271.3m |
| Growth Rate Estimate Source | Analyst x5 | Analyst x3 | Est @ 18.86% | Est @ 13.99% | Est @ 10.58% | Est @ 8.19% | Est @ 6.52% | Est @ 5.35% | Est @ 4.53% | Est @ 3.96% |
| Present Value ($, Millions) Discounted @ 7.3% | US$96.5 | US$119 | US$132 | US$140 | US$145 | US$146 | US$145 | US$142 | US$139 | US$135 |
| 2025 | 2026 | 2027 | 2028 | 2029 | 2030 | 2031 | 2032 | 2033 | 2034 | |
| 槓桿自由現金流($萬) | 1.035億美元 | 1.373億美元 | 163.1百萬美元 | 1.86億美元 | 205.6百萬美元 | 222.5百萬美元 | 2.37億美元 | 2.497億美元 | 2.61億美元 | 2.713億美元 |
| 成長率估計來源 | 分析師 x5 | 分析師 x3 | 估計 @ 18.86% | 估計 @ 13.99% | 估計 @ 10.58% | 估計 @ 8.19% | 估計 @ 6.52% | 估計 @ 5.35% | 估計 @ 4.53% | 估計 @ 3.96% |
| 現值($萬)按照 7.3% 折現 | 96.5美元 | 119美元 | 美金132 | 140美元 | 美金145 | 146美元 | 美金145 | 142美元 | 美元139 | 135美元 |
("Est" = FCF growth rate estimated by Simply Wall St)
Present Value of 10-year Cash Flow (PVCF) = US$1.3b
("預估" = 由Simply Wall St估計的自由現金流增長率)
10年現金流的現值 (PVCF) = 13億美元
After calculating the present value of future cash flows in the initial 10-year period, we need to calculate the Terminal Value, which accounts for all future cash flows beyond the first stage. For a number of reasons a very conservative growth rate is used that cannot exceed that of a country's GDP growth. In this case we have used the 5-year average of the 10-year government bond yield (2.6%) to estimate future growth. In the same way as with the 10-year 'growth' period, we discount future cash flows to today's value, using a cost of equity of 7.3%.
在計算初始10年期未來現金流的現值後,我們需要計算終值,該終值考慮了第一階段之後的所有未來現金流。出於多種原因,採用的增長率非常保守,不能超過國家GDP的增長率。在這種情況下,我們使用10年期政府債券收益率的5年平均值(2.6%)來估算未來的增長。與10年期的「增長」階段相同,我們使用7.3%的權益成本將未來現金流折現到今天的價值。
Terminal Value (TV)= FCF2034 × (1 + g) ÷ (r – g) = US$271m× (1 + 2.6%) ÷ (7.3%– 2.6%) = US$6.0b
終值 (TV) = 自由現金流2034 × (1 + g) ÷ (r – g) = 2.71億美元 × (1 + 2.6%) ÷ (7.3% – 2.6%) = 60億美元
Present Value of Terminal Value (PVTV)= TV / (1 + r)10= US$6.0b÷ ( 1 + 7.3%)10= US$3.0b
終值現值 (PVTV) = TV / (1 + r)10 = 60億美元 ÷ (1 + 7.3%)10 = 30億美元
The total value is the sum of cash flows for the next ten years plus the discounted terminal value, which results in the Total Equity Value, which in this case is US$4.3b. In the final step we divide the equity value by the number of shares outstanding. Compared to the current share price of US$13.0, the company appears quite good value at a 32% discount to where the stock price trades currently. The assumptions in any calculation have a big impact on the valuation, so it is better to view this as a rough estimate, not precise down to the last cent.
總價值是未來十年的現金流總和加上折現後的終值,這樣得出的總股權價值在這種情況下是43億美元。最後一步是將股權價值除以在外流通的股份數。與當前每股價格13.0美元相比,公司的價值在股票價格目前交易的基礎上有32%的折扣,顯得相當不錯。任何計算中的假設對估值都有很大影響,因此最好將其視爲粗略估計,而不是精確到最後一分。
The Assumptions
假設
The calculation above is very dependent on two assumptions. The first is the discount rate and the other is the cash flows. You don't have to agree with these inputs, I recommend redoing the calculations yourself and playing with them. The DCF also does not consider the possible cyclicality of an industry, or a company's future capital requirements, so it does not give a full picture of a company's potential performance. Given that we are looking at Rush Street Interactive as potential shareholders, the cost of equity is used as the discount rate, rather than the cost of capital (or weighted average cost of capital, WACC) which accounts for debt. In this calculation we've used 7.3%, which is based on a levered beta of 1.127. Beta is a measure of a stock's volatility, compared to the market as a whole. We get our beta from the industry average beta of globally comparable companies, with an imposed limit between 0.8 and 2.0, which is a reasonable range for a stable business.
以上計算非常依賴於兩個假設。第一個是折現率,另一個是現金流。你不必同意這些輸入,我建議你自己重新做計算並進行調整。DCF也沒有考慮行業的可能週期性,或公司的未來資本需求,因此不會提供公司潛在表現的全面圖景。考慮到我們正在將Rush Street Interactive視爲潛在股東,股權成本被用作折現率,而不是資本成本(或加權平均資本成本,WACC),後者考慮了債務。在這次計算中,我們使用了7.3%,這是基於1.127的槓桿貝塔。貝塔是股價相對於整體市場的波動性指標。我們從全球可比公司的行業平均貝塔中獲得我們的貝塔,施加的限制在0.8到2.0之間,這是一個穩定業務的合理區間。
Moving On:
繼續前進:
Whilst important, the DCF calculation is only one of many factors that you need to assess for a company. It's not possible to obtain a foolproof valuation with a DCF model. Instead the best use for a DCF model is to test certain assumptions and theories to see if they would lead to the company being undervalued or overvalued. For example, changes in the company's cost of equity or the risk free rate can significantly impact the valuation. Can we work out why the company is trading at a discount to intrinsic value? For Rush Street Interactive, we've put together three fundamental factors you should assess:
雖然DCF計算很重要,但它只是您需要評估公司的衆多因素之一。使用DCF模型無法獲得絕對可靠的估值。相反,DCF模型最好的用途是測試某些假設和理論,以看看它們是否會導致公司被低估或高估。例如,公司權益成本或無風險利率的變化會顯著影響估值。我們能找到公司爲何以折扣交易於內在價值的原因嗎?對於Rush Street Interactive,我們整理了您應該評估的三個基本因素:
- Risks: To that end, you should be aware of the 1 warning sign we've spotted with Rush Street Interactive .
- Management:Have insiders been ramping up their shares to take advantage of the market's sentiment for RSI's future outlook? Check out our management and board analysis with insights on CEO compensation and governance factors.
- Other Solid Businesses: Low debt, high returns on equity and good past performance are fundamental to a strong business. Why not explore our interactive list of stocks with solid business fundamentals to see if there are other companies you may not have considered!
- 風險:爲此,您應該意識到我們發現Rush Street Interactive的一個警告信號。
- 管理層:內部人是否正在增加他們的股份,以利用市場對RSI未來前景的情緒?查看我們的管理層和董事會分析,其中包括對首席執行官薪酬和治理因素的見解。
- 其他穩健業務:低負債、高股本回報率和良好的過去表現是強大業務的基礎。爲何不探索我們的互動股票列表,查看是否還有其他你可能未曾考慮的公司!
PS. The Simply Wall St app conducts a discounted cash flow valuation for every stock on the NYSE every day. If you want to find the calculation for other stocks just search here.
PS. Simply Wall St應用程序每天對紐交所上的每隻股票進行折現現金流估值。如果您想查找其他股票的計算,只需在這裏搜索。
Have feedback on this article? Concerned about the content? Get in touch with us directly. Alternatively, email editorial-team (at) simplywallst.com.
This article by Simply Wall St is general in nature. We provide commentary based on historical data and analyst forecasts only using an unbiased methodology and our articles are not intended to be financial advice. It does not constitute a recommendation to buy or sell any stock, and does not take account of your objectives, or your financial situation. We aim to bring you long-term focused analysis driven by fundamental data. Note that our analysis may not factor in the latest price-sensitive company announcements or qualitative material. Simply Wall St has no position in any stocks mentioned.
對本文有反饋?對內容有疑慮?請直接與我們聯繫。或者,發送電子郵件至 editorial-team (at) simplywallst.com。
這篇來自Simply Wall St的文章是一般性的。我們根據歷史數據和分析師預測提供評論,採用無偏見的方法,我們的文章並不旨在提供財務建議。它不構成對任何股票的買入或賣出建議,也未考慮到您的目標或財務狀況。我們旨在爲您提供以基本數據驅動的長期分析。請注意,我們的分析可能未考慮最新的價格敏感公司公告或定性材料。Simply Wall St在提到的任何股票中均沒有持倉。
譯文內容由第三人軟體翻譯。
