
MYR Group (NASDAQ:MYRG) Stock Performs Better Than Its Underlying Earnings Growth Over Last Five Years
MYR Group (NASDAQ:MYRG) Stock Performs Better Than Its Underlying Earnings Growth Over Last Five Years
 During five years of share price growth, MYR Group achieved compound earnings per share (EPS) growth of 2.1% per year. This EPS growth is slower than the share price growth of 38% per year, over the same period. This suggests that market participants hold the company in higher regard, these days. That's not necessarily surprising considering the five-year track record of earnings growth. This favorable sentiment is reflected in its (fairly optimistic) P/E ratio of 69.91.
 For many, the main point of investing in the stock market is to achieve spectacular returns. While the best companies are hard to find, but they can generate massive returns over long periods. For example, the MYR Group Inc. (NASDAQ:MYRG) share price is up a whopping 400% in the last half decade, a handsome return for long term holders. If that doesn't get you thinking about long term investing, we don't know what will. It's also good to see the share price up 85% over the last quarter.
對於許多人來說,投資股票市場的主要目的是實現豐厚的回報。雖然最好的公司很難找到,但它們可以在很長的時間內產生巨大的回報。例如,MYR Group Inc.(納斯達克:MYRG)的股價在過去五年中上漲了驚人的400%,對於長揸者來說,這是豐厚的回報。如果這不能讓你考慮長期投資,我們不知道還有什麼能讓你想到。很高興看到在過去一個季度股價上漲了85%。
The past week has proven to be lucrative for MYR Group investors, so let's see if fundamentals drove the company's five-year performance.
過去一週對MYR Group的投資者來說是非常有利可圖的,所以讓我們看看基本面是否推動了公司的五年表現。
There is no denying that markets are sometimes efficient, but prices do not always reflect underlying business performance. One way to examine how market sentiment has changed over time is to look at the interaction between a company's share price and its earnings per share (EPS).
市場有時無疑是高效的,但價格並不總是反映基礎業務表現。 一種檢查市場情緒如何隨時間改變的方法是查看公司的股價與每股收益(EPS)之間的互動。
During five years of share price growth, MYR Group achieved compound earnings per share (EPS) growth of 2.1% per year. This EPS growth is slower than the share price growth of 38% per year, over the same period. This suggests that market participants hold the company in higher regard, these days. That's not necessarily surprising considering the five-year track record of earnings growth. This favorable sentiment is reflected in its (fairly optimistic) P/E ratio of 69.91.
在五年的股價增長過程中,MYR Group實現了每股收益(EPS)年增長2.1%的複合增長。這一EPS增長速度低於同期股價年增長38%。這表明市場參與者對公司的看法更爲積極。這並不奇怪,因爲公司在過去五年中實現了盈利增長。這種良好的情緒體現在其(相當樂觀的)市盈率爲69.91。
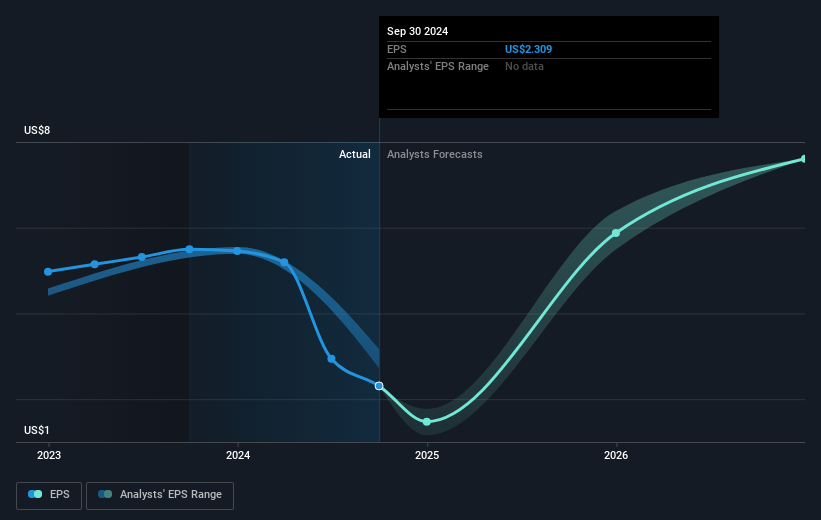
You can see how EPS has changed over time in the image below (click on the chart to see the exact values).
您可以在下面的圖片中查看每股收益如何隨時間變化(單擊圖表以查看確切的價值)。
We like that insiders have been buying shares in the last twelve months. Having said that, most people consider earnings and revenue growth trends to be a more meaningful guide to the business. It might be well worthwhile taking a look at our free report on MYR Group's earnings, revenue and cash flow.
我們喜歡內部人士在過去的十二個月內買入了股票。話雖如此,大多數人認爲盈利和營業收入增長趨勢是更有意義的業務指導。查看我們的免費報告,了解MYR Group的盈利、營業收入和現金流狀況,可能會非常有價值。
A Different Perspective
另一種看法
MYR Group provided a TSR of 22% over the last twelve months. But that return falls short of the market. On the bright side, the longer term returns (running at about 38% a year, over half a decade) look better. It may well be that this is a business worth popping on the watching, given the continuing positive reception, over time, from the market. It's always interesting to track share price performance over the longer term. But to understand MYR Group better, we need to consider many other factors. Consider risks, for instance. Every company has them, and we've spotted 1 warning sign for MYR Group you should know about.
MYR Group在過去十二個月提供了22%的總回報率。但這個回報低於市場。從積極的一面看,長期回報(每年約38%,持續超過五年)看起來更好。考慮到市場的持續積極反應,這可能是一個值得關注的業務。長期跟蹤股票價格表現總是很有趣。但爲了更好地了解MYR Group,我們需要考慮許多其他因素。例如,考慮風險。每個公司都有風險,我們發現了MYR Group的一個警告信號,您應該知道。
If you like to buy stocks alongside management, then you might just love this free list of companies. (Hint: most of them are flying under the radar).
如果您喜歡與管理層共同購買股票,那麼您可能會喜歡這個免費的公司列表(提示:大多數公司沒有受到關注)。
Please note, the market returns quoted in this article reflect the market weighted average returns of stocks that currently trade on American exchanges.
請注意,本文所引述的市場回報反映了目前在美國交易所上市的股票的市場加權平均回報。
Have feedback on this article? Concerned about the content? Get in touch with us directly. Alternatively, email editorial-team (at) simplywallst.com.
This article by Simply Wall St is general in nature. We provide commentary based on historical data and analyst forecasts only using an unbiased methodology and our articles are not intended to be financial advice. It does not constitute a recommendation to buy or sell any stock, and does not take account of your objectives, or your financial situation. We aim to bring you long-term focused analysis driven by fundamental data. Note that our analysis may not factor in the latest price-sensitive company announcements or qualitative material. Simply Wall St has no position in any stocks mentioned.
對這篇文章有反饋嗎?對內容感到擔憂嗎?請直接與我們聯繫。或者,發送電子郵件至editorial-team @ simplywallst.com。
Simply Wall St的這篇文章是一般性質的。我們僅基於歷史數據和分析師預測提供評論,使用公正的方法,我們的文章並非意在提供財務建議。這並不構成買入或賣出任何股票的建議,並且不考慮您的目標或財務狀況。我們旨在爲您帶來基於基礎數據驅動的長期聚焦分析。請注意,我們的分析可能未考慮最新的價格敏感公司公告或定性材料。Simply Wall St對提及的任何股票都沒有持倉。
譯文內容由第三人軟體翻譯。
