
Science Applications International's (NASDAQ:SAIC) 16% CAGR Outpaced the Company's Earnings Growth Over the Same Three-year Period
Science Applications International's (NASDAQ:SAIC) 16% CAGR Outpaced the Company's Earnings Growth Over the Same Three-year Period
 During three years of share price growth, Science Applications International achieved compound earnings per share growth of 6.1% per year. This EPS growth is lower than the 14% average annual increase in the share price. So it's fair to assume the market has a higher opinion of the business than it did three years ago. It is quite common to see investors become enamoured with a business, after a few years of solid progress.
 Science Applications International Corporation (NASDAQ:SAIC) shareholders have seen the share price descend 14% over the month. But that shouldn't obscure the pleasing returns achieved by shareholders over the last three years. In the last three years the share price is up, 48%: better than the market.
科學應用國際公司(納斯達克:SAIC)股東在過去一個月看到股價下降了14%。但這不應該掩蓋股東在過去三年獲得的可喜回報。過去三年中,股價上漲了48%,表現優於市場。
On the back of a solid 7-day performance, let's check what role the company's fundamentals have played in driving long term shareholder returns.
在穩定的七天表現之後,讓我們看看公司的基本面對長期股東回報的影響。
While the efficient markets hypothesis continues to be taught by some, it has been proven that markets are over-reactive dynamic systems, and investors are not always rational. One way to examine how market sentiment has changed over time is to look at the interaction between a company's share price and its earnings per share (EPS).
雖然有效市場假說仍然被一些人教授,但被證明市場是過度反應的動態系統,投資者並不總是理性的。檢查市場情緒如何隨時間變化的一種方法是看一個公司的股價與其每股收益(EPS)之間的交互作用。
During three years of share price growth, Science Applications International achieved compound earnings per share growth of 6.1% per year. This EPS growth is lower than the 14% average annual increase in the share price. So it's fair to assume the market has a higher opinion of the business than it did three years ago. It is quite common to see investors become enamoured with a business, after a few years of solid progress.
在三年的股價增長中,科學應用國際實現了每股收益年複合增長率爲6.1%。這個每股收益的增長低於14%的年均股價漲幅。因此可以合理假設,市場對該業務的看法比三年前更高。投資者在經歷了幾年穩健的進展後,常常會對一家企業產生濃厚的興趣。
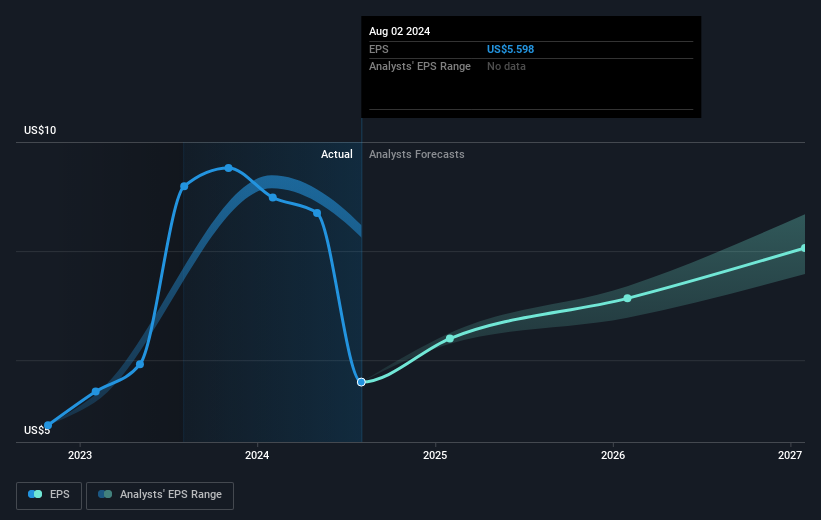
The company's earnings per share (over time) is depicted in the image below (click to see the exact numbers).
該公司的每股收益(隨時間的推移)如下圖所示(單擊可查看確切數字)。
We consider it positive that insiders have made significant purchases in the last year. Even so, future earnings will be far more important to whether current shareholders make money. Before buying or selling a stock, we always recommend a close examination of historic growth trends, available here..
我們認爲內部人士在過去一年中進行了重要的購買,這是積極的。即便如此,未來的收益將更加重要,這將決定當前股東是否獲利。在購買或出售股票之前,我們始終建議密切審查歷史增長趨勢。可在此處獲得。
What About Dividends?
關於分紅派息的問題
When looking at investment returns, it is important to consider the difference between total shareholder return (TSR) and share price return. The TSR incorporates the value of any spin-offs or discounted capital raisings, along with any dividends, based on the assumption that the dividends are reinvested. It's fair to say that the TSR gives a more complete picture for stocks that pay a dividend. In the case of Science Applications International, it has a TSR of 54% for the last 3 years. That exceeds its share price return that we previously mentioned. And there's no prize for guessing that the dividend payments largely explain the divergence!
在考慮投資回報時,理解總股東回報(TSR)與股價回報之間的區別非常重要。總股東回報考慮了任何拆分或折扣融資的價值,以及任何分紅,基於分紅被再投資的假設。可以公平地說,對於支付分紅的股票,總股東回報提供了更全面的 picture。就 科學應用國際而言,它在過去3年內的總股東回報爲54%。這超過了我們之前提到的股價回報。而且無需猜測,分紅派息在很大程度上解釋了這種差異!
A Different Perspective
另一種看法
Science Applications International shareholders are up 8.2% for the year (even including dividends). But that return falls short of the market. On the bright side, the longer term returns (running at about 10% a year, over half a decade) look better. It's quite possible the business continues to execute with prowess, even as the share price gains are slowing. It's always interesting to track share price performance over the longer term. But to understand Science Applications International better, we need to consider many other factors. Like risks, for instance. Every company has them, and we've spotted 2 warning signs for Science Applications International (of which 1 can't be ignored!) you should know about.
科學應用國際的股東今年上漲了8.2%(即使包括分紅)。但這個回報低於市場。令人欣慰的是,長期回報(每年約爲10%,過去五年)看起來更好。儘管股價漲幅放緩,業務仍有可能繼續高效執行。跟蹤長期股價表現總是很有趣。但要更好地理解科學應用國際,我們需要考慮許多其他因素。比如風險。例如,每個公司都有風險,我們發現科學應用國際有2個警告標誌(其中1個是不可忽視的!)你應該知道。
If you like to buy stocks alongside management, then you might just love this free list of companies. (Hint: most of them are flying under the radar).
如果您喜歡與管理層共同購買股票,那麼您可能會喜歡這個免費的公司列表(提示:大多數公司沒有受到關注)。
Please note, the market returns quoted in this article reflect the market weighted average returns of stocks that currently trade on American exchanges.
請注意,本文所引述的市場回報反映了目前在美國交易所上市的股票的市場加權平均回報。
Have feedback on this article? Concerned about the content? Get in touch with us directly. Alternatively, email editorial-team (at) simplywallst.com.
This article by Simply Wall St is general in nature. We provide commentary based on historical data and analyst forecasts only using an unbiased methodology and our articles are not intended to be financial advice. It does not constitute a recommendation to buy or sell any stock, and does not take account of your objectives, or your financial situation. We aim to bring you long-term focused analysis driven by fundamental data. Note that our analysis may not factor in the latest price-sensitive company announcements or qualitative material. Simply Wall St has no position in any stocks mentioned.
對這篇文章有反饋嗎?對內容感到擔憂嗎?請直接與我們聯繫。或者,發送電子郵件至editorial-team @ simplywallst.com。
Simply Wall St的這篇文章是一般性質的。我們僅基於歷史數據和分析師預測提供評論,使用公正的方法,我們的文章並非意在提供財務建議。這並不構成買入或賣出任何股票的建議,並且不考慮您的目標或財務狀況。我們旨在爲您帶來基於基礎數據驅動的長期聚焦分析。請注意,我們的分析可能未考慮最新的價格敏感公司公告或定性材料。Simply Wall St對提及的任何股票都沒有持倉。
譯文內容由第三人軟體翻譯。
