American Woodmark's (NASDAQ:AMWD) 17% CAGR Outpaced the Company's Earnings Growth Over the Same Three-year Period
American Woodmark's (NASDAQ:AMWD) 17% CAGR Outpaced the Company's Earnings Growth Over the Same Three-year Period
 American Woodmark was able to grow its EPS at 35% per year over three years, sending the share price higher. The average annual share price increase of 17% is actually lower than the EPS growth. So one could reasonably conclude that the market has cooled on the stock.
 By buying an index fund, investors can approximate the average market return. But if you buy good businesses at attractive prices, your portfolio returns could exceed the average market return. For example, the American Woodmark Corporation (NASDAQ:AMWD) share price is up 61% in the last three years, clearly besting the market return of around 20% (not including dividends). However, more recent returns haven't been as impressive as that, with the stock returning just 36% in the last year.
通過購買指數基金,投資者可以接近市場的平均回報。但是,如果你以有吸引力的價格購買優質業務,你的投資組合回報可能會超過市場的平均回報。例如,美國伍德馬克公司(納斯達克:AMWD)的股價在過去三年中上漲了61%,明顯超過了約20%的市場回報(不包括分紅派息)。然而,最近的回報並沒有那麼令人印象深刻,過去一年股票僅上漲了36%。
After a strong gain in the past week, it's worth seeing if longer term returns have been driven by improving fundamentals.
在過去的一週之內,獲得的強勁收益是否表明了長期回報受到基本面的推動值得關注。
While markets are a powerful pricing mechanism, share prices reflect investor sentiment, not just underlying business performance. One way to examine how market sentiment has changed over time is to look at the interaction between a company's share price and its earnings per share (EPS).
儘管市場是一個強大的價格機制,但股票價格反映的不僅是潛在業務績效,還反映了投資者的情緒。 了解市場情緒隨時間的變化的一種方法是查看公司的股價與每股收益(EPS)之間的互動。
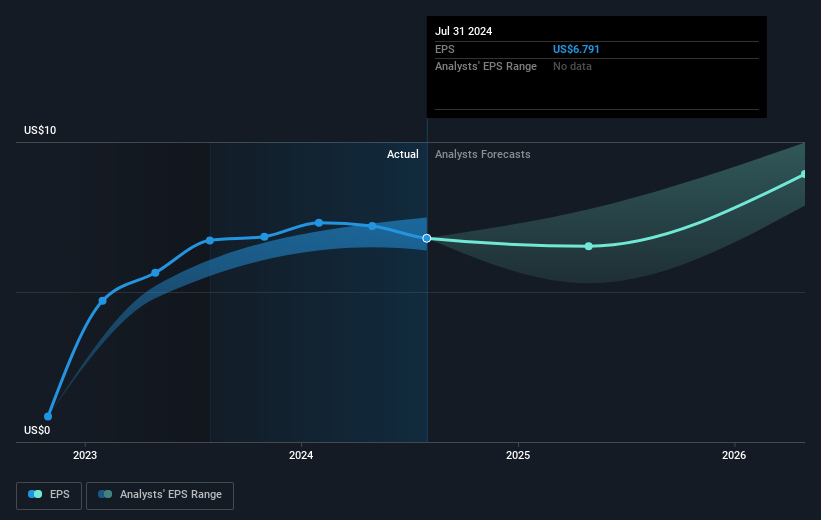
American Woodmark was able to grow its EPS at 35% per year over three years, sending the share price higher. The average annual share price increase of 17% is actually lower than the EPS growth. So one could reasonably conclude that the market has cooled on the stock.
美國伍德馬克在三年內每年能夠以35%的速度增長每股收益,推動股價上漲。平均年度股價增長爲17%,實際上低於每股收益的增長。因此,可以合理地得出結論,市場對該股票的熱情減退。
You can see how EPS has changed over time in the image below (click on the chart to see the exact values).
您可以在下面的圖片中查看每股收益如何隨時間變化(單擊圖表以查看確切的價值)。
It is of course excellent to see how American Woodmark has grown profits over the years, but the future is more important for shareholders. It might be well worthwhile taking a look at our free report on how its financial position has changed over time.
當然,看到美國伍德馬克多年來的利潤增長是極好的,但對股東來說,未來更爲重要。查看我們免費的報告,看其財務狀況是如何隨着時間變化的,可能是個不錯的選擇。
A Different Perspective
另一種看法
American Woodmark provided a TSR of 36% over the year. That's fairly close to the broader market return. The silver lining is that the share price is up in the short term, which flies in the face of the annualised loss of 0.3% over the last five years. While 'turnarounds seldom turn' there are green shoots for American Woodmark. Most investors take the time to check the data on insider transactions. You can click here to see if insiders have been buying or selling.
美國伍德馬克在過去一年提供了36%的總回報率。這與更廣泛的市場回報相當接近。令我們欣慰的是,股價在短期內上漲,這對過去五年的年化損失0.3%形成了鮮明對比。儘管「逆轉往往不會發生」,但美國伍德馬克仍有一些積極跡象。大多數投資者會花時間檢查內部交易的數據。您可以點擊這裏查看內部人士是否在買入或賣出。
We will like American Woodmark better if we see some big insider buys. While we wait, check out this free list of undervalued stocks (mostly small caps) with considerable, recent, insider buying.
如果我們看到一些大額的內部人士買入,我們會更喜歡美國伍德馬克。在我們等待的同時,可以查看這份免費的被低估的股票清單(主要是小型股),這些股票最近有相當多的內部人士買入。
Please note, the market returns quoted in this article reflect the market weighted average returns of stocks that currently trade on American exchanges.
請注意,本文所引述的市場回報反映了目前在美國交易所上市的股票的市場加權平均回報。
Have feedback on this article? Concerned about the content? Get in touch with us directly. Alternatively, email editorial-team (at) simplywallst.com.
This article by Simply Wall St is general in nature. We provide commentary based on historical data and analyst forecasts only using an unbiased methodology and our articles are not intended to be financial advice. It does not constitute a recommendation to buy or sell any stock, and does not take account of your objectives, or your financial situation. We aim to bring you long-term focused analysis driven by fundamental data. Note that our analysis may not factor in the latest price-sensitive company announcements or qualitative material. Simply Wall St has no position in any stocks mentioned.
對這篇文章有反饋嗎?對內容感到擔憂嗎?請直接與我們聯繫。或者,發送電子郵件至editorial-team @ simplywallst.com。
Simply Wall St的這篇文章是一般性質的。我們僅基於歷史數據和分析師預測提供評論,使用公正的方法,我們的文章並非意在提供財務建議。這並不構成買入或賣出任何股票的建議,並且不考慮您的目標或財務狀況。我們旨在爲您帶來基於基礎數據驅動的長期聚焦分析。請注意,我們的分析可能未考慮最新的價格敏感公司公告或定性材料。Simply Wall St對提及的任何股票都沒有持倉。
譯文內容由第三人軟體翻譯。