
Nvidia's Post-Earnings Jitters: Can NVDA Stock Regain Its AI-Fueled Momentum?
Nvidia's Post-Earnings Jitters: Can NVDA Stock Regain Its AI-Fueled Momentum?
 The Santa Clara, California-based company reported an 8% beat on earnings per share and a nearly 6% revenue beat compared to estimates. Revenue soared 93.71% year-over-year, reaching $35.1 billion, fueled by the relentless demand for AI chips.
Despite the stellar numbers in its latest earnings report, Nvidia Corp (NASDAQ:NVDA) stock slipped 3% in after-hours trading on Wednesday.
儘管其最新業績數據表現出色,但英偉達公司(納斯達克:NVDA)股價在週三盤後交易中下跌了3%。
In premarket Thursday, Nvidia shares swung between gains and losses, ultimately opening 5% higher before losing steam.
週四盤前,英偉達股票在漲跌間徘徊,最終在開盤前漲幅逾5%,隨後失去動力。
By mid-morning, Nvidia shares were down 1.23%, trading at $144.10—a move many attribute to the priced-for-perfection environment surrounding the AI giant. It seems the market's insatiable appetite for upside surprises left even Nvidia's blockbuster results struggling to impress.
到了中午,英偉達股價下跌了1.23%,交易價格爲144.10美元,許多人將這一舉動歸因於圍繞這家人工智能巨頭的價格超預期環境。市場對正面驚喜的貪得無厭似乎連英偉達的大舉成績也顯得難以令人滿意。
Nvidia Stock's Underlying Resilience
英偉達股票的潛在韌性
The Santa Clara, California-based company reported an 8% beat on earnings per share and a nearly 6% revenue beat compared to estimates. Revenue soared 93.71% year-over-year, reaching $35.1 billion, fueled by the relentless demand for AI chips.
總部位於加利福尼亞聖克拉拉的該公司報告的每股盈利超過了8%,與預估相比營收增長近6%。營業收入同比激增了93.71%,達到了351億美元,得益於對人工智能芯片的源源不斷需求。
Despite Thursday's volatile trading, Nvidia's technical indicators suggest underlying resilience.
儘管週四的交易波動較大,英偉達的技術指標顯示出潛在的韌性。
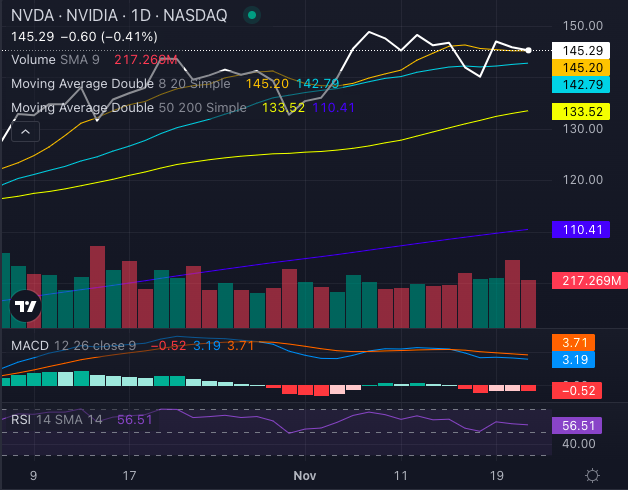
Chart created using Benzinga Pro
使用Benzinga Pro創建的圖表
The stock is trading above its eight-day, 20-day, 50-day and 200-day simple moving averages, signaling a strong bullish foundation:
股票交易價格高於其八天、20天、50天和200天的簡單移動平均線,表明有着強勁的看好基礎:
8-day SMA: Nvidia sits at $145.29, above its $145.20 SMA, generating a short-term bullish signal.
20-day SMA: The stock's $145.29 price exceeds the $142.79 average, reinforcing the bullish narrative.
50-day SMA: Nvidia's $145.29 eclipses its 50-day average of $133.52, pointing to solid momentum.
200-day SMA: At $110.41, the 200-day average remains far below current levels, reflecting long-term bullish strength.
8天SMA:英偉達坐擁145.29美元,高於其145.20美元SMA,產生短期看好信號。
20天SMA:該股票的145.29美元價格超過了142.79美元的平均水平,強化了看好的敘事。
50天SMA:英偉達的145.29美元超過了其133.52美元的50天平均水平,指向堅實的動量。
200天SMA:110.41美元的200天平均線仍遠低於當前水平,反映了長期看好的實力。
The MACD (moving average convergence/divergence) indicator also supports a bullish outlook with a reading of 3.19, while the RSI (relative strength index) at 56.51 shows the stock is comfortably neutral, leaving room for further upward movement without triggering overbought alarms.
MACD(移動平均線收斂/發散)指標也支持看好的前景,讀數爲3.19,而RSI(相對強弱指標)爲56.51,顯示股票處於舒適的中立狀態,有進一步上漲空間,並且沒有觸發超買警報。
Can Nvidia Break Free?
英偉達能突破束縛嗎?
Nvidia's fundamentals remain as robust as its AI ambitions, but the question lingers: Can the stock sustain its high-altitude trajectory amid sky-high expectations?
英偉達的基本面仍然像其人工智能雄心一樣強勁,但問題仍然存在:股票能否在 sky-high 期望的背景下持續保持高空軌跡?
Investors will be watching closely as Nvidia tries to stabilize after its earnings-induced turbulence.
投資者將密切關注英偉達在營收引發的動盪後嘗試穩定。
譯文內容由第三人軟體翻譯。
