

#GoldTechnical Analysis#24K99 News In the early European session on Friday, spot gold maintained a intraday decline and is currently trading near $2730 per ounce. FXStreet senior analyst Dhwani Mehta wrote an article analyzing the technical trend of gold price.
Spot gold closed sharply higher on Thursday, up $20.52, or 0.76%, at $2735.76 per ounce.
Mehta stated that in early Friday trading, the price of gold turned lower as sellers failed to find a strong foothold above the static resistance level of $2740 per ounce.
 Mehta pointed out that gold price needs to break through $2740 per ounce to maintain the upward trend.technical aspectsit is still a "buy on dips" trade for gold price.
Focus on key data from the USA.
Mehta said that now people's attention is shifting to a new round of U.S. economic data and speeches from Fed policymakers, in search of new momentum for the gold price. The upcoming U.S. durable goods orders and University of Michigan consumer sentiment data may provide new clues about the U.S. economic situation, which could impact the Fed's rate cut expectations and the recent value of the U.S. dollar.
At 20:30 on Friday Beijing time, the preliminary value of U.S. durable goods orders for September will be released, with a forecast of a 1.0% month-on-month decrease, unchanged from the previous value.
At 22:00 on Friday Beijing time, the final value of the University of Michigan Consumer Confidence Index for October in the USA will be released, expected to be 69.0, unchanged from the previous value of 68.9.
Regarding speeches by Fed officials, at 23:00 on Friday Beijing time, Boston Fed Chair Susan Collins will participate in a fireside chat as part of a Fed event.
Mehta pointed out that the gold price may exhibit new trends in U.S. data releases and the speech by Boston Fed Chair Susan Collins.
How to trade gold?
Mehta stated that the gold price turned downwards again, once testing...ResistanceAt $2723 per ounce, this is the 23.6% Fibonacci retracement level from the rebound trend from the low of $2604 per ounce on October 10 to the historical high of $2759 per ounce.
Mehta said that if the gold price fails to defend the above level at the close, it may accelerate its decline towards the 38.2% Fibonacci level of $2700 per ounce.
Looking further down, the 50% Fibonacci support level at $2681 per ounce will be tested, which is close to the 21-day (SMA) level. Simple Moving Average(SMA).
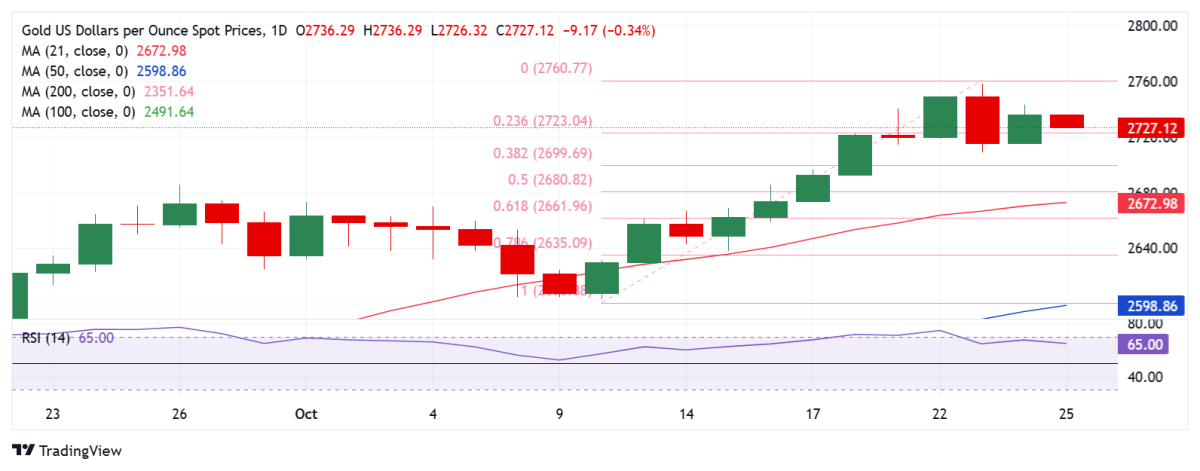
(Spot gold daily chart source: FXStreet)
On the other hand, Mehta added that breaking through the static resistance level of $2740 per ounce is crucial for the recovery of the sustained upward trend.
At that time, gold buyers will target the psychological barrier of $2750 per ounce. The record high of $2759 per ounce will be the next target of interest for buyers.
Mehta concluded by writing on the 14th day.Relative Strength IndexThe relative strength index (RSI) is trending lower, but staying above 50, currently trading around 65, indicating that any downturn in gold prices could be seen as a good buying opportunity on dips.
At 15:26 Beijing time, spot gold was trading at $2729.52 per ounce.
