
Those Who Invested in STERIS (NYSE:STE) Five Years Ago Are up 62%
Those Who Invested in STERIS (NYSE:STE) Five Years Ago Are up 62%
 Over half a decade, STERIS managed to grow its earnings per share at 8.6% a year. This EPS growth is reasonably close to the 9% average annual increase in the share price. That suggests that the market sentiment around the company hasn't changed much over that time. Indeed, it would appear the share price is reacting to the EPS.
 If you buy and hold a stock for many years, you'd hope to be making a profit. Better yet, you'd like to see the share price move up more than the market average. Unfortunately for shareholders, while the STERIS plc (NYSE:STE) share price is up 55% in the last five years, that's less than the market return. The last year hasn't been great either, with the stock up just 3.8%.
如果你買入並持有股票多年,你希望會獲利。更好的是,你希望看到股價的漲幅超過市場平均水平。不幸的是對於股東來說,雖然在過去五年中,思泰瑞醫療(NYSE:STE)的股價上漲了55%,但仍低於市場回報率。最近一年也不盡如人意,股價僅上漲了3.8%。
Now it's worth having a look at the company's fundamentals too, because that will help us determine if the long term shareholder return has matched the performance of the underlying business.
現在值得更詳細地了解該公司的基本面,因爲這將幫助我們判斷長期股東回報是否與基礎業務的表現相匹配。
There is no denying that markets are sometimes efficient, but prices do not always reflect underlying business performance. One imperfect but simple way to consider how the market perception of a company has shifted is to compare the change in the earnings per share (EPS) with the share price movement.
不可否認的是,市場有時是高效的,但價格並不總是反映潛在的商業表現。一個不完美但簡單的方法來考慮公司市場感知如何改變是比較每股收益(EPS)變化和股價變動。
Over half a decade, STERIS managed to grow its earnings per share at 8.6% a year. This EPS growth is reasonably close to the 9% average annual increase in the share price. That suggests that the market sentiment around the company hasn't changed much over that time. Indeed, it would appear the share price is reacting to the EPS.
在過去五年半的時間裏,思泰瑞醫療設法以每年8.6%的速度增加其每股收益。這種每股收益的增長與股價每年增長9%的平均水平相差不遠。這表明市場對該公司的情緒在這段時間內沒有發生太大變化。事實上,股價似乎正在對每股收益作出反應。
The image below shows how EPS has tracked over time (if you click on the image you can see greater detail).
下圖顯示了EPS隨時間的變化情況(如果您單擊該圖像,則可以查看更多詳細信息)。
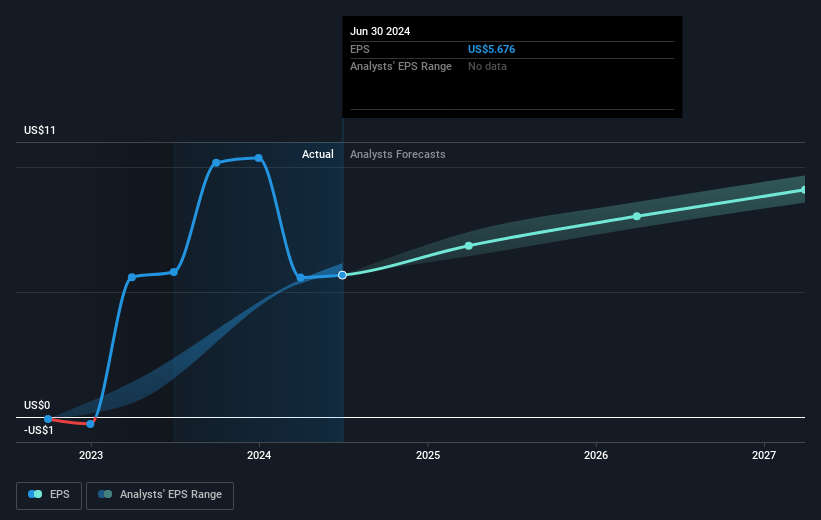
Dive deeper into STERIS' key metrics by checking this interactive graph of STERIS's earnings, revenue and cash flow.
通過查看思泰瑞醫療的盈利、營業收入和現金流的交互式圖表,更深入地了解思泰瑞醫療的關鍵指標。
What About Dividends?
那麼分紅怎麼樣呢?
It is important to consider the total shareholder return, as well as the share price return, for any given stock. The TSR incorporates the value of any spin-offs or discounted capital raisings, along with any dividends, based on the assumption that the dividends are reinvested. So for companies that pay a generous dividend, the TSR is often a lot higher than the share price return. In the case of STERIS, it has a TSR of 62% for the last 5 years. That exceeds its share price return that we previously mentioned. And there's no prize for guessing that the dividend payments largely explain the divergence!
對於任何特定股票,考慮總股東回報和股價回報是很重要的。TSR包括任何分拆或折讓的籌資價值,以及基於股利被再投資的假設。因此,對於支付豐厚股利的公司,TSR往往要比股價回報高得多。就思泰瑞醫療而言,過去5年其TSR爲62%。這超過了我們之前提到的股價回報。可以毫不費力地猜到,股利支付在很大程度上解釋了這種差異!
A Different Perspective
不同的觀點
STERIS shareholders are up 4.8% for the year (even including dividends). Unfortunately this falls short of the market return. On the bright side, the longer term returns (running at about 10% a year, over half a decade) look better. Maybe the share price is just taking a breather while the business executes on its growth strategy. If you would like to research STERIS in more detail then you might want to take a look at whether insiders have been buying or selling shares in the company.
思泰瑞醫療股東今年收益率爲4.8%(甚至包括股利在內)。不幸的是,這低於市場回報。但值得一提的是,長期回報率(在過去半個世紀的年均約爲10%)看起來更好。也許股價只是在休整,而業務執行其增長策略。如果您希望更詳細地研究思泰瑞醫療,您可能要看一下公司內部人員是在買入還是賣出股票。
If you are like me, then you will not want to miss this free list of undervalued small caps that insiders are buying.
如果您像我一樣,就不會希望錯過這份免費的內部人士正在購買的低估小市值股票列表。
Please note, the market returns quoted in this article reflect the market weighted average returns of stocks that currently trade on American exchanges.
請注意,本文所引述的市場回報反映了目前在美國交易所上市的股票的市場加權平均回報。
Have feedback on this article? Concerned about the content? Get in touch with us directly. Alternatively, email editorial-team (at) simplywallst.com.
This article by Simply Wall St is general in nature. We provide commentary based on historical data and analyst forecasts only using an unbiased methodology and our articles are not intended to be financial advice. It does not constitute a recommendation to buy or sell any stock, and does not take account of your objectives, or your financial situation. We aim to bring you long-term focused analysis driven by fundamental data. Note that our analysis may not factor in the latest price-sensitive company announcements or qualitative material. Simply Wall St has no position in any stocks mentioned.
對本文有任何反饋?對內容有任何疑慮?請直接與我們聯繫。或者,發送電子郵件至editorial-team@simplywallst.com。
這篇文章是Simply Wall St的一般性文章。我們根據歷史數據和分析師預測提供評論,只使用公正的方法論,我們的文章並不意味着提供任何金融建議。文章不構成買賣任何股票的建議,也不考慮您的目標或您的財務狀況。我們的目標是帶給您基本數據驅動的長期關注分析。請注意,我們的分析可能不考慮最新的價格敏感公司公告或定性材料。Simply Wall St沒有任何股票頭寸。
譯文內容由第三人軟體翻譯。
