
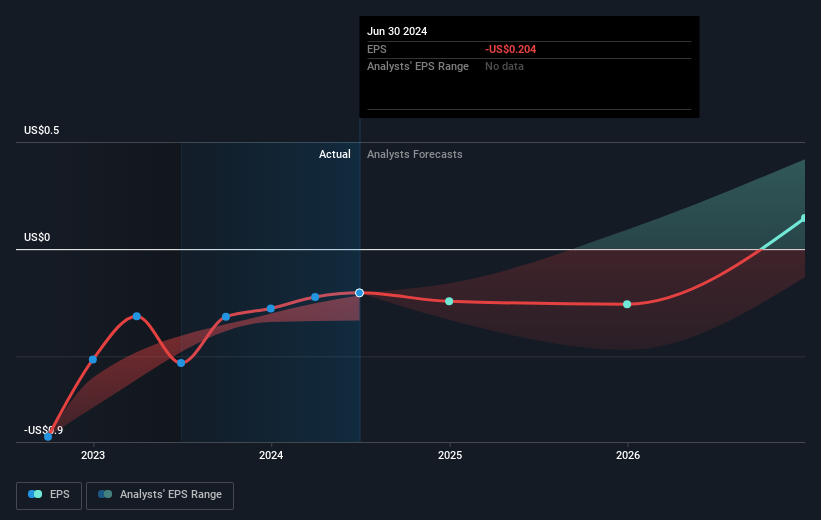
We feel now is a pretty good time to analyse Akebia Therapeutics, Inc.'s (NASDAQ:AKBA) business as it appears the company may be on the cusp of a considerable accomplishment. Akebia Therapeutics, Inc., a biopharmaceutical company, focuses on the development and commercialization of therapeutics for patients with kidney diseases. The US$288m market-cap company's loss lessened since it announced a US$52m loss in the full financial year, compared to the latest trailing-twelve-month loss of US$40m, as it approaches breakeven. Many investors are wondering about the rate at which Akebia Therapeutics will turn a profit, with the big question being "when will the company breakeven?" We've put together a brief outline of industry analyst expectations for the company, its year of breakeven and its implied growth rate.
According to the 3 industry analysts covering Akebia Therapeutics, the consensus is that breakeven is near. They expect the company to post a final loss in 2025, before turning a profit of US$34m in 2026. So, the company is predicted to breakeven approximately 2 years from today. What rate will the company have to grow year-on-year in order to breakeven on this date? Using a line of best fit, we calculated an average annual growth rate of 67%, which is rather optimistic! If this rate turns out to be too aggressive, the company may become profitable much later than analysts predict.
Underlying developments driving Akebia Therapeutics' growth isn't the focus of this broad overview, but, take into account that generally a biotech has lumpy cash flows which are contingent on the product type and stage of development the company is in. This means, large upcoming growth rates are not abnormal as the company is beginning to reap the benefits of earlier investments.
 One thing we would like to bring into light with Akebia Therapeutics is it currently has negative equity on its balance sheet. This can sometimes arise from accounting methods used to deal with accumulated losses from prior years, which are viewed as liabilities carried forward until it cancels out in the future. Oftentimes, losses exist only on paper but other times, it can be a red flag.
Next Steps:
There are key fundamentals of Akebia Therapeutics which are not covered in this article, but we must stress again that this is merely a basic overview. For a more comprehensive look at Akebia Therapeutics, take a look at Akebia Therapeutics' company page on Simply Wall St. We've also compiled a list of key factors you should look at:
- Historical Track Record: What has Akebia Therapeutics' performance been like over the past? Go into more detail in the past track record analysis and take a look at the free visual representations of our analysis for more clarity.
- Management Team: An experienced management team on the helm increases our confidence in the business – take a look at who sits on Akebia Therapeutics' board and the CEO's background.
- Other High-Performing Stocks: Are there other stocks that provide better prospects with proven track records? Explore our free list of these great stocks here.
Have feedback on this article? Concerned about the content? Get in touch with us directly. Alternatively, email editorial-team (at) simplywallst.com.
This article by Simply Wall St is general in nature. We provide commentary based on historical data and analyst forecasts only using an unbiased methodology and our articles are not intended to be financial advice. It does not constitute a recommendation to buy or sell any stock, and does not take account of your objectives, or your financial situation. We aim to bring you long-term focused analysis driven by fundamental data. Note that our analysis may not factor in the latest price-sensitive company announcements or qualitative material. Simply Wall St has no position in any stocks mentioned.
