
An Intrinsic Calculation For Vertex Pharmaceuticals Incorporated (NASDAQ:VRTX) Suggests It's 42% Undervalued
An Intrinsic Calculation For Vertex Pharmaceuticals Incorporated (NASDAQ:VRTX) Suggests It's 42% Undervalued
 A DCF is all about the idea that a dollar in the future is less valuable than a dollar today, and so the sum of these future cash flows is then discounted to today's value:
 Key Insights
主要見解
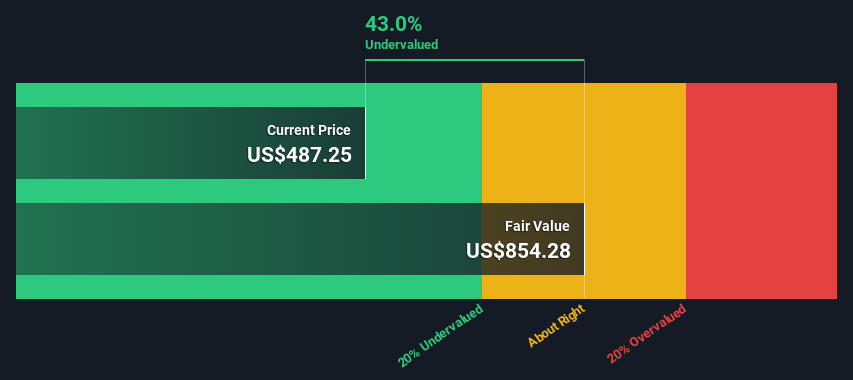
- Using the 2 Stage Free Cash Flow to Equity, Vertex Pharmaceuticals fair value estimate is US$854
- Vertex Pharmaceuticals is estimated to be 42% undervalued based on current share price of US$499
- The US$509 analyst price target for VRTX is 40% less than our estimate of fair value
- 利用2階段自由現金流到股東權益,福泰製藥的公允價值估計爲854美元
- 根據當前股價499美元,福泰製藥的估值爲42%的折價
- VRTX的509美元分析師價格目標比我們的公允價值估計低40%
In this article we are going to estimate the intrinsic value of Vertex Pharmaceuticals Incorporated (NASDAQ:VRTX) by projecting its future cash flows and then discounting them to today's value. Our analysis will employ the Discounted Cash Flow (DCF) model. Don't get put off by the jargon, the math behind it is actually quite straightforward.
本文將通過預測福泰製藥公司(納斯達克:VRTX)未來現金流並將其折現到今天的價值,來估計其內在價值。我們的分析將採用折現現金流(DCF)模型。不要被行話嚇到,其背後的數學實際上非常直接。
We generally believe that a company's value is the present value of all of the cash it will generate in the future. However, a DCF is just one valuation metric among many, and it is not without flaws. Anyone interested in learning a bit more about intrinsic value should have a read of the Simply Wall St analysis model.
我們通常認爲公司的價值是其未來所有現金流的現值。然而,DCF只是衆多估值指標之一,並不是沒有缺陷的。任何有興趣了解內在價值更多信息的人都可以閱讀Simply Wall St的分析模型。
The Model
模型
We use what is known as a 2-stage model, which simply means we have two different periods of growth rates for the company's cash flows. Generally the first stage is higher growth, and the second stage is a lower growth phase. In the first stage we need to estimate the cash flows to the business over the next ten years. Where possible we use analyst estimates, but when these aren't available we extrapolate the previous free cash flow (FCF) from the last estimate or reported value. We assume companies with shrinking free cash flow will slow their rate of shrinkage, and that companies with growing free cash flow will see their growth rate slow, over this period. We do this to reflect that growth tends to slow more in the early years than it does in later years.
我們使用所謂的2階段模型,這意味着我們有兩個不同的現金流增長期。一般來說,第一個階段是高增長,第二個階段是低增長。在第一個階段,我們需要估計未來10年業務的現金流。在可能的情況下,我們使用分析師的預測,但當這些不可用時,我們就會從上一個估計值或報告值推斷出上一個自由現金流(FCF)。我們假設自由現金流下降的公司將減緩縮小速度,而增長的自由現金流的公司在此期間增長率將放緩。我們這樣做是爲了反映增長傾向於在早期比在後期更爲緩慢。
A DCF is all about the idea that a dollar in the future is less valuable than a dollar today, and so the sum of these future cash flows is then discounted to today's value:
DCF的核心概念是未來的每一美元都比現在的每一美元更不值錢,因此我們將這些未來的現金流貼現到當今的價值:
10-year free cash flow (FCF) forecast
10年自由現金流(FCF)預測
| 2025 | 2026 | 2027 | 2028 | 2029 | 2030 | 2031 | 2032 | 2033 | 2034 | |
| Levered FCF ($, Millions) | US$5.03b | US$5.81b | US$6.46b | US$7.57b | US$8.33b | US$8.98b | US$9.54b | US$10.0b | US$10.5b | US$10.9b |
| Growth Rate Estimate Source | Analyst x5 | Analyst x5 | Analyst x4 | Analyst x4 | Est @ 10.06% | Est @ 7.79% | Est @ 6.20% | Est @ 5.09% | Est @ 4.32% | Est @ 3.77% |
| Present Value ($, Millions) Discounted @ 6.2% | US$4.7k | US$5.1k | US$5.4k | US$5.9k | US$6.2k | US$6.2k | US$6.2k | US$6.2k | US$6.1k | US$5.9k |
| 2025 | 2026 | 2027 | 2028 | 2029 | 2030 | 2031 | 2032 | 2033 | 2034 | |
| 槓桿自由現金流 ($, 百萬) | US$5.03億 | 5.81億美元 | 美元6.46億 | 75億700萬美元 | 美元8.33億 | 898億美元 | US$9.54b | 100.0億美元 | US$10.5億 | 109億美元 |
| 增長率估計來源 | 分析師 x5 | 分析師 x5 | 分析師4人 | 分析師4人 | 估計 @ 10.06% | 按7.79%計算的估計。 | 21.6美元 | 按照5.09%的估計值 | 以4.32%爲基礎估計 | 以3.77%爲估計值 |
| 現值(以百萬美元爲單位)貼現率爲6.2% | US$4.7k | 美元5.1k | 5000美元 | 美元5.9k | 6,200美元 | 6,200美元 | 6,200美元 | 6,200美元 | 美元6.1k | 美元5.9k |
("Est" = FCF growth rate estimated by Simply Wall St)
Present Value of 10-year Cash Flow (PVCF) = US$58b
("Est" = Simply Wall St 估計的自由現金流增長率)
10年現金流的現值(PVCF)=580億美元
The second stage is also known as Terminal Value, this is the business's cash flow after the first stage. The Gordon Growth formula is used to calculate Terminal Value at a future annual growth rate equal to the 5-year average of the 10-year government bond yield of 2.5%. We discount the terminal cash flows to today's value at a cost of equity of 6.2%.
第二階段也被稱爲終值,這是業務在第一階段之後的現金流。 戈登增長模型用於以未來年增長率等於10年政府債券收益率5年平均值2.5%計算終值。 我們以6.2%的權益成本將終止現金流折現至今天的價值。
Terminal Value (TV)= FCF2034 × (1 + g) ÷ (r – g) = US$11b× (1 + 2.5%) ÷ (6.2%– 2.5%) = US$297b
終值(TV)= 自由現金流2034 × (1 + 2.5%) ÷ (6.2%– 2.5%) = 美元11億× (1 + 2.5%) ÷ (6.2%– 2.5%) = 美元297億
Present Value of Terminal Value (PVTV)= TV / (1 + r)10= US$297b÷ ( 1 + 6.2%)10= US$162b
終值的現值(PVTV)= TV / (1 + 6.2%)10= 美元297億÷ ( 1 + 6.2%)10= 美元162億
The total value is the sum of cash flows for the next ten years plus the discounted terminal value, which results in the Total Equity Value, which in this case is US$220b. The last step is to then divide the equity value by the number of shares outstanding. Relative to the current share price of US$499, the company appears quite good value at a 42% discount to where the stock price trades currently. Remember though, that this is just an approximate valuation, and like any complex formula - garbage in, garbage out.
總價值是未來十年現金流量之和加上折現的終值,結果爲總股權價值,本案例中爲美元2200億。最後一步是用股權價值除以流通股份數。相對於當前股價美元499,公司似乎是相當有價值的,比股價當前水平低42%。請記住,這只是一個近似估值,就像任何複雜的公式一樣-輸入垃圾,輸出垃圾。
The Assumptions
假設
We would point out that the most important inputs to a discounted cash flow are the discount rate and of course the actual cash flows. If you don't agree with these result, have a go at the calculation yourself and play with the assumptions. The DCF also does not consider the possible cyclicality of an industry, or a company's future capital requirements, so it does not give a full picture of a company's potential performance. Given that we are looking at Vertex Pharmaceuticals as potential shareholders, the cost of equity is used as the discount rate, rather than the cost of capital (or weighted average cost of capital, WACC) which accounts for debt. In this calculation we've used 6.2%, which is based on a levered beta of 0.908. Beta is a measure of a stock's volatility, compared to the market as a whole. We get our beta from the industry average beta of globally comparable companies, with an imposed limit between 0.8 and 2.0, which is a reasonable range for a stable business.
我們要指出,貼現現金流最重要的輸入是貼現率和實際現金流量。如果您不同意這些結果,請自行計算並嘗試假設。DCF也沒有考慮行業可能存在的週期性,或公司未來的資本需求,因此它並不能全面展示公司的潛在表現。鑑於我們正在考慮福泰製藥作爲潛在股東,所以成本權益被用作貼現率,而不是資本成本(或加權平均成本資本,WACC),資本成本考慮了債務。在此計算中,我們使用了6.2%,這是基於β槓桿率0.908得出的。Beta是股票波動性的一種度量,與整個市場相比。我們的β來自於全球可比公司行業平均β,其強制限制在0.8至2.0之間,這是穩定業務的合理範圍。
Next Steps:
下一步:
Whilst important, the DCF calculation ideally won't be the sole piece of analysis you scrutinize for a company. DCF models are not the be-all and end-all of investment valuation. Instead the best use for a DCF model is to test certain assumptions and theories to see if they would lead to the company being undervalued or overvalued. For instance, if the terminal value growth rate is adjusted slightly, it can dramatically alter the overall result. Why is the intrinsic value higher than the current share price? For Vertex Pharmaceuticals, we've compiled three essential items you should further examine:
儘管重要,貼現現金流量計算理想情況下不應該是您用於公司分析的唯一指標。DCF模型並不是投資估值的全盤解決方案。相反,DCF模型的最佳用途是測試某些假設和理論,以確定它們是否會導致公司被低估還是高估。例如,如果終端價值增長率略有調整,可能會顯著改變整體結果。爲什麼內在價值高於當前股價?對於福泰製藥(Vertex Pharmaceuticals),我們編制了三項必要的內容,您應該進一步檢查:
- Financial Health: Does VRTX have a healthy balance sheet? Take a look at our free balance sheet analysis with six simple checks on key factors like leverage and risk.
- Future Earnings: How does VRTX's growth rate compare to its peers and the wider market? Dig deeper into the analyst consensus number for the upcoming years by interacting with our free analyst growth expectation chart.
- Other High Quality Alternatives: Do you like a good all-rounder? Explore our interactive list of high quality stocks to get an idea of what else is out there you may be missing!
- 財務健康:VRTX是否擁有健康的資產負債表?查看我們的免費資產負債表分析,對關鍵因素如槓桿和風險進行六項簡單檢查。
- 未來收益:VRTX的增長率如何與其同行及更廣泛的市場相比?通過與我們的免費分析師增長預期圖表進行互動,深入了解未來幾年的分析師一致預期數字。
- 其他高質量選擇:你喜歡一個好的多面手嗎?瀏覽我們的高質量股票交互列表,了解還有哪些你可能錯過的好東西!
PS. The Simply Wall St app conducts a discounted cash flow valuation for every stock on the NASDAQGS every day. If you want to find the calculation for other stocks just search here.
PS。Simply Wall St 應用程序每天針對納斯達克股票市場上的每隻股票進行現金流折現估值。如果您想找到其他股票的計算,請在此處搜索。
Have feedback on this article? Concerned about the content? Get in touch with us directly. Alternatively, email editorial-team (at) simplywallst.com.
This article by Simply Wall St is general in nature. We provide commentary based on historical data and analyst forecasts only using an unbiased methodology and our articles are not intended to be financial advice. It does not constitute a recommendation to buy or sell any stock, and does not take account of your objectives, or your financial situation. We aim to bring you long-term focused analysis driven by fundamental data. Note that our analysis may not factor in the latest price-sensitive company announcements or qualitative material. Simply Wall St has no position in any stocks mentioned.
對本文有任何反饋?對內容有任何疑慮?請直接與我們聯繫。或者,發送電子郵件至editorial-team@simplywallst.com。
這篇文章是Simply Wall St的一般性文章。我們根據歷史數據和分析師預測提供評論,只使用公正的方法論,我們的文章並不意味着提供任何金融建議。文章不構成買賣任何股票的建議,也不考慮您的目標或您的財務狀況。我們的目標是帶給您基本數據驅動的長期關注分析。請注意,我們的分析可能不考慮最新的價格敏感公司公告或定性材料。Simply Wall St沒有任何股票頭寸。
譯文內容由第三人軟體翻譯。
