
Investors in M/I Homes (NYSE:MHO) Have Seen Massive Returns of 325% Over the Past Five Years
Investors in M/I Homes (NYSE:MHO) Have Seen Massive Returns of 325% Over the Past Five Years
 During five years of share price growth, M/I Homes achieved compound earnings per share (EPS) growth of 37% per year. So the EPS growth rate is rather close to the annualized share price gain of 34% per year. This indicates that investor sentiment towards the company has not changed a great deal. Indeed, it would appear the share price is reacting to the EPS.
 We think all investors should try to buy and hold high quality multi-year winners. And we've seen some truly amazing gains over the years. Just think about the savvy investors who held M/I Homes, Inc. (NYSE:MHO) shares for the last five years, while they gained 325%. This just goes to show the value creation that some businesses can achieve. Also pleasing for shareholders was the 12% gain in the last three months.
我們認爲所有投資者都應該嘗試購買並持有高質量的多年贏家。多年來,我們看到了一些真正驚人的收益。想想那些持有 mi 家居(NYSE:MHO)股票的精明投資者,在過去五年裏,他們獲得了325%的漲幅。這正表明一些企業可以實現的價值創造。對股東而言,過去三個月的12%增長也令人滿意。
So let's investigate and see if the longer term performance of the company has been in line with the underlying business' progress.
那麼,讓我們調查一下並查看公司的長期表現是否符合基本業務的進展。
There is no denying that markets are sometimes efficient, but prices do not always reflect underlying business performance. One flawed but reasonable way to assess how sentiment around a company has changed is to compare the earnings per share (EPS) with the share price.
市場有時毫無疑問是有效的,但股票價格並不總是反映基本業務表現。一種有缺陷但合理的方法是比較每股收益(EPS)和股票價格,以評估圍繞公司的情緒如何變化。
During five years of share price growth, M/I Homes achieved compound earnings per share (EPS) growth of 37% per year. So the EPS growth rate is rather close to the annualized share price gain of 34% per year. This indicates that investor sentiment towards the company has not changed a great deal. Indeed, it would appear the share price is reacting to the EPS.
在持續五年的股價增長中,mi 家居實現了每股收益(EPS)複合增長率爲37%的年均增長。因此,EPS增長率與年化股價增長率34%相當接近。這表明投資者對該公司的情緒並沒有發生很大變化。實際上,股價似乎是在反應EPS。
The graphic below depicts how EPS has changed over time (unveil the exact values by clicking on the image).
下圖顯示了EPS隨時間變化的情況(點擊圖像以顯示確切值)。
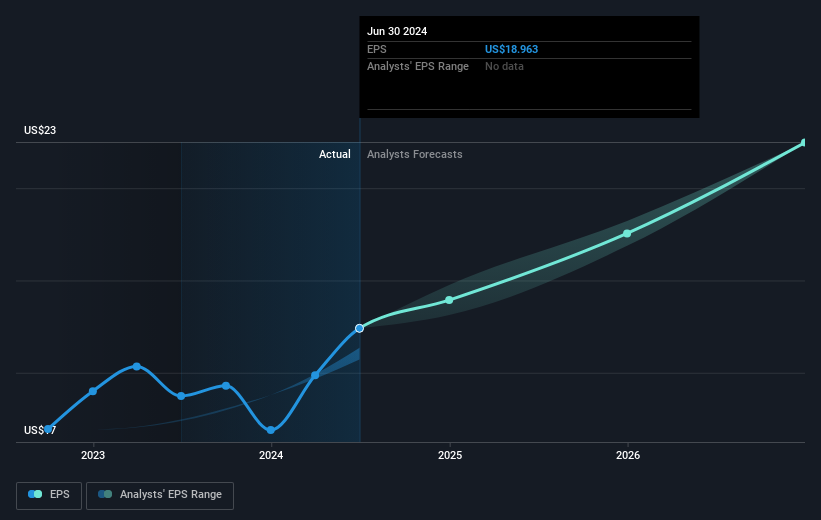
Dive deeper into M/I Homes' key metrics by checking this interactive graph of M/I Homes's earnings, revenue and cash flow.
通過查看mi 家居收入、營業收入和現金流的交互式圖表,深入了解mi 家居的關鍵指標。
A Different Perspective
不同的觀點
It's nice to see that M/I Homes shareholders have received a total shareholder return of 109% over the last year. Since the one-year TSR is better than the five-year TSR (the latter coming in at 34% per year), it would seem that the stock's performance has improved in recent times. In the best case scenario, this may hint at some real business momentum, implying that now could be a great time to delve deeper. While it is well worth considering the different impacts that market conditions can have on the share price, there are other factors that are even more important. Case in point: We've spotted 1 warning sign for M/I Homes you should be aware of.
很高興看到mi 家居股東在過去一年中獲得了總股東回報率爲109%。由於一年的TSR優於五年的TSR(後者爲每年34%),似乎股票的表現近來有所改善。在最好的情況下,這可能暗示着一些真正的業務勢頭,這意味着現在可能是深入了解的好時機。雖然值得考慮市場條件對股價的影響,但還有其他更重要的因素。舉個例子:我們發現了mi 家居的1個警告信號,您應該注意。
If you would prefer to check out another company -- one with potentially superior financials -- then do not miss this free list of companies that have proven they can grow earnings.
如果您願意查看另一家公司(具有潛在的更好財務狀況),請不要錯過這個免費的公司列表,證明它們可以增長收益。
Please note, the market returns quoted in this article reflect the market weighted average returns of stocks that currently trade on American exchanges.
請注意,本文所引述的市場回報反映了目前在美國交易所上市的股票的市場加權平均回報。
Have feedback on this article? Concerned about the content? Get in touch with us directly. Alternatively, email editorial-team (at) simplywallst.com.
This article by Simply Wall St is general in nature. We provide commentary based on historical data and analyst forecasts only using an unbiased methodology and our articles are not intended to be financial advice. It does not constitute a recommendation to buy or sell any stock, and does not take account of your objectives, or your financial situation. We aim to bring you long-term focused analysis driven by fundamental data. Note that our analysis may not factor in the latest price-sensitive company announcements or qualitative material. Simply Wall St has no position in any stocks mentioned.
對本文有任何反饋?對內容有任何疑慮?請直接與我們聯繫。或者,發送電子郵件至editorial-team@simplywallst.com。
這篇文章是Simply Wall St的一般性文章。我們根據歷史數據和分析師預測提供評論,只使用公正的方法論,我們的文章並不意味着提供任何金融建議。文章不構成買賣任何股票的建議,也不考慮您的目標或您的財務狀況。我們的目標是帶給您基本數據驅動的長期關注分析。請注意,我們的分析可能不考慮最新的價格敏感公司公告或定性材料。Simply Wall St沒有任何股票頭寸。
譯文內容由第三人軟體翻譯。
