
Despite Shrinking by US$173m in the Past Week, Star Bulk Carriers (NASDAQ:SBLK) Shareholders Are Still up 219% Over 5 Years
Despite Shrinking by US$173m in the Past Week, Star Bulk Carriers (NASDAQ:SBLK) Shareholders Are Still up 219% Over 5 Years
 During the five years of share price growth, Star Bulk Carriers moved from a loss to profitability. That would generally be considered a positive, so we'd hope to see the share price to rise. Since the company was unprofitable five years ago, but not three years ago, it's worth taking a look at the returns in the last three years, too. We can see that the Star Bulk Carriers share price is down 8.0% in the last three years. Meanwhile, EPS is up 1.2% per year. It would appear there's a real mismatch between the increasing EPS and the share price, which has declined -2.7% a year for three years.
 Star Bulk Carriers Corp. (NASDAQ:SBLK) shareholders might be concerned after seeing the share price drop 13% in the last quarter. But at least the stock is up over the last five years. Unfortunately its return of 90% is below the market return of 110%.
Star Bulk Carriers公司(納斯達克股票代碼:SBLK)的股東可能會擔心,在上個季度看到股價下跌了13%。但至少股票在過去五年裏上漲了。不幸的是,其90%的回報低於市場的110%。
Although Star Bulk Carriers has shed US$173m from its market cap this week, let's take a look at its longer term fundamental trends and see if they've driven returns.
儘管Star Bulk Carriers本週已從市值中損失了1.73億美元,讓我們來看看其更長期的基本趨勢,看看它們是否推動了回報。
While the efficient markets hypothesis continues to be taught by some, it has been proven that markets are over-reactive dynamic systems, and investors are not always rational. By comparing earnings per share (EPS) and share price changes over time, we can get a feel for how investor attitudes to a company have morphed over time.
儘管一些人繼續教授有效市場假說,但已經證明市場是過度反應的動態系統,並且投資者並不總是理性的。通過比較每股收益(EPS)和股價的變化情況,我們可以了解投資者對公司的態度如何隨着時間變化而變化。
During the five years of share price growth, Star Bulk Carriers moved from a loss to profitability. That would generally be considered a positive, so we'd hope to see the share price to rise. Since the company was unprofitable five years ago, but not three years ago, it's worth taking a look at the returns in the last three years, too. We can see that the Star Bulk Carriers share price is down 8.0% in the last three years. Meanwhile, EPS is up 1.2% per year. It would appear there's a real mismatch between the increasing EPS and the share price, which has declined -2.7% a year for three years.
在股價增長的五年中,Star Bulk Carriers從虧損轉爲盈利。這通常被認爲是一個積極的跡象,所以我們希望看到股價上漲。由於公司在五年前虧損,但在三年前沒有虧損,值得看看過去三年的回報情況。我們可以看到,Star Bulk Carriers的股價在過去三年下跌了8.0%。同時,每股收益年均增長1.2%。從逐年增長的每股收益和股價下跌中可以看出,存在真實的不匹配,導致股價在過去三年每年下跌2.7%。
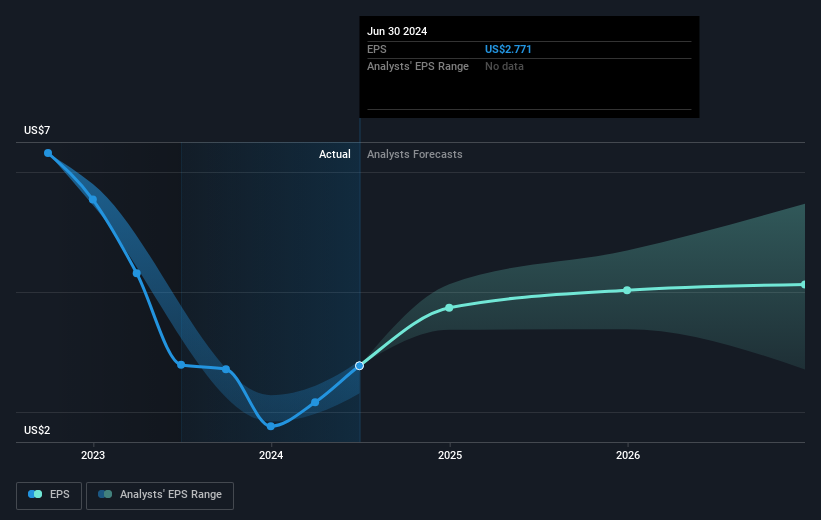
The company's earnings per share (over time) is depicted in the image below (click to see the exact numbers).
該公司的每股收益(隨時間的推移)如下圖所示(單擊可查看確切數字)。
Before buying or selling a stock, we always recommend a close examination of historic growth trends, available here.
在購買或出售股票之前,我們始終建議對歷史增長趨勢進行仔細研究,可以在這裏找到相關信息。
What About Dividends?
那麼分紅怎麼樣呢?
When looking at investment returns, it is important to consider the difference between total shareholder return (TSR) and share price return. The TSR incorporates the value of any spin-offs or discounted capital raisings, along with any dividends, based on the assumption that the dividends are reinvested. So for companies that pay a generous dividend, the TSR is often a lot higher than the share price return. In the case of Star Bulk Carriers, it has a TSR of 219% for the last 5 years. That exceeds its share price return that we previously mentioned. This is largely a result of its dividend payments!
在考慮投資回報時,重要的是要考慮股東總回報(TSR)和股價回報之間的區別。 TSR包括任何剝離或折扣的資本籌集價值,以及任何派息,基於假設派息被重新投資。 因此,對於支付豐厚股息的公司,TSR往往比股價回報高得多。 就star bulk carriers而言,過去5年的TSR爲219%。 這超過了我們之前提到的股價回報。 這在很大程度上是由其股息支付所致!
A Different Perspective
不同的觀點
Star Bulk Carriers shareholders are up 18% for the year (even including dividends). But that was short of the market average. On the bright side, the longer term returns (running at about 26% a year, over half a decade) look better. It may well be that this is a business worth popping on the watching, given the continuing positive reception, over time, from the market. While it is well worth considering the different impacts that market conditions can have on the share price, there are other factors that are even more important. Consider risks, for instance. Every company has them, and we've spotted 3 warning signs for Star Bulk Carriers you should know about.
star bulk carriers股東今年的回報率爲18%(甚至包括派息在內)。 但與市場平均水平相比稍遜色。 正面的是,長期回報率(在過去的半個十年內每年約爲26%)看起來更好。 考慮到市場長期積極的反應,這可能是一個值得留意的業務。 儘管考慮市場狀況對股價的影響很值得,但還有其他更重要的因素。 考慮風險,例如。 每家公司都面臨風險,我們已經發現star bulk carriers存在3個警告信號,您應該知道。
But note: Star Bulk Carriers may not be the best stock to buy. So take a peek at this free list of interesting companies with past earnings growth (and further growth forecast).
但請注意:star bulk carriers 可能不是最佳的股票買入選擇。所以瀏覽一下這份免費的有着過去盈利增長(以及未來增長預測)的有趣公司名單。
Please note, the market returns quoted in this article reflect the market weighted average returns of stocks that currently trade on American exchanges.
請注意,本文所引述的市場回報反映了目前在美國交易所上市的股票的市場加權平均回報。
Have feedback on this article? Concerned about the content? Get in touch with us directly. Alternatively, email editorial-team (at) simplywallst.com.
This article by Simply Wall St is general in nature. We provide commentary based on historical data and analyst forecasts only using an unbiased methodology and our articles are not intended to be financial advice. It does not constitute a recommendation to buy or sell any stock, and does not take account of your objectives, or your financial situation. We aim to bring you long-term focused analysis driven by fundamental data. Note that our analysis may not factor in the latest price-sensitive company announcements or qualitative material. Simply Wall St has no position in any stocks mentioned.
對本文有任何反饋?對內容有任何疑慮?請直接與我們聯繫。或者,發送電子郵件至editorial-team@simplywallst.com。
這篇文章是Simply Wall St的一般性文章。我們根據歷史數據和分析師預測提供評論,只使用公正的方法論,我們的文章並不意味着提供任何金融建議。文章不構成買賣任何股票的建議,也不考慮您的目標或您的財務狀況。我們的目標是帶給您基本數據驅動的長期關注分析。請注意,我們的分析可能不考慮最新的價格敏感公司公告或定性材料。Simply Wall St沒有任何股票頭寸。
譯文內容由第三人軟體翻譯。
