
At US$127, Is Chart Industries, Inc. (NYSE:GTLS) Worth Looking At Closely?
At US$127, Is Chart Industries, Inc. (NYSE:GTLS) Worth Looking At Closely?

While Chart Industries, Inc. (NYSE:GTLS) might not have the largest market cap around , it saw a double-digit share price rise of over 10% in the past couple of months on the NYSE. Shareholders may appreciate the recent price jump, but the company still has a way to go before reaching its yearly highs again. With many analysts covering the mid-cap stock, we may expect any price-sensitive announcements have already been factored into the stock's share price. However, what if the stock is still a bargain? Today we will analyse the most recent data on Chart Industries's outlook and valuation to see if the opportunity still exists.
雖然查特工業股份有限公司(紐交所:GTLS)的市值可能不是最高的,但在過去幾個月裏,在紐交所股價上漲了超過10%。 股東可能會欣賞最近的價格上漲,但在達到年度高點之前,公司仍有一段路要走。 由於許多分析師關注這隻中等市值股票,我們可能會預計任何價格敏感的公告已經被計入股價。 但是,如果股價仍然很便宜呢? 今天我們將分析查特工業股份的最新數據,以確定機會是否仍然存在。
What Is Chart Industries Worth?
查特工業值多少錢?
According to our price multiple model, where we compare the company's price-to-earnings ratio to the industry average, the stock currently looks expensive. In this instance, we've used the price-to-earnings (PE) ratio given that there is not enough information to reliably forecast the stock's cash flows. We find that Chart Industries's ratio of 52.31x is above its peer average of 21.55x, which suggests the stock is trading at a higher price compared to the Machinery industry. But, is there another opportunity to buy low in the future? Since Chart Industries's share price is quite volatile, this could mean it can sink lower (or rise even further) in the future, giving us another chance to invest. This is based on its high beta, which is a good indicator for how much the stock moves relative to the rest of the market.
根據我們的價格倍數模型,我們將公司的市盈率與行業平均值進行比較,發現目前這隻股票看起來很昂貴。 在這種情況下,我們使用了市盈率(PE)比率,因爲沒有足夠的信息可靠地預測股票的現金流。 我們發現查特工業的比率爲52.31倍,高於同行業平均值21.55倍,這表明該股票的交易價格高於機械行業。 但是,是否有未來另一個低買入機會呢? 由於查特工業的股價波動較大,這意味着未來可能會再次下跌(或者進一步上漲),爲我們提供另一次投資機會。 這是基於它的高beta值,這是一項衡量該股票相對於市場其餘部分移動程度的良好指標。
What does the future of Chart Industries look like?
查特工業的未來如何?
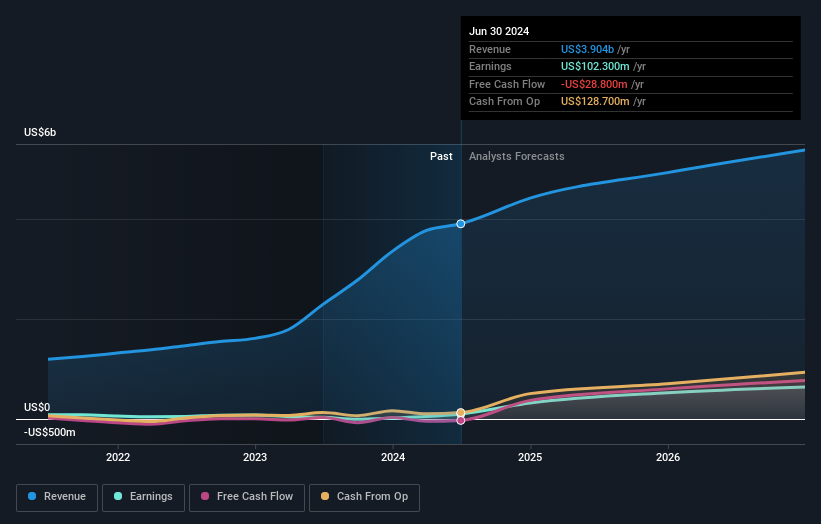
Future outlook is an important aspect when you're looking at buying a stock, especially if you are an investor looking for growth in your portfolio. Buying a great company with a robust outlook at a cheap price is always a good investment, so let's also take a look at the company's future expectations. Chart Industries' earnings over the next few years are expected to double, indicating a very optimistic future ahead. This should lead to stronger cash flows, feeding into a higher share value.
未來展望是您考慮購買股票時的一個重要方面,尤其是如果您是一位尋求投資組合增長的投資者。 以低價格購買一家前景看好的優秀公司始終是一個不錯的投資,因此我們還要看一下該公司未來的預期。 查特工業未來幾年的盈利預計將翻倍,表明未來前景非常樂觀。 這應該導致更強大的現金流,爲更高的股價價值提供支持。
What This Means For You
這對您意味着什麼?
Are you a shareholder? It seems like the market has well and truly priced in GTLS's positive outlook, with shares trading above industry price multiples. At this current price, shareholders may be asking a different question – should I sell? If you believe GTLS should trade below its current price, selling high and buying it back up again when its price falls towards the industry PE ratio can be profitable. But before you make this decision, take a look at whether its fundamentals have changed.
您是股東嗎?看起來市場已經充分反映了GTLS的積極前景,股票交易價格高於行業價格倍數。在當前價格下,股東們可能會問一個不同的問題 —— 我應該賣出嗎?如果您認爲GTLS的交易價格應該低於當前價格,高價賣出再在其價格下跌至行業市盈率時再買入可能會帶來利潤。但在做出這個決定之前,請看看其基本面是否發生了變化。
Are you a potential investor? If you've been keeping an eye on GTLS for a while, now may not be the best time to enter into the stock. The price has surpassed its industry peers, which means it is likely that there is no more upside from mispricing. However, the positive outlook is encouraging for GTLS, which means it's worth diving deeper into other factors in order to take advantage of the next price drop.
您是潛在投資者嗎?如果您一直在關注GTLS一段時間,現在可能不是進入該股票的最佳時機。價格已超過同行業同行,這意味着可能沒有更多的錯價上漲空間。然而,積極的前景對GTLS是鼓舞人心的,這意味着值得深入挖掘其他因素,以利用下一次價格下降。
So while earnings quality is important, it's equally important to consider the risks facing Chart Industries at this point in time. For instance, we've identified 2 warning signs for Chart Industries (1 is a bit concerning) you should be familiar with.
因此,儘管盈利質量很重要,但同樣重要的是考慮目前Chart Industries面臨的風險。例如,我們已經確定了Chart Industries的兩個警示信號(其中一個有點令人擔憂),您應該熟悉。
If you are no longer interested in Chart Industries, you can use our free platform to see our list of over 50 other stocks with a high growth potential.
如果您對Chart Industries不再感興趣,您可以使用我們的免費平台查看我們超過50種其他股票列表,這些股票具有高增長潛力。
Have feedback on this article? Concerned about the content? Get in touch with us directly. Alternatively, email editorial-team (at) simplywallst.com.
This article by Simply Wall St is general in nature. We provide commentary based on historical data and analyst forecasts only using an unbiased methodology and our articles are not intended to be financial advice. It does not constitute a recommendation to buy or sell any stock, and does not take account of your objectives, or your financial situation. We aim to bring you long-term focused analysis driven by fundamental data. Note that our analysis may not factor in the latest price-sensitive company announcements or qualitative material. Simply Wall St has no position in any stocks mentioned.
對本文有任何反饋?對內容有任何疑慮?請直接與我們聯繫。或者,發送電子郵件至editorial-team@simplywallst.com。
這篇文章是Simply Wall St的一般性文章。我們根據歷史數據和分析師預測提供評論,只使用公正的方法論,我們的文章並不意味着提供任何金融建議。文章不構成買賣任何股票的建議,也不考慮您的目標或您的財務狀況。我們的目標是帶給您基本數據驅動的長期關注分析。請注意,我們的分析可能不考慮最新的價格敏感公司公告或定性材料。Simply Wall St沒有任何股票頭寸。
譯文內容由第三人軟體翻譯。
