
Is APA (NASDAQ:APA) A Risky Investment?
Is APA (NASDAQ:APA) A Risky Investment?
 Zooming in on the latest balance sheet data, we can see that APA had liabilities of US$2.89b due within 12 months and liabilities of US$10.8b due beyond that. On the other hand, it had cash of US$160.0m and US$1.94b worth of receivables due within a year. So its liabilities total US$11.6b more than the combination of its cash and short-term receivables.
 Warren Buffett famously said, 'Volatility is far from synonymous with risk.' So it might be obvious that you need to consider debt, when you think about how risky any given stock is, because too much debt can sink a company. As with many other companies APA Corporation (NASDAQ:APA) makes use of debt. But the more important question is: how much risk is that debt creating?
巴菲特曾經說過:「波動性與風險遠非同義詞。」所以當您考慮任何一支股票有多有風險時,可能很明顯您需要考慮債務,因爲過多的債務可能會拖垮一家公司。正如許多其他公司一樣,APA Corporation (納斯達克:APA) 使用了債務。但更重要的問題是:這些債務到底帶來了多少風險?
Why Does Debt Bring Risk?
爲什麼債務會帶來風險?
Debt and other liabilities become risky for a business when it cannot easily fulfill those obligations, either with free cash flow or by raising capital at an attractive price. Ultimately, if the company can't fulfill its legal obligations to repay debt, shareholders could walk away with nothing. While that is not too common, we often do see indebted companies permanently diluting shareholders because lenders force them to raise capital at a distressed price. Of course, debt can be an important tool in businesses, particularly capital heavy businesses. When we examine debt levels, we first consider both cash and debt levels, together.
當企業無法輕鬆履行債務義務時,債務和其他負債就會成爲風險,無論是通過自由現金流還是以有吸引力的價格籌集資金都無法解決。最終,如果公司無法履行償還債務的法定義務,股東可能一無所獲。雖然這種情況不太常見,但我們經常看到負債的公司因爲債權人強迫其以被壓力價格籌集資金而導致股東永久性稀釋。當然,債務在企業中可以是一個重要的工具,尤其是在資本密集型企業。當我們審查債務水平時,首先考慮的是現金和債務水平。
What Is APA's Debt?
APA的債務是多少?
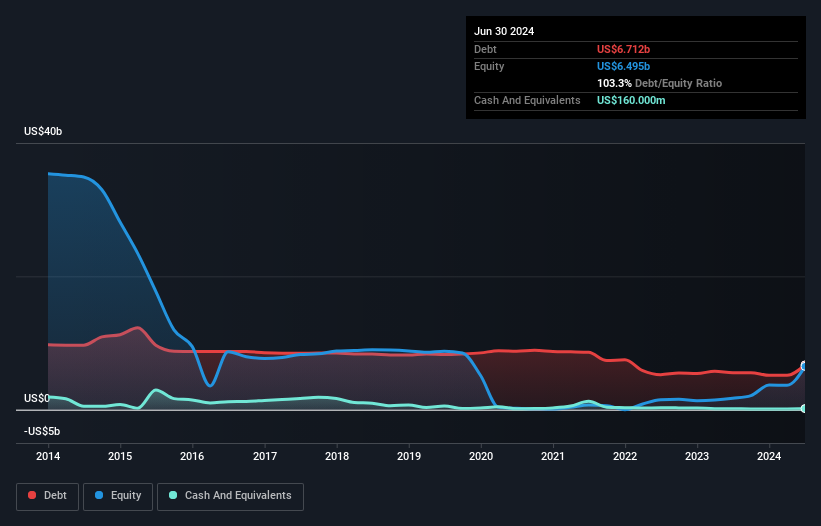
As you can see below, at the end of June 2024, APA had US$6.71b of debt, up from US$5.54b a year ago. Click the image for more detail. However, because it has a cash reserve of US$160.0m, its net debt is less, at about US$6.55b.
正如您在以下所見,截至2024年6月底,APA的債務爲67.1億美元,較去年的55.4億美元有所增加。點擊圖片查看更多詳細信息。不過,由於其擁有1.6億美元的現金儲備,其淨債務爲約65.5億美元。
A Look At APA's Liabilities
審視APA的負債情況
Zooming in on the latest balance sheet data, we can see that APA had liabilities of US$2.89b due within 12 months and liabilities of US$10.8b due beyond that. On the other hand, it had cash of US$160.0m and US$1.94b worth of receivables due within a year. So its liabilities total US$11.6b more than the combination of its cash and short-term receivables.
深入研究最新的資產負債表數據,我們可以看到APA有89億美元的負債到期日在12個月內,以及超過108億美元的負債到期超過12個月。另一方面,它擁有1.6億美元的現金和19.4億美元的一年內應收賬款。因此,其負債總額比其現金和短期應收賬款的總和多出116億美元。
Given this deficit is actually higher than the company's market capitalization of US$9.94b, we think shareholders really should watch APA's debt levels, like a parent watching their child ride a bike for the first time. Hypothetically, extremely heavy dilution would be required if the company were forced to pay down its liabilities by raising capital at the current share price.
考慮到這個赤字實際上比公司99.4億美元的市值還高,我們認爲股東們確實應該像父母看着自己的孩子第一次騎自行車一樣關注APA的債務水平。從假設角度來看,如果公司被迫以當前股價籌集資本償付其負債,那麼可能需要進行極度大規模的稀釋。
We use two main ratios to inform us about debt levels relative to earnings. The first is net debt divided by earnings before interest, tax, depreciation, and amortization (EBITDA), while the second is how many times its earnings before interest and tax (EBIT) covers its interest expense (or its interest cover, for short). Thus we consider debt relative to earnings both with and without depreciation and amortization expenses.
我們使用兩個主要的比率來告訴我們相對於收益的債務水平。第一個是淨債務除以利息、稅、折舊和攤銷前利潤(EBITDA),而第二個是其利潤前利息和稅(EBIT)覆蓋其利息費用的次數(或其利息覆蓋率,簡稱)。因此,我們考慮與折舊和攤銷費用相關的盈利以及沒有相關費用的盈利相對於債務水平。
APA has a low net debt to EBITDA ratio of only 1.2. And its EBIT covers its interest expense a whopping 10.2 times over. So you could argue it is no more threatened by its debt than an elephant is by a mouse. But the bad news is that APA has seen its EBIT plunge 15% in the last twelve months. If that rate of decline in earnings continues, the company could find itself in a tight spot. The balance sheet is clearly the area to focus on when you are analysing debt. But ultimately the future profitability of the business will decide if APA can strengthen its balance sheet over time. So if you want to see what the professionals think, you might find this free report on analyst profit forecasts to be interesting.
APA的淨債務與EBITDA比率僅爲1.2。其EBIT覆蓋利息費用高達10.2倍。因此,可以說它對債務的威脅不比大象對老鼠的威脅更大。但壞消息是,APA過去12個月中的EBIT下降了15%。如果盈利下降率持續下去,公司可能會發現自己處於困境。資產負債表顯然是你分析債務時需要關注的重點。但最終業務的未來盈利能力將決定APA是否能夠隨着時間加強其資產負債表。因此,如果你想看看專業人士的看法,也許會對分析師盈利預測的免費報告感興趣。
But our final consideration is also important, because a company cannot pay debt with paper profits; it needs cold hard cash. So the logical step is to look at the proportion of that EBIT that is matched by actual free cash flow. Looking at the most recent three years, APA recorded free cash flow of 44% of its EBIT, which is weaker than we'd expect. That weak cash conversion makes it more difficult to handle indebtedness.
但我們的最終考慮也很重要,因爲公司無法用紙面利潤支付債務;它需要現金。因此,邏輯的步驟是查看EBIT中實際自由現金流所佔比例。查看最近三年,APA記錄的自由現金流佔其EBIT的44%,比我們預期的要弱。這種弱勢的現金轉化使其更難處理負債。
Our View
我們的觀點
To be frank both APA's level of total liabilities and its track record of (not) growing its EBIT make us rather uncomfortable with its debt levels. But at least it's pretty decent at covering its interest expense with its EBIT; that's encouraging. Looking at the bigger picture, it seems clear to us that APA's use of debt is creating risks for the company. If all goes well, that should boost returns, but on the flip side, the risk of permanent capital loss is elevated by the debt. The balance sheet is clearly the area to focus on when you are analysing debt. However, not all investment risk resides within the balance sheet - far from it. For instance, we've identified 4 warning signs for APA (2 shouldn't be ignored) you should be aware of.
坦率地說,APA的總負債水平及其EBIT增長方面的記錄讓我們對其債務水平感到不安。但至少它在利息支出方面表現相當不錯,用EBIT覆蓋得不錯;這是令人鼓舞的。從更大的角度來看,我們認爲APA使用債務正在爲公司製造風險。如果一切順利,這應該會提高回報,但反過來,債務增加了永久資本損失的風險。在分析債務時,平衡表顯然是需要關注的領域。但並非所有投資風險都在資產負債表中,遠非如此。舉例來說,我們已經發現APA存在4個警示信號(有2個是不容忽視的),你應該注意。
If, after all that, you're more interested in a fast growing company with a rock-solid balance sheet, then check out our list of net cash growth stocks without delay.
如果在所有這些之後,您更感興趣的是具有堅實資產負債表的快速增長公司,那麼不要拖延,查看我們的淨現金增長股票列表。
Have feedback on this article? Concerned about the content? Get in touch with us directly. Alternatively, email editorial-team (at) simplywallst.com.
This article by Simply Wall St is general in nature. We provide commentary based on historical data and analyst forecasts only using an unbiased methodology and our articles are not intended to be financial advice. It does not constitute a recommendation to buy or sell any stock, and does not take account of your objectives, or your financial situation. We aim to bring you long-term focused analysis driven by fundamental data. Note that our analysis may not factor in the latest price-sensitive company announcements or qualitative material. Simply Wall St has no position in any stocks mentioned.
對本文有任何反饋?對內容有任何疑慮?請直接與我們聯繫。或者,發送電子郵件至editorial-team@simplywallst.com。
這篇文章是Simply Wall St的一般性文章。我們根據歷史數據和分析師預測提供評論,只使用公正的方法論,我們的文章並不意味着提供任何金融建議。文章不構成買賣任何股票的建議,也不考慮您的目標或您的財務狀況。我們的目標是帶給您基本數據驅動的長期關注分析。請注意,我們的分析可能不考慮最新的價格敏感公司公告或定性材料。Simply Wall St沒有任何股票頭寸。
譯文內容由第三人軟體翻譯。
