
Despite Shrinking by S$298m in the Past Week, SATS (SGX:S58) Shareholders Are Still up 41% Over 1 Year
Despite Shrinking by S$298m in the Past Week, SATS (SGX:S58) Shareholders Are Still up 41% Over 1 Year
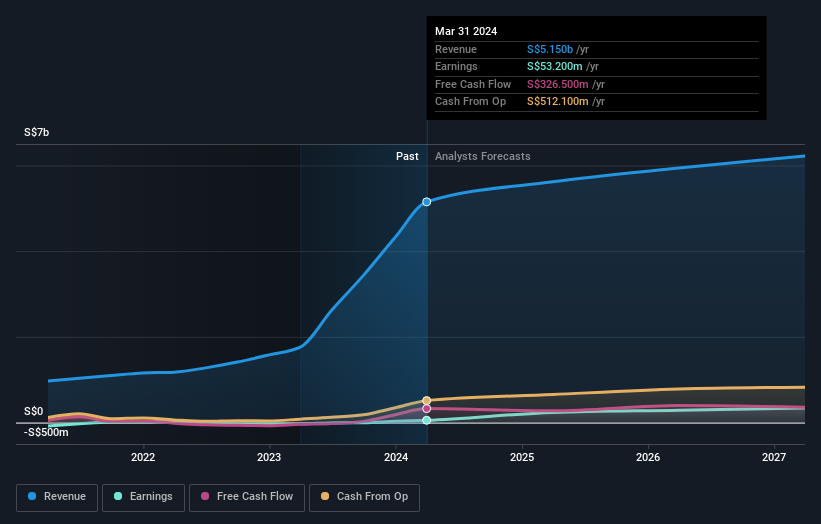
 Over the last twelve months, SATS' revenue grew by 193%. That's well above most other pre-profit companies. While the share price gain of 40% over twelve months is pretty tasty, you might argue it doesn't fully reflect the strong revenue growth. If that's the case, now might be the time to take a close look at SATS. Human beings have trouble conceptualizing (and valuing) exponential growth. Is that what we're seeing here?
 Passive investing in index funds can generate returns that roughly match the overall market. But investors can boost returns by picking market-beating companies to own shares in. To wit, the SATS Ltd. (SGX:S58) share price is 40% higher than it was a year ago, much better than the market return of around 8.8% (not including dividends) in the same period. That's a solid performance by our standards! Unfortunately the longer term returns are not so good, with the stock falling 17% in the last three years.
指數基金 pass 投資可獲得的回報差不多與整體市場一致。但投資者可以通過挑選表現優良的公司持有股份來提高回報率。譬如說,新翔集團有限公司(新加坡交易所:S58)的股價比一年前高出40%,遠遠優於同期大約8.8%的市場回報(不包括分紅)。按我們的標準來看,這是表現相當不錯的!不幸的是,長期回報並不那麼出色,過去三年股價下跌了17%。
While this past week has detracted from the company's one-year return, let's look at the recent trends of the underlying business and see if the gains have been in alignment.
雖然過去一週拖累了公司的一年回報,但讓我們看一下基礎業務的最近趨勢,以查看是否取得了進展。
We don't think that SATS' modest trailing twelve month profit has the market's full attention at the moment. We think revenue is probably a better guide. As a general rule, we think this kind of company is more comparable to loss-making stocks, since the actual profit is so low. It would be hard to believe in a more profitable future without growing revenues.
我們認爲新翔集團目前的過去十二個月的適度利潤並沒有引起市場的充分關注。我們覺得營業收入可能是更好的參考指標。一般來說,我們認爲這種公司更類似於虧損股票,因爲實際利潤如此之低。未來沒有增長的營業收入,很難相信會有更多利潤。
Over the last twelve months, SATS' revenue grew by 193%. That's well above most other pre-profit companies. While the share price gain of 40% over twelve months is pretty tasty, you might argue it doesn't fully reflect the strong revenue growth. If that's the case, now might be the time to take a close look at SATS. Human beings have trouble conceptualizing (and valuing) exponential growth. Is that what we're seeing here?
在過去十二個月裏,新翔集團的營業收入增長了193%。遠高於多數其他尚未實現盈利的公司。雖然過去十二個月股價上漲了40%,看起來相當不錯,但你可能會認爲這並沒有完全反映出強勁的營業收入增長。如果是這種情況,現在或許是仔細研究新翔集團的時候了。人類很難概念(和評估)指數增長。這是我們在這裏看到的情況嗎?
The company's revenue and earnings (over time) are depicted in the image below (click to see the exact numbers).
以下圖像顯示了公司的營業收入和盈利(隨時間變化)(單擊以查看準確的數字)。
We know that SATS has improved its bottom line over the last three years, but what does the future have in store? If you are thinking of buying or selling SATS stock, you should check out this FREE detailed report on its balance sheet.
我們知道新翔集團在過去三年裏改善了底線,但未來將會怎樣呢?如果你正在考慮購買或出售新翔集團的股票,你應該查看一下關於其資產負債表的免費詳細報告。
A Different Perspective
不同的觀點
It's nice to see that SATS shareholders have received a total shareholder return of 41% over the last year. And that does include the dividend. Notably the five-year annualised TSR loss of 4% per year compares very unfavourably with the recent share price performance. We generally put more weight on the long term performance over the short term, but the recent improvement could hint at a (positive) inflection point within the business. I find it very interesting to look at share price over the long term as a proxy for business performance. But to truly gain insight, we need to consider other information, too. Case in point: We've spotted 1 warning sign for SATS you should be aware of.
看到新翔集團股東在過去一年裏獲得了總股東回報率爲41%是件好事。這個數字包括了分紅派息。值得注意的是,過去五年的年化總股東回報率每年下跌4%,與最近的股價表現形成了非常不利比較。我們通常更重視長期績效而非短期績效,但最近的改善可能暗示着業務內的(積極)拐點。我發現長期來看股價作爲業務表現的一種替代很有趣。但要真正獲得洞察,我們也需要考慮其他信息。一個例子就是:我們發現了一項針對新翔集團的1個警示,你應該注意。
But note: SATS may not be the best stock to buy. So take a peek at this free list of interesting companies with past earnings growth (and further growth forecast).
但注意:新翔集團可能不是最佳股票選擇。所以看看這個免費的有過去盈利增長(以及未來增長預測)的有趣公司名單。
Please note, the market returns quoted in this article reflect the market weighted average returns of stocks that currently trade on Singaporean exchanges.
請注意,本文中引用的市場回報反映了當前在新加坡交易所上市股票的市場加權平均回報。
Have feedback on this article? Concerned about the content? Get in touch with us directly. Alternatively, email editorial-team (at) simplywallst.com.
This article by Simply Wall St is general in nature. We provide commentary based on historical data and analyst forecasts only using an unbiased methodology and our articles are not intended to be financial advice. It does not constitute a recommendation to buy or sell any stock, and does not take account of your objectives, or your financial situation. We aim to bring you long-term focused analysis driven by fundamental data. Note that our analysis may not factor in the latest price-sensitive company announcements or qualitative material. Simply Wall St has no position in any stocks mentioned.
對本文有任何反饋?對內容有任何疑慮?請直接與我們聯繫。或者,發送電子郵件至editorial-team@simplywallst.com。
這篇文章是Simply Wall St的一般性文章。我們根據歷史數據和分析師預測提供評論,只使用公正的方法論,我們的文章並不意味着提供任何金融建議。文章不構成買賣任何股票的建議,也不考慮您的目標或您的財務狀況。我們的目標是帶給您基本數據驅動的長期關注分析。請注意,我們的分析可能不考慮最新的價格敏感公司公告或定性材料。Simply Wall St沒有任何股票頭寸。
譯文內容由第三人軟體翻譯。
