
Investing in PROG Holdings (NYSE:PRG) a Year Ago Would Have Delivered You a 54% Gain
Investing in PROG Holdings (NYSE:PRG) a Year Ago Would Have Delivered You a 54% Gain
 During the last year, PROG Holdings actually saw its earnings per share drop 13%.
 These days it's easy to simply buy an index fund, and your returns should (roughly) match the market. But investors can boost returns by picking market-beating companies to own shares in. To wit, the PROG Holdings, Inc. (NYSE:PRG) share price is 53% higher than it was a year ago, much better than the market return of around 31% (not including dividends) in the same period. So that should have shareholders smiling. The longer term returns have not been as good, with the stock price only 11% higher than it was three years ago.
最近購買指數基金變得很容易,您的回報應該(粗略地)與市場相匹配。但投資者可以通過選擇可以戰勝市場的公司來提高回報率。舉例來說,PROG Holdings, Inc.(紐約證券交易所:PRG)的股價比一年前高出53%,比同期市場回報約31%(不包括分紅派息)要好得多。因此,這應該讓股東們笑逐顏開。長期回報則沒有那麼好,股價只比三年前高出11%。
Now it's worth having a look at the company's fundamentals too, because that will help us determine if the long term shareholder return has matched the performance of the underlying business.
現在值得更詳細地了解該公司的基本面,因爲這將幫助我們判斷長期股東回報是否與基礎業務的表現相匹配。
There is no denying that markets are sometimes efficient, but prices do not always reflect underlying business performance. One way to examine how market sentiment has changed over time is to look at the interaction between a company's share price and its earnings per share (EPS).
市場有時無疑是高效的,但價格並不總是反映基礎業務表現。 一種檢查市場情緒如何隨時間改變的方法是查看公司的股價與每股收益(EPS)之間的互動。
During the last year, PROG Holdings actually saw its earnings per share drop 13%.
在過去一年中,PROG Holdings實際上看到其每股收益下降了13%。
Given the share price gain, we doubt the market is measuring progress with EPS. Therefore, it seems likely that investors are putting more weight on metrics other than EPS, at the moment.
考慮到股價上漲,我們懷疑市場不是通過每股收益來衡量進展。因此,看起來投資者目前更加註重EPS以外的指標。
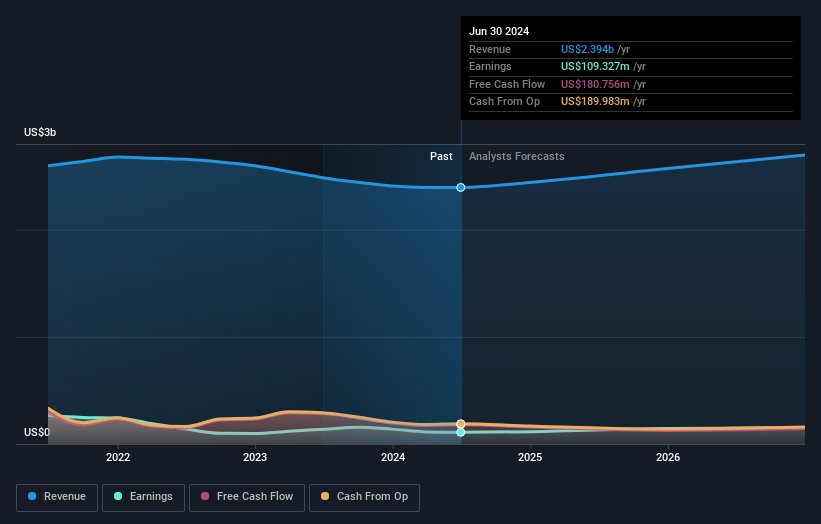
We doubt the modest 1.0% dividend yield is doing much to support the share price. PROG Holdings' revenue actually dropped 3.7% over last year. So the fundamental metrics don't provide an obvious explanation for the share price gain.
我們懷疑1.0%的股息率對支撐股價起到了很小的作用。PROG Holdings的營業收入實際上比去年下降了3.7%。因此,基本指標並沒有明顯解釋股價上漲的原因。
The graphic below depicts how earnings and revenue have changed over time (unveil the exact values by clicking on the image).
下面的圖表顯示了收益和營收隨時間的變化情況(通過單擊圖像揭示確切的值)。
Balance sheet strength is crucial. It might be well worthwhile taking a look at our free report on how its financial position has changed over time.
資產負債表強度至關重要。查看我們關於其財務狀況如何隨時間變化的免費報告可能很值得一看。
A Different Perspective
不同的觀點
It's good to see that PROG Holdings has rewarded shareholders with a total shareholder return of 54% in the last twelve months. That's including the dividend. Notably the five-year annualised TSR loss of 4% per year compares very unfavourably with the recent share price performance. We generally put more weight on the long term performance over the short term, but the recent improvement could hint at a (positive) inflection point within the business. It's always interesting to track share price performance over the longer term. But to understand PROG Holdings better, we need to consider many other factors. For example, we've discovered 2 warning signs for PROG Holdings that you should be aware of before investing here.
很高興看到PROG Holdings在過去十二個月裏用總股東回報率爲股東帶來了54%的回報,包括分紅在內。值得注意的是,每年五年的年化總股東回報率虧損4%,與最近的股價表現相比非常不利。我們通常更加看重長期表現而非短期表現,但最近的改善可能暗示了業務中的(積極)轉折點。跟蹤股價長期表現總是很有趣。但要更好地了解PROG Holdings,我們需要考慮許多其他因素。例如,我們發現了2個PROG Holdings的警告信號,您在這裏投資之前應該注意。
If you are like me, then you will not want to miss this free list of undervalued small caps that insiders are buying.
如果您像我一樣,就不會希望錯過這份免費的內部人士正在購買的低估小市值股票列表。
Please note, the market returns quoted in this article reflect the market weighted average returns of stocks that currently trade on American exchanges.
請注意,本文所引述的市場回報反映了目前在美國交易所上市的股票的市場加權平均回報。
Have feedback on this article? Concerned about the content? Get in touch with us directly. Alternatively, email editorial-team (at) simplywallst.com.
This article by Simply Wall St is general in nature. We provide commentary based on historical data and analyst forecasts only using an unbiased methodology and our articles are not intended to be financial advice. It does not constitute a recommendation to buy or sell any stock, and does not take account of your objectives, or your financial situation. We aim to bring you long-term focused analysis driven by fundamental data. Note that our analysis may not factor in the latest price-sensitive company announcements or qualitative material. Simply Wall St has no position in any stocks mentioned.
對本文有任何反饋?對內容有任何疑慮?請直接與我們聯繫。或者,發送電子郵件至editorial-team@simplywallst.com。
這篇文章是Simply Wall St的一般性文章。我們根據歷史數據和分析師預測提供評論,只使用公正的方法論,我們的文章並不意味着提供任何金融建議。文章不構成買賣任何股票的建議,也不考慮您的目標或您的財務狀況。我們的目標是帶給您基本數據驅動的長期關注分析。請注意,我們的分析可能不考慮最新的價格敏感公司公告或定性材料。Simply Wall St沒有任何股票頭寸。
譯文內容由第三人軟體翻譯。
