
TriNet Group (NYSE:TNET) Shareholders Have Earned a 10% CAGR Over the Last Five Years
TriNet Group (NYSE:TNET) Shareholders Have Earned a 10% CAGR Over the Last Five Years
 Over half a decade, TriNet Group managed to grow its earnings per share at 18% a year. The EPS growth is more impressive than the yearly share price gain of 10% over the same period. So one could conclude that the broader market has become more cautious towards the stock.
 When you buy and hold a stock for the long term, you definitely want it to provide a positive return. Better yet, you'd like to see the share price move up more than the market average. But TriNet Group, Inc. (NYSE:TNET) has fallen short of that second goal, with a share price rise of 61% over five years, which is below the market return. Unfortunately the share price is down 18% in the last year.
當您買入並持有一支股票進行長期投資時,您肯定希望它能帶來正回報。更好的情況是,您希望看到股價上漲幅度超過市場平均水平。但是TriNet Group, Inc. (紐交所:TNET)並未達到第二個目標,其股價在過去五年中僅上漲了61%,低於市場回報率。遺憾的是,過去一年股價下跌了18%。
So let's assess the underlying fundamentals over the last 5 years and see if they've moved in lock-step with shareholder returns.
因此,讓我們評估過去5年的基本面,看看它們是否和股東的回報率相符。
While the efficient markets hypothesis continues to be taught by some, it has been proven that markets are over-reactive dynamic systems, and investors are not always rational. By comparing earnings per share (EPS) and share price changes over time, we can get a feel for how investor attitudes to a company have morphed over time.
儘管一些人繼續教授有效市場假說,但已經證明市場是過度反應的動態系統,並且投資者並不總是理性的。通過比較每股收益(EPS)和股價的變化情況,我們可以了解投資者對公司的態度如何隨着時間變化而變化。
Over half a decade, TriNet Group managed to grow its earnings per share at 18% a year. The EPS growth is more impressive than the yearly share price gain of 10% over the same period. So one could conclude that the broader market has become more cautious towards the stock.
在過去的五年中,TriNet Group成功以每股收益增長18%的速度增長。每股收益增長速度比同期股價每年10%的漲幅更令人印象深刻。因此,人們可以得出結論,整體市場對該股變得更加謹慎。
You can see below how EPS has changed over time (discover the exact values by clicking on the image).
下面可以看到每股收益隨時間的變化情況(通過點擊圖像來查看確切數值)。
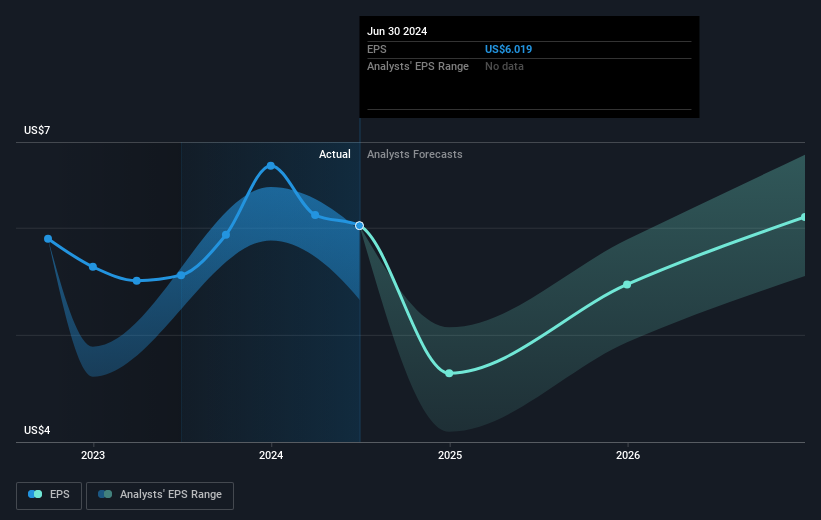
Dive deeper into TriNet Group's key metrics by checking this interactive graph of TriNet Group's earnings, revenue and cash flow.
通過查看TriNet Group的收益、營業收入和現金流的互動圖表,深入了解TriNet Group的關鍵指標。
A Different Perspective
不同的觀點
While the broader market gained around 33% in the last year, TriNet Group shareholders lost 18% (even including dividends). However, keep in mind that even the best stocks will sometimes underperform the market over a twelve month period. On the bright side, long term shareholders have made money, with a gain of 10% per year over half a decade. If the fundamental data continues to indicate long term sustainable growth, the current sell-off could be an opportunity worth considering. I find it very interesting to look at share price over the long term as a proxy for business performance. But to truly gain insight, we need to consider other information, too. To that end, you should be aware of the 2 warning signs we've spotted with TriNet Group .
在過去一年裏,雖然整體市場增長了約33%,但TriNet Group的股東卻損失了18%(即使包括分紅在內)。然而,請記住,即使是最好的股票有時也會在十二個月的時間內表現不佳。 從積極的一面來看,長期股東已經賺錢了,在過去的半個世紀裏每年增長10%。如果基本數據繼續表明長期可持續增長,當前的拋售可能值得考慮。我發現長期來看股價作爲業績表現的替身非常有趣。但要真正獲得洞察力,我們還需要考慮其他信息。爲此,您應該注意我們發現的TriNet Group的2個警示信號。
Of course TriNet Group may not be the best stock to buy. So you may wish to see this free collection of growth stocks.
當然,TriNet Group可能不是最好的股票購買選擇。因此,您可能希望查看這些免費的增長股收藏。
Please note, the market returns quoted in this article reflect the market weighted average returns of stocks that currently trade on American exchanges.
請注意,本文所引述的市場回報反映了目前在美國交易所上市的股票的市場加權平均回報。
Have feedback on this article? Concerned about the content? Get in touch with us directly. Alternatively, email editorial-team (at) simplywallst.com.
This article by Simply Wall St is general in nature. We provide commentary based on historical data and analyst forecasts only using an unbiased methodology and our articles are not intended to be financial advice. It does not constitute a recommendation to buy or sell any stock, and does not take account of your objectives, or your financial situation. We aim to bring you long-term focused analysis driven by fundamental data. Note that our analysis may not factor in the latest price-sensitive company announcements or qualitative material. Simply Wall St has no position in any stocks mentioned.
對本文有任何反饋?對內容有任何疑慮?請直接與我們聯繫。或者,發送電子郵件至editorial-team@simplywallst.com。
這篇文章是Simply Wall St的一般性文章。我們根據歷史數據和分析師預測提供評論,只使用公正的方法論,我們的文章並不意味着提供任何金融建議。文章不構成買賣任何股票的建議,也不考慮您的目標或您的財務狀況。我們的目標是帶給您基本數據驅動的長期關注分析。請注意,我們的分析可能不考慮最新的價格敏感公司公告或定性材料。Simply Wall St沒有任何股票頭寸。
譯文內容由第三人軟體翻譯。
