
TechnipFMC's (NYSE:FTI) Three-year Earnings Growth Trails the Impressive Shareholder Returns
TechnipFMC's (NYSE:FTI) Three-year Earnings Growth Trails the Impressive Shareholder Returns
 During three years of share price growth, TechnipFMC moved from a loss to profitability. That kind of transition can be an inflection point that justifies a strong share price gain, just as we have seen here.
 It might seem bad, but the worst that can happen when you buy a stock (without leverage) is that its share price goes to zero. But if you buy shares in a really great company, you can more than double your money. To wit, the TechnipFMC plc (NYSE:FTI) share price has flown 247% in the last three years. That sort of return is as solid as granite. It's also up 14% in about a month. But the price may well have benefitted from a buoyant market, since stocks have gained 7.2% in the last thirty days.
購買股票(不使用槓桿)可能看起來不好,但最壞的情況就是其股價跌至零。但如果你購買了一家真正優秀的公司的股票,你可以賺取一倍以上的利潤。舉個例子,德希尼布fmc plc (紐交所:FTI) 的股價在過去三年中暴漲了247%。這種回報就像堅如磐石。股價在一個月內上漲了14%。但股價的漲幅很可能受益於一個蓬勃的市場,因爲過去三十天股票漲幅爲7.2%。
On the back of a solid 7-day performance, let's check what role the company's fundamentals have played in driving long term shareholder returns.
在穩定的七天表現之後,讓我們看看公司的基本面對長期股東回報的影響。
To paraphrase Benjamin Graham: Over the short term the market is a voting machine, but over the long term it's a weighing machine. One way to examine how market sentiment has changed over time is to look at the interaction between a company's share price and its earnings per share (EPS).
用本傑明·格雷厄姆的話來說:「短期市場是一臺投票機,但長期市場是一臺稱重機」。檢查市場情緒如何隨時間推移變化的一種方式是查看公司股價和每股收益(EPS)之間的相互作用。
During three years of share price growth, TechnipFMC moved from a loss to profitability. That kind of transition can be an inflection point that justifies a strong share price gain, just as we have seen here.
在股價持續增長的三年期間,德希尼布fmc 實現了從虧損到盈利的轉變。這種轉變可能是一個能帶來強勁股價上漲的拐點,正如我們在這裏看到的。
The graphic below depicts how EPS has changed over time (unveil the exact values by clicking on the image).
下圖顯示了EPS隨時間變化的情況(點擊圖像以顯示確切值)。
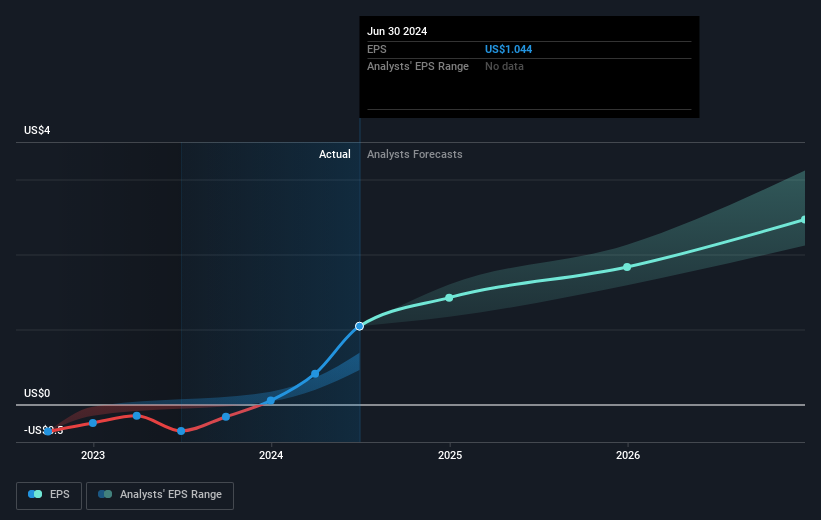
It is of course excellent to see how TechnipFMC has grown profits over the years, but the future is more important for shareholders. This free interactive report on TechnipFMC's balance sheet strength is a great place to start, if you want to investigate the stock further.
看到德希尼布fmc多年來利潤增長當然是令人振奮的,但對於股東們來說,未來更爲重要。如果您想進一步調查這支股票,這份免費的互動報告可從德希尼布fmc財務狀況穩健的角度入手,是一個絕佳的起點。
What About Dividends?
那麼分紅怎麼樣呢?
As well as measuring the share price return, investors should also consider the total shareholder return (TSR). The TSR incorporates the value of any spin-offs or discounted capital raisings, along with any dividends, based on the assumption that the dividends are reinvested. Arguably, the TSR gives a more comprehensive picture of the return generated by a stock. In the case of TechnipFMC, it has a TSR of 251% for the last 3 years. That exceeds its share price return that we previously mentioned. And there's no prize for guessing that the dividend payments largely explain the divergence!
除了衡量股價回報,投資者還應考慮總股東回報率(TSR)。TSR包括任何拆股或折價增資的價值,以及基於股息再投資的假設。可以說,TSR提供了更全面的股票回報畫面。在德希尼布fmc的情況下,過去3年TSR爲251%。這超過了我們之前提到的股價回報。毋庸置疑,股息支付在很大程度上解釋了這種差異!
A Different Perspective
不同的觀點
TechnipFMC's TSR for the year was broadly in line with the market average, at 38%. Most would be happy with a gain, and it helps that the year's return is actually better than the average return over five years, which was 11%. It is possible that management foresight will bring growth well into the future, even if the share price slows down. Most investors take the time to check the data on insider transactions. You can click here to see if insiders have been buying or selling.
德希尼布fmc今年的TSR大致與市場平均水平相當,爲38%。大多數人都會對這樣的漲幅感到滿意,而事實證明今年的回報實際上優於過去五年的平均回報,後者爲11%。管理層的遠見很可能會爲未來帶來增長,即使股價放緩。大多數投資者會花時間查看內部交易數據。您可以點擊這裏查看內部人員是否一直在買賣。
Of course, you might find a fantastic investment by looking elsewhere. So take a peek at this free list of companies we expect will grow earnings.
當然,您可能在其他地方找到一家出色的企業進行投資。因此,請查看我們預計將實現盈利增長的公司的免費列表。
Please note, the market returns quoted in this article reflect the market weighted average returns of stocks that currently trade on American exchanges.
請注意,本文所引述的市場回報反映了目前在美國交易所上市的股票的市場加權平均回報。
Have feedback on this article? Concerned about the content? Get in touch with us directly. Alternatively, email editorial-team (at) simplywallst.com.
This article by Simply Wall St is general in nature. We provide commentary based on historical data and analyst forecasts only using an unbiased methodology and our articles are not intended to be financial advice. It does not constitute a recommendation to buy or sell any stock, and does not take account of your objectives, or your financial situation. We aim to bring you long-term focused analysis driven by fundamental data. Note that our analysis may not factor in the latest price-sensitive company announcements or qualitative material. Simply Wall St has no position in any stocks mentioned.
對本文有任何反饋?對內容有任何疑慮?請直接與我們聯繫。或者,發送電子郵件至editorial-team@simplywallst.com。
這篇文章是Simply Wall St的一般性文章。我們根據歷史數據和分析師預測提供評論,只使用公正的方法論,我們的文章並不意味着提供任何金融建議。文章不構成買賣任何股票的建議,也不考慮您的目標或您的財務狀況。我們的目標是帶給您基本數據驅動的長期關注分析。請注意,我們的分析可能不考慮最新的價格敏感公司公告或定性材料。Simply Wall St沒有任何股票頭寸。
譯文內容由第三人軟體翻譯。
