
Analyzing Mastercard In Comparison To Competitors In Financial Services Industry
Analyzing Mastercard In Comparison To Competitors In Financial Services Industry
 At
At In the ever-evolving and intensely competitive business landscape, conducting a thorough company analysis is of utmost importance for investors and industry followers. In this article, we will carry out an in-depth industry comparison, assessing Mastercard (NYSE:MA) alongside its primary competitors in the Financial Services industry. By meticulously examining key financial metrics, market positioning, and growth prospects, we aim to offer valuable insights to investors and shed light on company's performance within the industry.
在不斷演變和競爭激烈的商業環境中,對於投資者和行業跟蹤者來說,進行徹底的公司分析至關重要。在本文中,我們將進行深入的行業比較,評估萬事達(紐交所: MA)與其在金融服務行業中的主要競爭對手。通過精心考察關鍵的財務指標、市場定位和增長前景,我們旨在爲投資者提供有價值的見解,並揭示公司在行業內的表現。
Mastercard Background
萬事達背景
Mastercard is the second-largest payment processor in the world, having processed close to over $9 trillion in volume during 2023. Mastercard operates in over 200 countries and processes transactions in over 150 currencies.
萬事達是全球第二大支付處理器,在2023年處理了超過9萬億美元的交易量。萬事達在全球200多個國家和地區運營,可以處理超過150種貨幣的交易。
| Company | P/E | P/B | P/S | ROE | EBITDA (in billions) | Gross Profit (in billions) | Revenue Growth |
|---|---|---|---|---|---|---|---|
| Mastercard Inc | 38.05 | 61.96 | 17.66 | 44.44% | $4.32 | $5.35 | 11.04% |
| Visa Inc | 29.76 | 14.12 | 16.27 | 12.62% | $6.45 | $7.13 | 9.57% |
| Fiserv Inc | 32.25 | 3.79 | 5.61 | 3.14% | $2.22 | $3.12 | 7.38% |
| PayPal Holdings Inc | 19.26 | 3.93 | 2.75 | 5.46% | $1.75 | $3.61 | 8.21% |
| Fidelity National Information Services Inc | 83.79 | 2.71 | 4.92 | 1.39% | $0.8 | $0.95 | 2.68% |
| Block Inc | 62.06 | 2.14 | 1.80 | 1.02% | $0.6 | $2.23 | 11.21% |
| Global Payments Inc | 18.10 | 1.12 | 2.58 | 1.68% | $1.08 | $1.63 | 4.74% |
| Corpay Inc | 24.06 | 8.36 | 6.35 | 8.38% | $0.51 | $0.77 | 2.9% |
| Jack Henry & Associates Inc | 34.83 | 7.21 | 6 | 5.58% | $0.18 | $0.23 | 4.73% |
| WEX Inc | 36.33 | 4.84 | 3.39 | 4.32% | $0.25 | $0.41 | 8.4% |
| Shift4 Payments Inc | 55.48 | 8.73 | 2.04 | 5.7% | $0.13 | $0.23 | 29.83% |
| Euronet Worldwide Inc | 17.06 | 3.62 | 1.27 | 6.76% | $0.18 | $0.41 | 5.02% |
| The Western Union Co | 7.20 | 9.04 | 0.98 | 33.62% | $0.24 | $0.4 | -8.85% |
| StoneCo Ltd | 10.40 | 1.25 | 1.60 | 3.29% | $1.13 | $2.25 | 11.86% |
| Payoneer Global Inc | 29.65 | 4.40 | 3.30 | 4.87% | $0.06 | $0.2 | 15.86% |
| PagSeguro Digital Ltd | 7.65 | 1 | 1.53 | 3.59% | $1.83 | $-0.02 | 6.74% |
| Paymentus Holdings Inc | 80 | 5.73 | 3.77 | 2.1% | $0.02 | $0.06 | 32.55% |
| DLocal Ltd | 20 | 5.67 | 3.77 | 10.06% | $0.06 | $0.07 | 6.29% |
| Evertec Inc | 32.59 | 4.53 | 2.87 | 6.44% | $0.09 | $0.11 | 26.88% |
| Average | 33.36 | 5.12 | 3.93 | 6.67% | $0.98 | $1.32 | 10.33% |
| 公司 | 市銷率P/S | 淨資產收益率ROE | 息稅前收入EBITDA (以十億計) | 毛利潤 (以十億計) | 營收增長 | CrowdStrike Holdings Inc (847.84) | 營業收入增長 |
|---|---|---|---|---|---|---|---|
| 萬事達公司 | 38.05 | 61.96 | 17.66 | 44.44% | $4.32 | $5.35 | 11.04% |
| Visa Inc | 29.76 | 14.12 | 16.27 | 12.62% | $6.45 | $7.13 | 9.57% |
| Fiserv公司 | 32.25 | 3.79 | 5.61 | 3.14% | $2.22 | $3.12 | 7.38% |
| PayPal Holdings Inc | 19.26 | 3.93 | 2.75 | 5.46% | $1.75 | $3.61 | 8.21% |
| 繁德信息技術公司 | 83.79 | 2.71 | 4.92 | 1.39% | $0.8 | 0.95美元 | 2.68% |
| Block公司 | 62.06 | 2.14 | 1.80 | 1.02% | $0.6 | $2.23 | 11.21% |
| Global Payments公司 | 18.10 | 1.12 | 2.58 | 1.68% | $1.08 | $1.63 | 4.74% |
| Corpay公司 | 24.06 | 8.36 | 6.35 | 8.38% | $0.51 | $0.77 | 2.9% |
| 傑克·亨利和合夥人公司 | 通過分析萬事達卡,我們可以推斷出以下趨勢: | 7.21 | 6 | 5.58% | 0.18美元 | $0.23 | 4.73% |
| wex inc | 36.33 | 4.84 | 3.39 | 4.32% | $0.25 | $0.41 | 8.4% |
| shift4 payments inc | 55.48 | 8.73 | 2.04 | 5.7% | 0.13元 | $0.23 | 29.83% |
| Euronet Worldwide Inc | 17.06 | 3.62 | 1.27 | 6.76% | 0.18美元 | $0.41 | 5.02% |
| 西聯匯款公司 | 7.20 | 9.04 | 0.98 | 33.62% | 0.24美元 | $0.4 | -8.85% |
| stoneco ltd | 10.40 | 根據公司的固定費用覆蓋率,利率爲1.25% 至 1.75%每年,或者(b)有一個「備選主板利率」,並可減少至0.75%每年,取決於公司的固定費用覆蓋率。截至2021年7月3日,公司的基於LIBOR的利率爲% (對於$),公司的主板基準利率爲% (對於$)。根據未取出的貸款利率,每月應支付承諾費,利率爲%每年。根據與摩根大通銀行(「貸款協議」)的信貸協議的條款,現金收據將被存入鎖匣中,並由公司自行決定,除非處於「現金控制期」,在此期間,現金收據將用於減少貸款協議下的應付金額。現金控制期在事件違約或可用餘額連續三個工作日低於$時觸發,並將繼續到先前的連續天數中存在任何違約事件且多餘的可用餘額始終大於$(這樣的觸發器根據公司的循環承諾進行調整)。此外,如果依據信貸協議所定義的「額外可用餘額」小於$,則公司應維持最低固定費用覆蓋率爲1.0至1.0 (觸發器根據公司的循環承諾進行調整)。截至2021年7月3日,公司的可用餘額爲$25,764。信貸協議要求我們在判斷任何應支付股息或進行任何普通股分配時獲得摩根大通銀行的事先書面同意。信貸設施於2022年12月16日到期。 | 1.60 | 3.29% | $1.13 | 2.25美元 | 11.86% |
| Payoneer全球貨幣公司 | 29.65 | 4.40 | 僅當A類普通股票的收盤價等於或超過330.00美元時,公司才可以贖回未行使的認股權證。 | 4.87% | 0.06美元 | $0.2 | 15.86% |
| pagseguro digital有限公司 | 7.65 | 1 | 1.53 | 3.59% | $1.83 | $-0.02 | 6.74% |
| Paymentus Holdings Inc | 80 | 5.73 | 3.77 | 2.1% | $0.02 | 0.06美元 | 32.55% |
| DLocal有限公司 | 20 | 5.67 | 3.77 | 10.06% | 0.06美元 | 0.07美元 | 6.29% |
| Evertec Inc | 32.59 | 截至2021年9月30日的每股淨有形賬面價值 | 2.87 | 6.44% | $0.09 | $0.11 | 26.88% |
| 平均值 | 33.36 | 5.12 | 3.93 | 6.67% | $0.98 | $1.32 | 10.33% |
When conducting a detailed analysis of Mastercard, the following trends become clear:
在對萬事達進行詳細分析時,以下趨勢變得清晰:
At 38.05, the stock's Price to Earnings ratio significantly exceeds the industry average by 1.14x, suggesting a premium valuation relative to industry peers.
It could be trading at a premium in relation to its book value, as indicated by its Price to Book ratio of 61.96 which exceeds the industry average by 12.1x.
With a relatively high Price to Sales ratio of 17.66, which is 4.49x the industry average, the stock might be considered overvalued based on sales performance.
The Return on Equity (ROE) of 44.44% is 37.77% above the industry average, highlighting efficient use of equity to generate profits.
With higher Earnings Before Interest, Taxes, Depreciation, and Amortization (EBITDA) of $4.32 Billion, which is 4.41x above the industry average, the company demonstrates stronger profitability and robust cash flow generation.
The gross profit of $5.35 Billion is 4.05x above that of its industry, highlighting stronger profitability and higher earnings from its core operations.
With a revenue growth of 11.04%, which surpasses the industry average of 10.33%, the company is demonstrating robust sales expansion and gaining market share.
在38.05的價格下,該股票的市盈率明顯超過行業平均水平1.14倍,表明相對於行業同行來說估值較高。
根據其61.96的市淨率顯示,它可能在相對於賬面價值上交易溢價,超過行業平均水平12.1倍。
市銷率高達17.66,是行業平均水平的4.49倍,基於營業收入表現,該股可能被認爲是被高估的。
44.44%的roe高出行業平均水平37.77%,突顯出有效利用權益以創造利潤。
憑藉高達43.2億美元的稅息折舊及攤銷前利潤(EBITDA),比行業平均水平高出4.41倍,該公司展現出更強的盈利能力和穩健的現金流生成能力。
53.5億美元的毛利潤是其行業的4.05倍,突顯了更強的盈利能力和來自核心業務的更高收入。
With a revenue growth of 11.04%, which surpasses the industry average of 10.33%, the company is demonstrating robust sales expansion and gaining market share.
Debt To Equity Ratio
債務權益比率
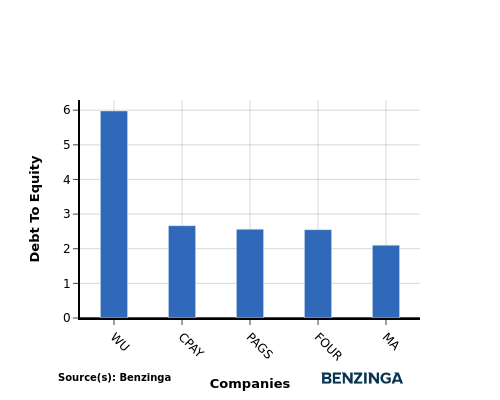
The debt-to-equity (D/E) ratio gauges the extent to which a company has financed its operations through debt relative to equity.
負債與股本比率衡量了公司通過債務相對於股本來籌資運營的程度。
Considering the debt-to-equity ratio in industry comparisons allows for a concise evaluation of a company's financial health and risk profile, aiding in informed decision-making.
在行業比較中考慮債務權益比率可以簡明地評估公司的財務狀況和風險特徵,有助於投資者做出明智的決策。
When evaluating Mastercard alongside its top 4 peers in terms of the Debt-to-Equity ratio, the following insights arise:
在評估萬事達與其前4名同行的負債-權益比時,可以得出以下見解:
In terms of the debt-to-equity ratio, Mastercard has a lower level of debt compared to its top 4 peers, indicating a stronger financial position.
This implies that the company relies less on debt financing and has a more favorable balance between debt and equity with a lower debt-to-equity ratio of 2.1.
就負債與權益比率而言,萬事達的債務水平較其前4位同行更低,表明其財務狀況更強。
這意味着該公司更少依賴債務融資,並且在債務與權益之間有更有利的平衡,債務資產比爲2.1。
Key Takeaways
要點
For Mastercard, the PE, PB, and PS ratios are all high compared to its peers in the Financial Services industry, indicating potential overvaluation. On the other hand, Mastercard's high ROE, EBITDA, gross profit, and revenue growth suggest strong operational performance and growth prospects relative to industry competitors. This combination of high valuation multiples and strong financial metrics positions Mastercard as a standout player in the sector.
對於萬事達卡來說,市盈率、市淨率和市銷率都高於金融服務行業同行,表明潛在的過度估值。另一方面,萬事達卡高ROE、EBITDA、毛利潤和營業收入增長暗示相對於行業競爭對手,其業務運營性能和增長前景強勁。這種高估值倍數和強勁財務指標的結合將萬事達卡定位爲該板塊的傑出角色。
This article was generated by Benzinga's automated content engine and reviewed by an editor.
本文由Benzinga的自動化內容引擎生成並由編輯審查。
譯文內容由第三人軟體翻譯。