
Comparing Visa With Industry Competitors In Financial Services Industry
Comparing Visa With Industry Competitors In Financial Services Industry
 The stock's Price to Earnings ratio of
 In the ever-evolving and intensely competitive business landscape, conducting a thorough company analysis is of utmost importance for investors and industry followers. In this article, we will carry out an in-depth industry comparison, assessing Visa (NYSE:V) alongside its primary competitors in the Financial Services industry. By meticulously examining key financial metrics, market positioning, and growth prospects, we aim to offer valuable insights to investors and shed light on company's performance within the industry.
在不斷髮展和競爭激烈的商業環境中,進行徹底的公司分析對投資者和行業關注者至關重要。在本文中,我們將進行深入的行業比較,評估紐交所萬事達(Visa)及其在金融服務行業中的主要競爭對手。通過精心審查關鍵財務指標、市場定位和增長前景,我們旨在爲投資者提供有價值的見解,揭示公司在行業中的表現。
Visa Background
Visa背景
Visa is the largest payment processor in the world. In fiscal 2023, it processed almost $15 trillion in total volume. Visa operates in over 200 countries and processes transactions in over 160 currencies. Its systems are capable of processing over 65,000 transactions per second.
Visa是世界上最大的支付處理器。在2023財年,它的總成交量接近15萬億美元。Visa在200多個國家和地區開展業務,並可以處理來自160多種貨幣的交易。其系統每秒可處理超過65000筆交易。
| Company | P/E | P/B | P/S | ROE | EBITDA (in billions) | Gross Profit (in billions) | Revenue Growth |
|---|---|---|---|---|---|---|---|
| Visa Inc | 29.64 | 14.06 | 16.21 | 12.62% | $6.45 | $7.13 | 9.57% |
| Mastercard Inc | 37.84 | 61.62 | 17.56 | 44.44% | $4.32 | $5.35 | 11.04% |
| Fiserv Inc | 31.89 | 3.75 | 5.55 | 3.14% | $2.22 | $3.12 | 7.38% |
| PayPal Holdings Inc | 18.76 | 3.83 | 2.68 | 5.46% | $1.75 | $3.61 | 8.21% |
| Fidelity National Information Services Inc | 82.88 | 2.68 | 4.86 | 1.39% | $0.8 | $0.95 | 2.68% |
| Block Inc | 60.78 | 2.09 | 1.76 | 1.02% | $0.6 | $2.23 | 11.21% |
| Global Payments Inc | 18.02 | 1.12 | 2.57 | 1.68% | $1.08 | $1.63 | 4.74% |
| Corpay Inc | 23.18 | 8.05 | 6.12 | 8.38% | $0.51 | $0.77 | 2.9% |
| Jack Henry & Associates Inc | 35.10 | 7.26 | 6.05 | 5.58% | $0.18 | $0.23 | 4.73% |
| WEX Inc | 35.67 | 4.75 | 3.33 | 4.32% | $0.25 | $0.41 | 8.4% |
| Shift4 Payments Inc | 54.07 | 8.51 | 1.99 | 5.7% | $0.13 | $0.23 | 29.83% |
| Euronet Worldwide Inc | 16.84 | 3.57 | 1.26 | 6.76% | $0.18 | $0.41 | 5.02% |
| The Western Union Co | 7.12 | 8.95 | 0.97 | 33.62% | $0.24 | $0.4 | -8.85% |
| StoneCo Ltd | 10.08 | 1.21 | 1.55 | 3.29% | $1.13 | $2.25 | 11.86% |
| Payoneer Global Inc | 29.54 | 4.38 | 3.28 | 4.87% | $0.06 | $0.2 | 15.86% |
| PagSeguro Digital Ltd | 7.61 | 0.99 | 1.53 | 3.59% | $1.83 | $-0.02 | 6.74% |
| DLocal Ltd | 19.68 | 5.58 | 3.71 | 10.06% | $0.06 | $0.07 | 6.29% |
| Paymentus Holdings Inc | 76.23 | 5.46 | 3.59 | 2.1% | $0.02 | $0.06 | 32.55% |
| Evertec Inc | 31.97 | 4.44 | 2.82 | 6.44% | $0.09 | $0.11 | 26.88% |
| Average | 33.18 | 7.68 | 3.95 | 8.44% | $0.86 | $1.22 | 10.41% |
| 公司 | 市銷率P/S | 淨資產收益率ROE | 息稅前收入EBITDA (以十億計) | 毛利潤 (以十億計) | 營收增長 | CrowdStrike Holdings Inc (847.84) | 營業收入增長 |
|---|---|---|---|---|---|---|---|
| Visa Inc | 29.64 | 14.06 | 16.21 | 12.62% | $6.45 | $7.13 | 9.57% |
| 萬事達公司 | 37.84 | 61.62 | 17.56 | 44.44% | $4.32 | $5.35 | 11.04% |
| Fiserv公司 | 31.89 | 3.75 | 5.55 | 3.14% | $2.22 | $3.12 | 7.38% |
| PayPal Holdings Inc | 18.76 | 3.83 | 2.68 | 5.46% | $1.75 | $3.61 | 8.21% |
| 繁德信息技術公司 | 82.88 | 2.68 | 1563446663 | 1.39% | $0.8 | 0.95美元 | 2.68% |
| Block公司 | 60.78 | 2.09 | 1.76 | 1.02% | $0.6 | $2.23 | 11.21% |
| Global Payments公司 | 18.02 | 1.12 | 2.57 | 1.68% | $1.08 | $1.63 | 4.74% |
| Corpay公司 | 這些限制性股票單元的中位數結算週期爲約3年。 | 8.05 | 6.12 | 8.38% | $0.51 | $0.77 | 2.9% |
| 傑克·亨利和合夥人公司 | 35.10 | 7.26 | 153,706 | 5.58% | 0.18美元 | $0.23 | 4.73% |
| wex inc | 35.67 | 4.75美元 | 3.33 | 4.32% | $0.25 | $0.41 | 8.4% |
| shift4 payments inc | 54.07 | 8.51 | 1.99 | 5.7% | 0.13元 | $0.23 | 29.83% |
| Euronet Worldwide Inc | 16.84 | 3.57 | 1.26 | 6.76% | 0.18美元 | $0.41 | 5.02% |
| 西聯匯款公司 | 7.12 | 8.95 | 0.97 | 33.62% | 0.24美元 | $0.4 | -8.85% |
| stoneco ltd | 10.08 | 1.21 | 1.55 | 3.29% | $1.13 | 2.25美元 | 11.86% |
| Payoneer全球貨幣公司 | 29.54 | 4.38 | 3.28 | 4.87% | 0.06美元 | $0.2 | 15.86% |
| pagseguro digital有限公司 | 7.61 | 0.99 | 1.53 | 3.59% | $1.83 | $-0.02 | 6.74% |
| DLocal有限公司 | 19.68 | 5.58 | 3.71 | 10.06% | 0.06美元 | 0.07美元 | 6.29% |
| Paymentus Holdings Inc | 76.23 | 5.46 | 3.59 | 2.1% | $0.02 | 0.06美元 | 32.55% |
| Evertec Inc | 31.97 | 4.44 | 2.82 | 6.44% | $0.09 | $0.11 | 26.88% |
| 平均值 | 33.18 | 7.68 | 3.95 | 8.44% | 每股0.86美元 | $1.22 | 10.41% |
After a detailed analysis of Visa, the following trends become apparent:
經過對Visa的詳細分析,以下趨勢變得明顯:
The stock's Price to Earnings ratio of 29.64 is lower than the industry average by 0.89x, suggesting potential value in the eyes of market participants.
The elevated Price to Book ratio of 14.06 relative to the industry average by 1.83x suggests company might be overvalued based on its book value.
With a relatively high Price to Sales ratio of 16.21, which is 4.1x the industry average, the stock might be considered overvalued based on sales performance.
With a Return on Equity (ROE) of 12.62% that is 4.18% above the industry average, it appears that the company exhibits efficient use of equity to generate profits.
The Earnings Before Interest, Taxes, Depreciation, and Amortization (EBITDA) of $6.45 Billion is 7.5x above the industry average, highlighting stronger profitability and robust cash flow generation.
The company has higher gross profit of $7.13 Billion, which indicates 5.84x above the industry average, indicating stronger profitability and higher earnings from its core operations.
The company's revenue growth of 9.57% is significantly lower compared to the industry average of 10.41%. This indicates a potential fall in the company's sales performance.
該股票的市盈率爲29.64,低於行業平均水平0.89倍,這表明在市場參與者眼中存在潛在價值。
相對於行業平均水平高出1.83倍的14.06的市淨率顯示,根據其賬面價值,該公司可能被高估。
股票的市銷率相對較高,爲16.21,是行業平均水平的4.1倍,基於銷售業績,該股可能被視爲被高估。
擁有12.62%的ROE(淨資產收益率)高於行業平均水平4.18%,表明該公司具有高效地利用股東權益創造利潤的能力。
64.5億美元的息稅折舊及攤銷前利潤(EBITDA)大於行業平均水平的7.5倍,突顯更強的盈利能力和強勁的現金流產生。
公司的毛利潤高達713億美元,高出行業平均水平的5.84倍,顯示出更強的盈利能力和核心業務收益更高。
公司的營業收入增長率爲9.57%,明顯低於行業平均水平的10.41%。這表明公司銷售業績可能出現下滑。
Debt To Equity Ratio
債務權益比率
The debt-to-equity (D/E) ratio helps evaluate the capital structure and financial leverage of a company.
債務權益比率有助於評估公司的資本結構和財務槓桿。
Considering the debt-to-equity ratio in industry comparisons allows for a concise evaluation of a company's financial health and risk profile, aiding in informed decision-making.
在行業比較中考慮債務權益比率可以簡明地評估公司的財務狀況和風險特徵,有助於投資者做出明智的決策。
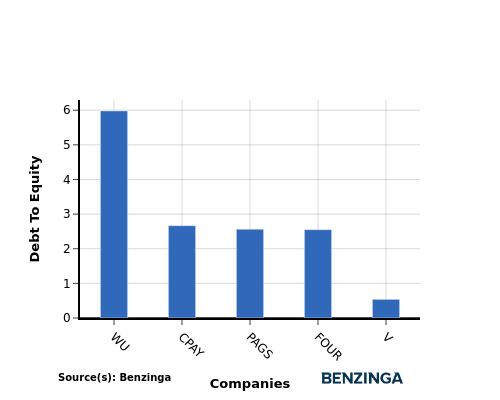
When examining Visa in comparison to its top 4 peers with respect to the Debt-to-Equity ratio, the following information becomes apparent:
在比較Visa與其前4家同行公司的負債權益比時,以下信息顯而易見:
Visa demonstrates a stronger financial position compared to its top 4 peers in the sector.
With a lower debt-to-equity ratio of 0.54, the company relies less on debt financing and maintains a healthier balance between debt and equity, which can be viewed positively by investors.
相較於同板塊的前四名同行,Visa表現出更強的財務實力。
以較低的資產負債比0.54爲特徵,該公司對債務融資依賴較少,並保持了更健康的債務與股權之間的平衡,這可以被投資者積極看待。
Key Takeaways
要點
For Visa, the PE ratio is low compared to peers, indicating potential undervaluation. The high PB and PS ratios suggest strong market sentiment and revenue multiples. In terms of ROE, EBITDA, and gross profit, Visa demonstrates high profitability and operational efficiency. However, the low revenue growth may raise concerns about future performance relative to industry peers in the Financial Services sector.
對於Visa而言,市盈率相對同行較低,表明潛在低估。高市淨率和市銷率表明市場情緒強勁,營收倍增。在ROE、EBITDA和毛利潤方面,Visa展現出高盈利能力和運營效率。然而,低營收增長率可能引發對未來業績的擔憂,與金融服務行業同行相比。
This article was generated by Benzinga's automated content engine and reviewed by an editor.
本文由Benzinga的自動化內容引擎生成並由編輯審查。
譯文內容由第三人軟體翻譯。
