
Further Weakness as Foot Locker (NYSE:FL) Drops 9.3% This Week, Taking Three-year Losses to 44%
Further Weakness as Foot Locker (NYSE:FL) Drops 9.3% This Week, Taking Three-year Losses to 44%
 Over the three years that the share price declined, Foot Locker's earnings per share (EPS) dropped significantly, falling to a loss. Extraordinary items contributed to this situation. Due to the loss, it's not easy to use EPS as a reliable guide to the business. However, we can say we'd expect to see a falling share price in this scenario.
 As an investor its worth striving to ensure your overall portfolio beats the market average. But its virtually certain that sometimes you will buy stocks that fall short of the market average returns. We regret to report that long term Foot Locker, Inc. (NYSE:FL) shareholders have had that experience, with the share price dropping 50% in three years, versus a market return of about 24%. Unfortunately the share price momentum is still quite negative, with prices down 18% in thirty days. Importantly, this could be a market reaction to the recently released financial results. You can check out the latest numbers in our company report.
作爲投資者,值得努力確保您的整體投資組合能夠超過市場平均水平。但幾乎可以肯定,有時您會購買股票,其表現低於市場平均水平。我們遺憾地報告,長揸Foot Locker, Inc.(NYSE:FL)股票的股東已經有過這種經歷,股價在三年內下跌了50%,而市場回報率約爲24%。不幸的是,股價勢頭仍然非常負面,最近三十天下跌了18%。重要的是,這可能是對最近公佈的財務結果的市場反應。您可以在我們的公司報告中查看最新數據。
Given the past week has been tough on shareholders, let's investigate the fundamentals and see what we can learn.
考慮到過去一週對股東來說是艱難的,讓我們調查一下基本面並看看我們能學到什麼。
While the efficient markets hypothesis continues to be taught by some, it has been proven that markets are over-reactive dynamic systems, and investors are not always rational. One imperfect but simple way to consider how the market perception of a company has shifted is to compare the change in the earnings per share (EPS) with the share price movement.
雖然一些人仍然相信有效市場假說,但已經證明市場是過度反應的動態系統,投資者並不總是理性的。一個不完美但簡單的方法來考慮公司市場看法的變化是比較每股收益(EPS)的變化和股價的波動。
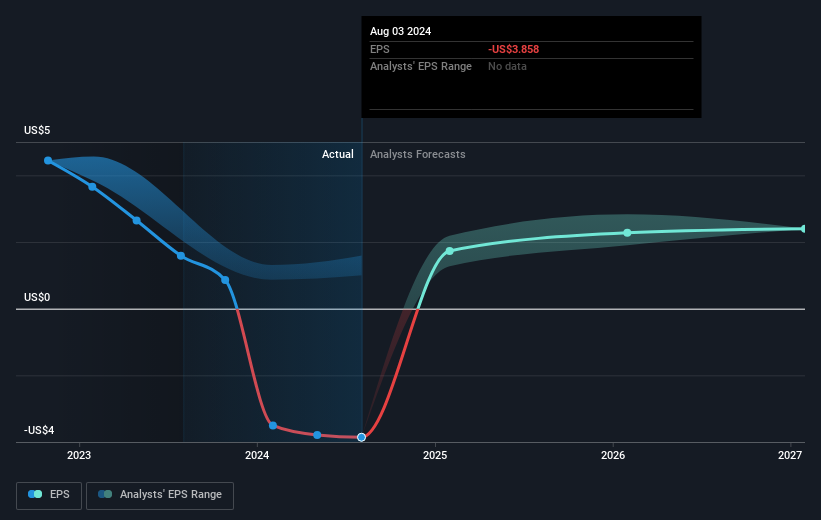
Over the three years that the share price declined, Foot Locker's earnings per share (EPS) dropped significantly, falling to a loss. Extraordinary items contributed to this situation. Due to the loss, it's not easy to use EPS as a reliable guide to the business. However, we can say we'd expect to see a falling share price in this scenario.
在股價下跌的三年期間,Foot Locker的每股收益(EPS)顯著下降,跌至虧損。非常物品導致了這種情況。由於虧損,很難將EPS作爲業務的可靠指南。然而,我們可以說在這種情況下我們預計會看到股價下跌。
You can see how EPS has changed over time in the image below (click on the chart to see the exact values).
您可以在下面的圖片中查看每股收益如何隨時間變化(單擊圖表以查看確切的價值)。
This free interactive report on Foot Locker's earnings, revenue and cash flow is a great place to start, if you want to investigate the stock further.
如果您想進一步調查這隻股票,可以從富樂客的收益、營業收入和現金流的免費互動報告開始。
What About The Total Shareholder Return (TSR)?
那麼,股東總回報(TSR)呢?
Investors should note that there's a difference between Foot Locker's total shareholder return (TSR) and its share price change, which we've covered above. Arguably the TSR is a more complete return calculation because it accounts for the value of dividends (as if they were reinvested), along with the hypothetical value of any discounted capital that have been offered to shareholders. Dividends have been really beneficial for Foot Locker shareholders, and that cash payout explains why its total shareholder loss of 44%, over the last 3 years, isn't as bad as the share price return.
投資者應該注意,富樂客的股東總收益率(TSR)與其股價變動之間存在差異,如前文所述。可以說TSR是更完整的收益計算,因爲它考慮了分紅的價值(就好像它們被再投資了一樣),以及任何爲股東提供的折現資本的假設價值。分紅對富樂客股東非常有益,這筆現金支付解釋了爲什麼過去3年中其總股東損失爲44%,並不像股價回報那麼糟糕。
A Different Perspective
不同的觀點
Foot Locker shareholders gained a total return of 28% during the year. Unfortunately this falls short of the market return. But at least that's still a gain! Over five years the TSR has been a reduction of 6% per year, over five years. So this might be a sign the business has turned its fortunes around. Shareholders might want to examine this detailed historical graph of past earnings, revenue and cash flow.
富樂客股東在該年度獲得了總收益率爲28%。不幸的是,這低於市場回報率。但至少這仍然是一筆盈利!在過去五年中,TSR每年減少了6%,這可能是業務已開始好轉的跡象。股東可能希望查看過往收益、營業收入和現金流情況的詳細歷史圖表。
If you are like me, then you will not want to miss this free list of undervalued small caps that insiders are buying.
如果您像我一樣,就不會希望錯過這份免費的內部人士正在購買的低估小市值股票列表。
Please note, the market returns quoted in this article reflect the market weighted average returns of stocks that currently trade on American exchanges.
請注意,本文所引述的市場回報反映了目前在美國交易所上市的股票的市場加權平均回報。
Have feedback on this article? Concerned about the content? Get in touch with us directly. Alternatively, email editorial-team (at) simplywallst.com.
This article by Simply Wall St is general in nature. We provide commentary based on historical data and analyst forecasts only using an unbiased methodology and our articles are not intended to be financial advice. It does not constitute a recommendation to buy or sell any stock, and does not take account of your objectives, or your financial situation. We aim to bring you long-term focused analysis driven by fundamental data. Note that our analysis may not factor in the latest price-sensitive company announcements or qualitative material. Simply Wall St has no position in any stocks mentioned.
對本文有任何反饋?對內容有任何疑慮?請直接與我們聯繫。或者,發送電子郵件至editorial-team@simplywallst.com。
這篇文章是Simply Wall St的一般性文章。我們根據歷史數據和分析師預測提供評論,只使用公正的方法論,我們的文章並不意味着提供任何金融建議。文章不構成買賣任何股票的建議,也不考慮您的目標或您的財務狀況。我們的目標是帶給您基本數據驅動的長期關注分析。請注意,我們的分析可能不考慮最新的價格敏感公司公告或定性材料。Simply Wall St沒有任何股票頭寸。
譯文內容由第三人軟體翻譯。
