
Fortune Brands Innovations (NYSE:FBIN) Shareholders Have Earned a 15% CAGR Over the Last Five Years
Fortune Brands Innovations (NYSE:FBIN) Shareholders Have Earned a 15% CAGR Over the Last Five Years
 During five years of share price growth, Fortune Brands Innovations achieved compound earnings per share (EPS) growth of 4.6% per year. This EPS growth is slower than the share price growth of 10% per year, over the same period. So it's fair to assume the market has a higher opinion of the business than it did five years ago. And that's hardly shocking given the track record of growth.
 When you buy and hold a stock for the long term, you definitely want it to provide a positive return. Better yet, you'd like to see the share price move up more than the market average. But Fortune Brands Innovations, Inc. (NYSE:FBIN) has fallen short of that second goal, with a share price rise of 60% over five years, which is below the market return. On a brighter note, more newer shareholders are probably rather content with the 49% share price gain over twelve months.
當你買入並持有一隻股票長期投資時,你肯定希望它能帶來正回報。更好的是,你希望看到股價漲幅超過市場平均水平。但是Fortune Brands Innovations, Inc.(紐交所:FBIN)未能實現第二個目標,股價在五年內上漲了60%,低於市場回報。更令人振奮的是,更多的新股東可能對過去十二個月的股價上漲49%感到滿意。
So let's assess the underlying fundamentals over the last 5 years and see if they've moved in lock-step with shareholder returns.
因此,讓我們評估過去5年的基本面,看看它們是否和股東的回報率相符。
While the efficient markets hypothesis continues to be taught by some, it has been proven that markets are over-reactive dynamic systems, and investors are not always rational. One flawed but reasonable way to assess how sentiment around a company has changed is to compare the earnings per share (EPS) with the share price.
雖然一些人仍然在教授高效市場假說,但已經證明市場是過度反應的動態系統,投資者不總是理性的。一種有缺陷但合理的評估公司情緒變化的方法是比較每股收益 (EPS) 與股價。
During five years of share price growth, Fortune Brands Innovations achieved compound earnings per share (EPS) growth of 4.6% per year. This EPS growth is slower than the share price growth of 10% per year, over the same period. So it's fair to assume the market has a higher opinion of the business than it did five years ago. And that's hardly shocking given the track record of growth.
在五年的股價增長過程中,Fortune Brands Innovations實現了每股收益(EPS)每年4.6%的複合增長率。這種EPS增長速度比同一時期每年10%的股價增長速度慢。所以可以合理地假設市場對該業務的看法比五年前更高。鑑於增長記錄,這並不令人震驚。
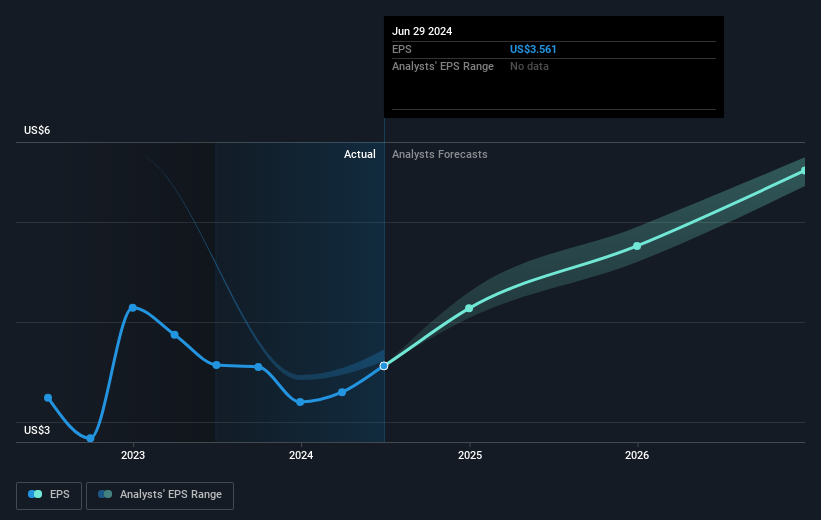
You can see below how EPS has changed over time (discover the exact values by clicking on the image).
下面可以看到每股收益隨時間的變化情況(通過點擊圖像來查看確切數值)。
Before buying or selling a stock, we always recommend a close examination of historic growth trends, available here.
在購買或出售股票之前,我們始終建議對歷史增長趨勢進行仔細研究,可以在這裏找到相關信息。
What About Dividends?
那麼分紅怎麼樣呢?
As well as measuring the share price return, investors should also consider the total shareholder return (TSR). The TSR is a return calculation that accounts for the value of cash dividends (assuming that any dividend received was reinvested) and the calculated value of any discounted capital raisings and spin-offs. So for companies that pay a generous dividend, the TSR is often a lot higher than the share price return. In the case of Fortune Brands Innovations, it has a TSR of 101% for the last 5 years. That exceeds its share price return that we previously mentioned. And there's no prize for guessing that the dividend payments largely explain the divergence!
除了衡量股價回報外,投資者還應考慮總股東回報(TSR)。 TSR是一種回報計算,考慮了現金分紅的價值(假設收到的任何股息都被再投資)以及任何折現的資本增發和拆分的計算值。 所以對於支付慷慨股息的公司,TSR往往比股價回報高得多。 就富德創新公司而言,過去5年的TSR爲101%。 這超過了我們之前提到的股價回報。 沒有人會猜測股息支付很大程度上解釋了這種差異!
A Different Perspective
不同的觀點
It's nice to see that Fortune Brands Innovations shareholders have received a total shareholder return of 51% over the last year. Of course, that includes the dividend. Since the one-year TSR is better than the five-year TSR (the latter coming in at 15% per year), it would seem that the stock's performance has improved in recent times. Someone with an optimistic perspective could view the recent improvement in TSR as indicating that the business itself is getting better with time. While it is well worth considering the different impacts that market conditions can have on the share price, there are other factors that are even more important. Take risks, for example - Fortune Brands Innovations has 1 warning sign we think you should be aware of.
看到富德創新公司股東在過去一年獲得了51%的總股東回報是件好事。 當然,其中包括股息。 由於一年的TSR優於五年的TSR(後者爲每年15%),因此股票的表現在最近時間內有所改善。 樂觀的觀點可能認爲TSR最近的改善表明業務本身隨着時間的推移正在變得更好。 雖然在考慮市場狀況對股價可能產生的不同影響時值得考慮,但還有其他更重要的因素。 以風險爲例-富德創新公司有一個我們認爲您應該注意的警示標誌。
Of course, you might find a fantastic investment by looking elsewhere. So take a peek at this free list of companies we expect will grow earnings.
當然,您可能在其他地方找到一家出色的企業進行投資。因此,請查看我們預計將實現盈利增長的公司的免費列表。
Please note, the market returns quoted in this article reflect the market weighted average returns of stocks that currently trade on American exchanges.
請注意,本文所引述的市場回報反映了目前在美國交易所上市的股票的市場加權平均回報。
Have feedback on this article? Concerned about the content? Get in touch with us directly. Alternatively, email editorial-team (at) simplywallst.com.
This article by Simply Wall St is general in nature. We provide commentary based on historical data and analyst forecasts only using an unbiased methodology and our articles are not intended to be financial advice. It does not constitute a recommendation to buy or sell any stock, and does not take account of your objectives, or your financial situation. We aim to bring you long-term focused analysis driven by fundamental data. Note that our analysis may not factor in the latest price-sensitive company announcements or qualitative material. Simply Wall St has no position in any stocks mentioned.
對本文有任何反饋?對內容有任何疑慮?請直接與我們聯繫。或者,發送電子郵件至editorial-team@simplywallst.com。
這篇文章是Simply Wall St的一般性文章。我們根據歷史數據和分析師預測提供評論,只使用公正的方法論,我們的文章並不意味着提供任何金融建議。文章不構成買賣任何股票的建議,也不考慮您的目標或您的財務狀況。我們的目標是帶給您基本數據驅動的長期關注分析。請注意,我們的分析可能不考慮最新的價格敏感公司公告或定性材料。Simply Wall St沒有任何股票頭寸。
譯文內容由第三人軟體翻譯。