
Those Who Invested in Universal Display (NASDAQ:OLED) a Year Ago Are up 36%
Those Who Invested in Universal Display (NASDAQ:OLED) a Year Ago Are up 36%
 During the last year Universal Display grew its earnings per share (EPS) by 7.0%. This EPS growth is significantly lower than the 35% increase in the share price. This indicates that the market is now more optimistic about the stock.
 Diversification is a key tool for dealing with stock price volatility. But if you're going to beat the market overall, you need to have individual stocks that outperform. Universal Display Corporation (NASDAQ:OLED) has done well over the last year, with the stock price up 35% beating the market return of 33% (not including dividends). The longer term returns have not been as good, with the stock price only 27% higher than it was three years ago.
分散投資是處理股價波動的關鍵工具。但如果你要打敗整個市場,就需要擁有表現優秀的個別股票。納斯達克:universl display公司(oled概念)在過去一年中表現不錯,股價上漲了35%,超過了市場回報率33%(不包括分紅派息)。長期回報表現不佳,股價僅比三年前高出27%。
Now it's worth having a look at the company's fundamentals too, because that will help us determine if the long term shareholder return has matched the performance of the underlying business.
現在值得更詳細地了解該公司的基本面,因爲這將幫助我們判斷長期股東回報是否與基礎業務的表現相匹配。
While the efficient markets hypothesis continues to be taught by some, it has been proven that markets are over-reactive dynamic systems, and investors are not always rational. One way to examine how market sentiment has changed over time is to look at the interaction between a company's share price and its earnings per share (EPS).
雖然有效市場假說仍然被一些人教授,但被證明市場是過度反應的動態系統,投資者並不總是理性的。檢查市場情緒如何隨時間變化的一種方法是看一個公司的股價與其每股收益(EPS)之間的交互作用。
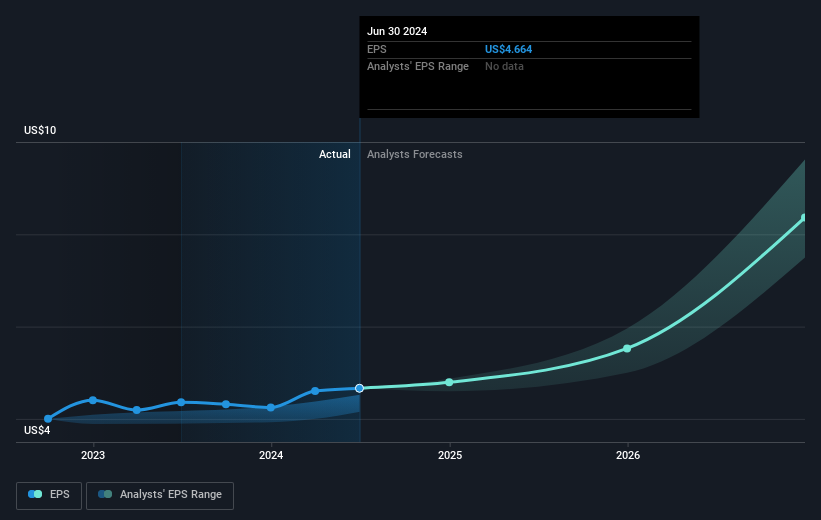
During the last year Universal Display grew its earnings per share (EPS) by 7.0%. This EPS growth is significantly lower than the 35% increase in the share price. This indicates that the market is now more optimistic about the stock.
在過去一年中,universal display增加了每股收益(EPS)達到7.0%。這種EPS增長明顯低於35%的股價增長。這表明市場現在對這支股票更加樂觀。
The image below shows how EPS has tracked over time (if you click on the image you can see greater detail).
下圖顯示了EPS隨時間的變化情況(如果您單擊該圖像,則可以查看更多詳細信息)。
It's good to see that there was some significant insider buying in the last three months. That's a positive. On the other hand, we think the revenue and earnings trends are much more meaningful measures of the business. This free interactive report on Universal Display's earnings, revenue and cash flow is a great place to start, if you want to investigate the stock further.
看到過去三個月內有一些重要的內部買入,這是一個積極的信號。另一方面,我們認爲營業收入和盈利趨勢是更有意義的業務衡量標準。如果您想進一步調查這支股票,Universal Display的營業收入、盈利和現金流的免費互動報告是一個很好的起點。
A Different Perspective
不同的觀點
Universal Display's TSR for the year was broadly in line with the market average, at 36%. Most would be happy with a gain, and it helps that the year's return is actually better than the average return over five years, which was 6%. It is possible that management foresight will bring growth well into the future, even if the share price slows down. It's always interesting to track share price performance over the longer term. But to understand Universal Display better, we need to consider many other factors. To that end, you should be aware of the 1 warning sign we've spotted with Universal Display .
本年度universal display的TSR與市場平均水平基本持平,爲36%。大多數人會對收益而感到滿意,事實上,本年度的回報實際上比過去五年的平均回報6%更好。管理層的遠見可能會帶來長期增長,即使股價放緩也是如此。 追蹤股價表現的長期情況總是很有趣。但要更好地了解universal display,我們需要考慮許多其他因素。爲此,您應該注意我們在universal display發現的1個警示標誌。
There are plenty of other companies that have insiders buying up shares. You probably do not want to miss this free list of undervalued small cap companies that insiders are buying.
還有很多其他的公司,公司的內部人士正在購買股票。你可能不想錯過這個免費的小市值公司的低估列表。
Please note, the market returns quoted in this article reflect the market weighted average returns of stocks that currently trade on American exchanges.
請注意,本文所引述的市場回報反映了目前在美國交易所上市的股票的市場加權平均回報。
Have feedback on this article? Concerned about the content? Get in touch with us directly. Alternatively, email editorial-team (at) simplywallst.com.
This article by Simply Wall St is general in nature. We provide commentary based on historical data and analyst forecasts only using an unbiased methodology and our articles are not intended to be financial advice. It does not constitute a recommendation to buy or sell any stock, and does not take account of your objectives, or your financial situation. We aim to bring you long-term focused analysis driven by fundamental data. Note that our analysis may not factor in the latest price-sensitive company announcements or qualitative material. Simply Wall St has no position in any stocks mentioned.
對本文有任何反饋?對內容有任何疑慮?請直接與我們聯繫。或者,發送電子郵件至editorial-team@simplywallst.com。
這篇文章是Simply Wall St的一般性文章。我們根據歷史數據和分析師預測提供評論,只使用公正的方法論,我們的文章並不意味着提供任何金融建議。文章不構成買賣任何股票的建議,也不考慮您的目標或您的財務狀況。我們的目標是帶給您基本數據驅動的長期關注分析。請注意,我們的分析可能不考慮最新的價格敏感公司公告或定性材料。Simply Wall St沒有任何股票頭寸。
譯文內容由第三人軟體翻譯。