
Are Robust Financials Driving The Recent Rally In Steel Dynamics, Inc.'s (NASDAQ:STLD) Stock?
Are Robust Financials Driving The Recent Rally In Steel Dynamics, Inc.'s (NASDAQ:STLD) Stock?
 Return on Equity = Net Profit (from continuing operations) ÷ Shareholders' Equity
 Steel Dynamics' (NASDAQ:STLD) stock is up by a considerable 5.4% over the past month. Since the market usually pay for a company's long-term fundamentals, we decided to study the company's key performance indicators to see if they could be influencing the market. In this article, we decided to focus on Steel Dynamics' ROE.
steel dynamics(納斯達克股票代碼:STLD)的股價在過去一個月內上漲了5.4%。由於市場通常會爲公司的長期基本面支付,我們決定研究該公司的關鍵績效指標,以查看它們是否可能會影響市場。在本文中,我們決定專注於steel dynamics的roe。
ROE or return on equity is a useful tool to assess how effectively a company can generate returns on the investment it received from its shareholders. In short, ROE shows the profit each dollar generates with respect to its shareholder investments.
roe或權益回報率是評估公司有效利用股東投資產生回報效率的有用工具。簡而言之,roe顯示每個股東投資所產生的利潤。
How To Calculate Return On Equity?
如何計算股東權益報酬率?
Return on equity can be calculated by using the formula:
股東權益報酬率可以使用以下公式計算:
Return on Equity = Net Profit (from continuing operations) ÷ Shareholders' Equity
淨資產收益率 = 淨利潤(從持續經營中獲得)÷ 股東權益
So, based on the above formula, the ROE for Steel Dynamics is:
所以,根據上述公式,Steel Dynamics的ROE爲:
22% = US$2.0b ÷ US$9.1b (Based on the trailing twelve months to June 2024).
22% = 20億美元 ÷ 91億美元(基於截至2024年6月的過去十二個月)。
The 'return' is the income the business earned over the last year. So, this means that for every $1 of its shareholder's investments, the company generates a profit of $0.22.
『回報』是企業過去一年所獲得的收入。這意味着對於每1美元的股東投資,該公司創造了0.22美元的利潤。
What Is The Relationship Between ROE And Earnings Growth?
ROE與盈利增長之間的關係是什麼?
So far, we've learned that ROE is a measure of a company's profitability. Depending on how much of these profits the company reinvests or "retains", and how effectively it does so, we are then able to assess a company's earnings growth potential. Generally speaking, other things being equal, firms with a high return on equity and profit retention, have a higher growth rate than firms that don't share these attributes.
迄今爲止,我們已經了解到roe是公司盈利能力的一種衡量方式。根據公司重新投資或保留這些利潤的數量,以及有效程度,我們能夠評估公司的盈利增長潛力。一般來說,其他條件相同的情況下,具有高roe和盈利保留能力的公司比沒有這些特徵的公司的增長率更高。
Steel Dynamics' Earnings Growth And 22% ROE
steel dynamics的收益增長和22%的roe
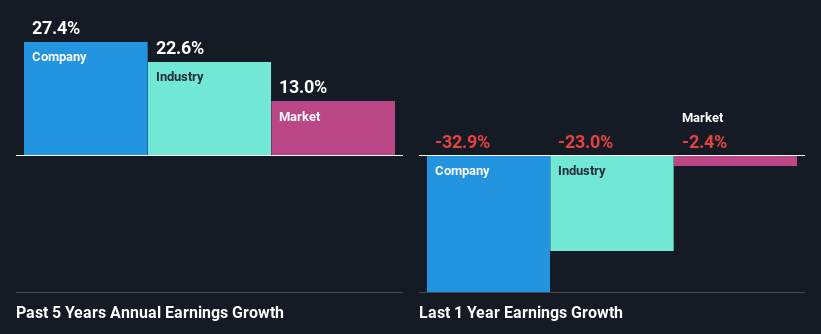
To start with, Steel Dynamics' ROE looks acceptable. Especially when compared to the industry average of 9.4% the company's ROE looks pretty impressive. Probably as a result of this, Steel Dynamics was able to see an impressive net income growth of 27% over the last five years. However, there could also be other causes behind this growth. For instance, the company has a low payout ratio or is being managed efficiently.
首先,Steel Dynamics的ROE看起來是可以接受的。特別是與行業平均水平9.4%相比,該公司的ROE看起來非常令人印象深刻。可能正是由於此,Steel Dynamics在過去五年裏能夠看到令人印象深刻的淨利潤增長27%。然而,這種增長背後也可能存在其他原因。例如,公司的派息比率較低或者管理得效率很高。
As a next step, we compared Steel Dynamics' net income growth with the industry, and pleasingly, we found that the growth seen by the company is higher than the average industry growth of 23%.
作爲下一步,我們將Steel Dynamics的淨利潤增長與行業進行了比較,令人高興的是,我們發現該公司的增長高於行業平均水平23%。
The basis for attaching value to a company is, to a great extent, tied to its earnings growth. It's important for an investor to know whether the market has priced in the company's expected earnings growth (or decline). This then helps them determine if the stock is placed for a bright or bleak future. If you're wondering about Steel Dynamics''s valuation, check out this gauge of its price-to-earnings ratio, as compared to its industry.
附加價值給一家公司的基礎,在很大程度上與其盈利增長相關。對於投資者來說,了解市場是否已經反映了公司預期的盈利增長(或下降)非常重要。這有助於他們判斷股票是走向光明還是暗淡的未來。如果您想了解steel dynamics的估值,請查看其市盈率的情況,並與其所處行業進行比較。
Is Steel Dynamics Using Its Retained Earnings Effectively?
Steel Dynamics是否有效利用留存收益?
Steel Dynamics has a really low three-year median payout ratio of 8.9%, meaning that it has the remaining 91% left over to reinvest into its business. This suggests that the management is reinvesting most of the profits to grow the business as evidenced by the growth seen by the company.
steel dynamics 的三年中位數償付比率非常低,爲8.9%,這意味着公司剩餘的91%可用於再投資到其業務中。這表明管理層將大部分利潤再投資到業務中,正如公司所見的增長所證明的那樣。
Additionally, Steel Dynamics has paid dividends over a period of at least ten years which means that the company is pretty serious about sharing its profits with shareholders. Our latest analyst data shows that the future payout ratio of the company is expected to rise to 17% over the next three years. Accordingly, the expected increase in the payout ratio explains the expected decline in the company's ROE to 15%, over the same period.
此外,Steel Dynamics在至少十年的時間內支付了股息,這意味着該公司非常重視與股東分享利潤。我們最新的分析師數據顯示,公司未來的支付比率預計將在未來三年內上升到17%。因此,支付比率預期增加解釋了同期公司roe預期下降至15%的情況。
Summary
總的來說,我們對偉明環保的表現非常滿意。具體而言,我們喜歡公司以高回報率再投資了其利潤的很大一部分。當然,這導致公司的收益大幅增長。但是,最新的行業分析師預測表明,該公司的收益預計將加速增長。
Overall, we are quite pleased with Steel Dynamics' performance. Specifically, we like that the company is reinvesting a huge chunk of its profits at a high rate of return. This of course has caused the company to see substantial growth in its earnings. With that said, on studying the latest analyst forecasts, we found that while the company has seen growth in its past earnings, analysts expect its future earnings to shrink. To know more about the latest analysts predictions for the company, check out this visualization of analyst forecasts for the company.
總體而言,我們對steel dynamics的表現感到非常滿意。具體來說,我們喜歡這家公司以高回報率再投資其巨額利潤。當然,這導致公司的收入出現了實質性增長。話雖如此,在研究最新的分析師預測時,我們發現儘管公司過去的收入有所增長,但分析師們預計未來的收入將會減少。要了解更多關於該公司的最新分析師預測,請查看這份關於公司分析師預測的可視化。
Have feedback on this article? Concerned about the content? Get in touch with us directly. Alternatively, email editorial-team (at) simplywallst.com.
This article by Simply Wall St is general in nature. We provide commentary based on historical data and analyst forecasts only using an unbiased methodology and our articles are not intended to be financial advice. It does not constitute a recommendation to buy or sell any stock, and does not take account of your objectives, or your financial situation. We aim to bring you long-term focused analysis driven by fundamental data. Note that our analysis may not factor in the latest price-sensitive company announcements or qualitative material. Simply Wall St has no position in any stocks mentioned.
對本文有任何反饋?對內容有任何疑慮?請直接與我們聯繫。或者,發送電子郵件至editorial-team@simplywallst.com。
這篇文章是Simply Wall St的一般性文章。我們根據歷史數據和分析師預測提供評論,只使用公正的方法論,我們的文章並不意味着提供任何金融建議。文章不構成買賣任何股票的建議,也不考慮您的目標或您的財務狀況。我們的目標是帶給您基本數據驅動的長期關注分析。請注意,我們的分析可能不考慮最新的價格敏感公司公告或定性材料。Simply Wall St沒有任何股票頭寸。
譯文內容由第三人軟體翻譯。