
OneMain Holdings' (NYSE:OMF) Earnings Growth Rate Lags the 19% CAGR Delivered to Shareholders
OneMain Holdings' (NYSE:OMF) Earnings Growth Rate Lags the 19% CAGR Delivered to Shareholders
 Over half a decade, OneMain Holdings managed to grow its earnings per share at 0.02% a year. This EPS growth is slower than the share price growth of 6% per year, over the same period. This suggests that market participants hold the company in higher regard, these days. And that's hardly shocking given the track record of growth.
 When you buy and hold a stock for the long term, you definitely want it to provide a positive return. But more than that, you probably want to see it rise more than the market average. But OneMain Holdings, Inc. (NYSE:OMF) has fallen short of that second goal, with a share price rise of 34% over five years, which is below the market return. But if you include dividends then the return is market-beating. Zooming in, the stock is up a respectable 19% in the last year.
當您長揸股票時,您肯定希望它能夠提供正收益。但更重要的是,您可能希望看到其漲幅超過市場平均水平。但是onemain控股公司(NYSE:OMF)並沒有達到第二個目標,過去五年股價上漲了34%,低於市場回報。但如果考慮分紅派息,那麼回報就超過了市場。具體來看,該股過去一年上漲了可觀的19%。
While this past week has detracted from the company's five-year return, let's look at the recent trends of the underlying business and see if the gains have been in alignment.
雖然過去的一週削弱了公司的五年回報,但讓我們看看業務的最近趨勢,並查看收益是否已對齊。
While markets are a powerful pricing mechanism, share prices reflect investor sentiment, not just underlying business performance. One way to examine how market sentiment has changed over time is to look at the interaction between a company's share price and its earnings per share (EPS).
儘管市場是一個強大的價格機制,但股票價格反映的不僅是潛在業務績效,還反映了投資者的情緒。 了解市場情緒隨時間的變化的一種方法是查看公司的股價與每股收益(EPS)之間的互動。
Over half a decade, OneMain Holdings managed to grow its earnings per share at 0.02% a year. This EPS growth is slower than the share price growth of 6% per year, over the same period. This suggests that market participants hold the company in higher regard, these days. And that's hardly shocking given the track record of growth.
在半個多世紀的時間裏,onemain控股公司成功將每股收益增長率控制在每年0.02%。這種每股收益增長速度低於同期每年6%的股價增長速度。這表明市場參與者現在更看好這家公司。考慮到其增長記錄,這並不奇怪。
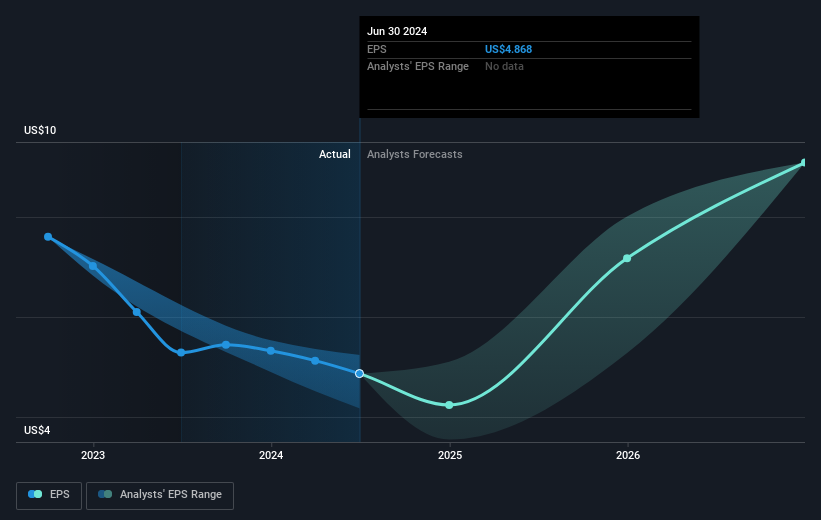
The graphic below depicts how EPS has changed over time (unveil the exact values by clicking on the image).
下圖顯示了EPS隨時間變化的情況(點擊圖像以顯示確切值)。
It might be well worthwhile taking a look at our free report on OneMain Holdings' earnings, revenue and cash flow.
值得詳細查看我們關於OneMain Holdings的收益、營業收入和現金流的免費報告。
What About Dividends?
那麼分紅怎麼樣呢?
It is important to consider the total shareholder return, as well as the share price return, for any given stock. The TSR is a return calculation that accounts for the value of cash dividends (assuming that any dividend received was reinvested) and the calculated value of any discounted capital raisings and spin-offs. It's fair to say that the TSR gives a more complete picture for stocks that pay a dividend. We note that for OneMain Holdings the TSR over the last 5 years was 143%, which is better than the share price return mentioned above. This is largely a result of its dividend payments!
對於任何股票,考慮總股東回報以及股價回報至關重要。TSR是一種回報計算,考慮了現金分紅的價值(假設任何分紅均已再投資),以及任何折現資本籌集和拆分的計算價值。可以說,TSR爲支付股息的股票提供了更完整的圖片。我們注意到,OneMain Holdings過去5年的TSR爲143%,優於上述股價回報。這在很大程度上是其分紅支付的結果!
A Different Perspective
不同的觀點
OneMain Holdings provided a TSR of 31% over the last twelve months. Unfortunately this falls short of the market return. On the bright side, that's still a gain, and it's actually better than the average return of 19% over half a decade This suggests the company might be improving over time. I find it very interesting to look at share price over the long term as a proxy for business performance. But to truly gain insight, we need to consider other information, too. Like risks, for instance. Every company has them, and we've spotted 2 warning signs for OneMain Holdings (of which 1 doesn't sit too well with us!) you should know about.
過去十二個月,OneMain Holdings提供了31%的TSR。不幸的是,這低於市場回報。但值得一提的是,這仍然是一項收益,並且實際上比半個世紀以來的平均回報19%更好。這表明公司可能隨着時間的推移而改善。我發現長期觀察股價作爲業務表現的一種代理很有趣。但要真正獲得見解,我們還需要考慮其他信息。比如風險。每家公司都有風險,我們已經發現OneMain Holdings的2個警示信號(其中1個讓我們不太滿意!)你應該知道。
For those who like to find winning investments this free list of undervalued companies with recent insider purchasing, could be just the ticket.
對於那些喜歡尋找獲勝投資的人來說,最近有內部購買的低估公司免費列表可能是一個很好的選擇。
Please note, the market returns quoted in this article reflect the market weighted average returns of stocks that currently trade on American exchanges.
請注意,本文所引述的市場回報反映了目前在美國交易所上市的股票的市場加權平均回報。
Have feedback on this article? Concerned about the content? Get in touch with us directly. Alternatively, email editorial-team (at) simplywallst.com.
This article by Simply Wall St is general in nature. We provide commentary based on historical data and analyst forecasts only using an unbiased methodology and our articles are not intended to be financial advice. It does not constitute a recommendation to buy or sell any stock, and does not take account of your objectives, or your financial situation. We aim to bring you long-term focused analysis driven by fundamental data. Note that our analysis may not factor in the latest price-sensitive company announcements or qualitative material. Simply Wall St has no position in any stocks mentioned.
對本文有任何反饋?對內容有任何疑慮?請直接與我們聯繫。或者,發送電子郵件至editorial-team@simplywallst.com。
這篇文章是Simply Wall St的一般性文章。我們根據歷史數據和分析師預測提供評論,只使用公正的方法論,我們的文章並不意味着提供任何金融建議。文章不構成買賣任何股票的建議,也不考慮您的目標或您的財務狀況。我們的目標是帶給您基本數據驅動的長期關注分析。請注意,我們的分析可能不考慮最新的價格敏感公司公告或定性材料。Simply Wall St沒有任何股票頭寸。
譯文內容由第三人軟體翻譯。