
Investing in Church & Dwight (NYSE:CHD) Five Years Ago Would Have Delivered You a 46% Gain
Investing in Church & Dwight (NYSE:CHD) Five Years Ago Would Have Delivered You a 46% Gain
 Over half a decade, Church & Dwight managed to grow its earnings per share at 6.0% a year. So the EPS growth rate is rather close to the annualized share price gain of 7% per year. This indicates that investor sentiment towards the company has not changed a great deal. Indeed, it would appear the share price is reacting to the EPS.
 The main point of investing for the long term is to make money. But more than that, you probably want to see it rise more than the market average. But Church & Dwight Co., Inc. (NYSE:CHD) has fallen short of that second goal, with a share price rise of 37% over five years, which is below the market return. Over the last twelve months the stock price has risen a very respectable 10%.
長期投資的主要目的是賺錢。 但更重要的是,您可能希望看到股價上漲超過市場平均水平。但是,Church & Dwight Co., Inc.(紐交所:CHD)未能實現第二個目標,其股價在五年內上漲了37%,低於市場回報率。過去十二個月,股價上漲了非常可觀的10%。
Now it's worth having a look at the company's fundamentals too, because that will help us determine if the long term shareholder return has matched the performance of the underlying business.
現在值得更詳細地了解該公司的基本面,因爲這將幫助我們判斷長期股東回報是否與基礎業務的表現相匹配。
In his essay The Superinvestors of Graham-and-Doddsville Warren Buffett described how share prices do not always rationally reflect the value of a business. One imperfect but simple way to consider how the market perception of a company has shifted is to compare the change in the earnings per share (EPS) with the share price movement.
禾倫·巴菲特在他的文章《格雷厄姆與多德維爾的超級投資者》中描述了股票價格並不總是合理地反映了一家企業的價值。考慮市場對一家公司的看法如何轉變的一種不完美但簡單的方法,是將每股收益(EPS)的變化與股價的動態進行比較。
Over half a decade, Church & Dwight managed to grow its earnings per share at 6.0% a year. So the EPS growth rate is rather close to the annualized share price gain of 7% per year. This indicates that investor sentiment towards the company has not changed a great deal. Indeed, it would appear the share price is reacting to the EPS.
在半個多世紀的時間裏,Church & Dwight設法以每年6.0%的速度增長其每股收益。因此,每股收益增長率與每年7%的股價年化增長率相當接近。這表明投資者對該公司的情緒並沒有發生很大的變化。事實上,股價似乎正在對每股收益做出反應。
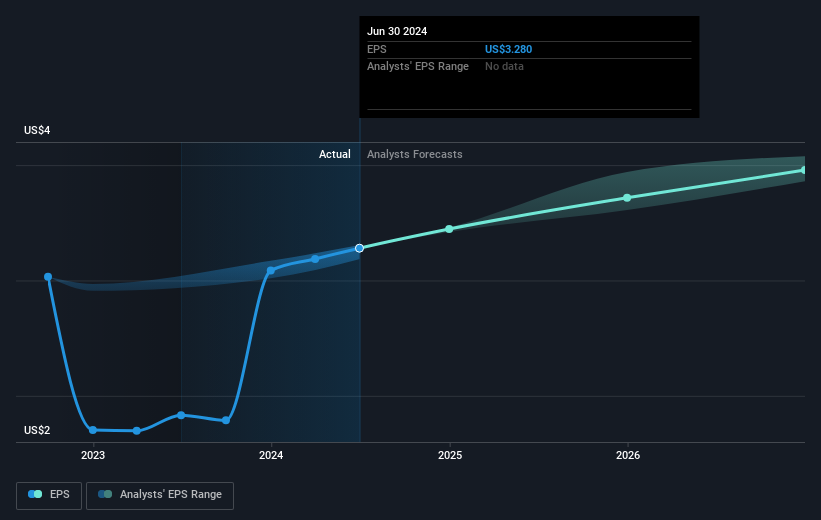
You can see how EPS has changed over time in the image below (click on the chart to see the exact values).
您可以在下面的圖片中查看每股收益如何隨時間變化(單擊圖表以查看確切的價值)。
We know that Church & Dwight has improved its bottom line lately, but is it going to grow revenue? If you're interested, you could check this free report showing consensus revenue forecasts.
我們知道Church & Dwight最近改善了底線,但它是否會增長營業收入?如果您感興趣,您可以查看這份免費報告,顯示共識營業收入預測。
What About Dividends?
那麼分紅怎麼樣呢?
When looking at investment returns, it is important to consider the difference between total shareholder return (TSR) and share price return. The TSR is a return calculation that accounts for the value of cash dividends (assuming that any dividend received was reinvested) and the calculated value of any discounted capital raisings and spin-offs. Arguably, the TSR gives a more comprehensive picture of the return generated by a stock. As it happens, Church & Dwight's TSR for the last 5 years was 46%, which exceeds the share price return mentioned earlier. The dividends paid by the company have thusly boosted the total shareholder return.
在考慮投資回報時,重要的是要考慮總股東回報(TSR)與股價回報之間的差異。TSR是一種回報計算,考慮了現金分紅的價值(假設任何收到的股息都被再投資)以及任何折價資本籌集和拆股的計算價值。可以說TSR給出了股票產生的回報更全面的圖景。事實上,Church & Dwight過去5年的TSR爲46%,超過了之前提到的股價回報。公司支付的股息因此提升了總股東回報。
A Different Perspective
不同的觀點
Church & Dwight provided a TSR of 11% over the last twelve months. But that was short of the market average. The silver lining is that the gain was actually better than the average annual return of 8% per year over five year. This suggests the company might be improving over time. Most investors take the time to check the data on insider transactions. You can click here to see if insiders have been buying or selling.
Church & Dwight在過去十二個月提供了11%的TSR。但這還不及市場平均水平。值得慶幸的是,這個收益實際上比過去五年每年8%的平均回報要好。這表明該公司可能隨着時間的推移而改善。大多數投資者會花時間檢查內部交易數據。您可以點擊這裏查看內部人員是否一直在買賣。
If you like to buy stocks alongside management, then you might just love this free list of companies. (Hint: many of them are unnoticed AND have attractive valuation).
如果您喜歡與管理層一起購買股票,那麼您可能會喜歡這個公司的免費列表。 (提示:其中許多公司不爲人注意且具有吸引力的估值。)
Please note, the market returns quoted in this article reflect the market weighted average returns of stocks that currently trade on American exchanges.
請注意,本文所引述的市場回報反映了目前在美國交易所上市的股票的市場加權平均回報。
Have feedback on this article? Concerned about the content? Get in touch with us directly. Alternatively, email editorial-team (at) simplywallst.com.
This article by Simply Wall St is general in nature. We provide commentary based on historical data and analyst forecasts only using an unbiased methodology and our articles are not intended to be financial advice. It does not constitute a recommendation to buy or sell any stock, and does not take account of your objectives, or your financial situation. We aim to bring you long-term focused analysis driven by fundamental data. Note that our analysis may not factor in the latest price-sensitive company announcements or qualitative material. Simply Wall St has no position in any stocks mentioned.
對本文有任何反饋?對內容有任何疑慮?請直接與我們聯繫。或者,發送電子郵件至editorial-team@simplywallst.com。
這篇文章是Simply Wall St的一般性文章。我們根據歷史數據和分析師預測提供評論,只使用公正的方法論,我們的文章並不意味着提供任何金融建議。文章不構成買賣任何股票的建議,也不考慮您的目標或您的財務狀況。我們的目標是帶給您基本數據驅動的長期關注分析。請注意,我們的分析可能不考慮最新的價格敏感公司公告或定性材料。Simply Wall St沒有任何股票頭寸。
譯文內容由第三人軟體翻譯。