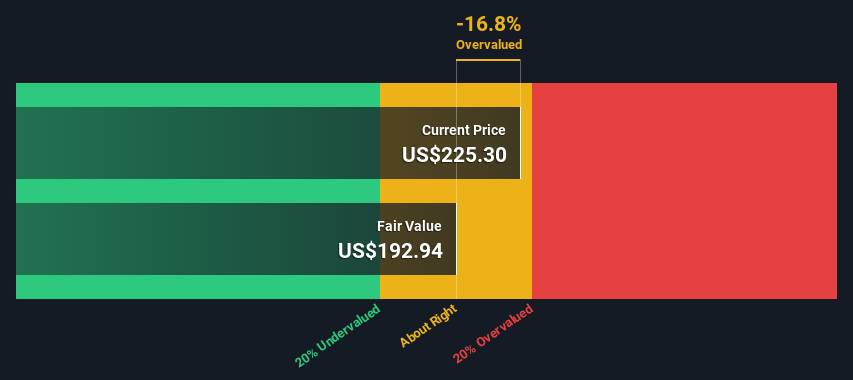
The projected fair value for CDW is US$193 based on 2 Stage Free Cash Flow to Equity
Current share price of US$225 suggests CDW is potentially trading close to its fair value
Our fair value estimate is 23% lower than CDW's analyst price target of US$250
In this article we are going to estimate the intrinsic value of CDW Corporation (NASDAQ:CDW) by taking the forecast future cash flows of the company and discounting them back to today's value. This will be done using the Discounted Cash Flow (DCF) model. There's really not all that much to it, even though it might appear quite complex.
We generally believe that a company's value is the present value of all of the cash it will generate in the future. However, a DCF is just one valuation metric among many, and it is not without flaws. If you want to learn more about discounted cash flow, the rationale behind this calculation can be read in detail in the Simply Wall St analysis model.
What's The Estimated Valuation?
We are going to use a two-stage DCF model, which, as the name states, takes into account two stages of growth. The first stage is generally a higher growth period which levels off heading towards the terminal value, captured in the second 'steady growth' period. In the first stage we need to estimate the cash flows to the business over the next ten years. Where possible we use analyst estimates, but when these aren't available we extrapolate the previous free cash flow (FCF) from the last estimate or reported value. We assume companies with shrinking free cash flow will slow their rate of shrinkage, and that companies with growing free cash flow will see their growth rate slow, over this period. We do this to reflect that growth tends to slow more in the early years than it does in later years.
A DCF is all about the idea that a dollar in the future is less valuable than a dollar today, so we discount the value of these future cash flows to their estimated value in today's dollars:
10-year free cash flow (FCF) forecast
2025
2026
2027
2028
2029
2030
2031
2032
2033
2034
Levered FCF ($, Millions)
US$1.28b
US$1.36b
US$1.36b
US$1.38b
US$1.40b
US$1.43b
US$1.45b
US$1.49b
US$1.52b
US$1.56b
Growth Rate Estimate Source
Analyst x2
Analyst x2
Est @ 0.50%
Est @ 1.10%
Est @ 1.52%
Est @ 1.81%
Est @ 2.02%
Est @ 2.16%
Est @ 2.26%
Est @ 2.33%
Present Value ($, Millions) Discounted @ 7.4%
US$1.2k
US$1.2k
US$1.1k
US$1.0k
US$981
US$930
US$884
US$841
US$801
US$763
("Est" = FCF growth rate estimated by Simply Wall St) Present Value of 10-year Cash Flow (PVCF) = US$9.7b
After calculating the present value of future cash flows in the initial 10-year period, we need to calculate the Terminal Value, which accounts for all future cash flows beyond the first stage. For a number of reasons a very conservative growth rate is used that cannot exceed that of a country's GDP growth. In this case we have used the 5-year average of the 10-year government bond yield (2.5%) to estimate future growth. In the same way as with the 10-year 'growth' period, we discount future cash flows to today's value, using a cost of equity of 7.4%.
Present Value of Terminal Value (PVTV)= TV / (1 + r)10= US$33b÷ ( 1 + 7.4%)10= US$16b
The total value is the sum of cash flows for the next ten years plus the discounted terminal value, which results in the Total Equity Value, which in this case is US$26b. The last step is to then divide the equity value by the number of shares outstanding. Compared to the current share price of US$225, the company appears around fair value at the time of writing. Remember though, that this is just an approximate valuation, and like any complex formula - garbage in, garbage out.
NasdaqGS:CDW Discounted Cash Flow September 22nd 2024
Important Assumptions
The calculation above is very dependent on two assumptions. The first is the discount rate and the other is the cash flows. You don't have to agree with these inputs, I recommend redoing the calculations yourself and playing with them. The DCF also does not consider the possible cyclicality of an industry, or a company's future capital requirements, so it does not give a full picture of a company's potential performance. Given that we are looking at CDW as potential shareholders, the cost of equity is used as the discount rate, rather than the cost of capital (or weighted average cost of capital, WACC) which accounts for debt. In this calculation we've used 7.4%, which is based on a levered beta of 1.183. Beta is a measure of a stock's volatility, compared to the market as a whole. We get our beta from the industry average beta of globally comparable companies, with an imposed limit between 0.8 and 2.0, which is a reasonable range for a stable business.
SWOT Analysis for CDW
Strength
Earnings growth over the past year exceeded the industry.
Debt is well covered by earnings and cashflows.
Dividends are covered by earnings and cash flows.
Dividend information for CDW.
Weakness
Earnings growth over the past year is below its 5-year average.
Dividend is low compared to the top 25% of dividend payers in the Electronic market.
Expensive based on P/E ratio and estimated fair value.
Opportunity
Annual earnings are forecast to grow for the next 3 years.
Threat
Annual earnings are forecast to grow slower than the American market.
What else are analysts forecasting for CDW?
Moving On:
Although the valuation of a company is important, it ideally won't be the sole piece of analysis you scrutinize for a company. The DCF model is not a perfect stock valuation tool. Instead the best use for a DCF model is to test certain assumptions and theories to see if they would lead to the company being undervalued or overvalued. If a company grows at a different rate, or if its cost of equity or risk free rate changes sharply, the output can look very different. For CDW, we've put together three relevant factors you should explore:
Risks: Every company has them, and we've spotted 1 warning sign for CDW you should know about.
Management:Have insiders been ramping up their shares to take advantage of the market's sentiment for CDW's future outlook? Check out our management and board analysis with insights on CEO compensation and governance factors.
Other Solid Businesses: Low debt, high returns on equity and good past performance are fundamental to a strong business. Why not explore our interactive list of stocks with solid business fundamentals to see if there are other companies you may not have considered!
PS. Simply Wall St updates its DCF calculation for every American stock every day, so if you want to find the intrinsic value of any other stock just search here.
Have feedback on this article? Concerned about the content?Get in touch with us directly. Alternatively, email editorial-team (at) simplywallst.com. This article by Simply Wall St is general in nature. We provide commentary based on historical data and analyst forecasts only using an unbiased methodology and our articles are not intended to be financial advice. It does not constitute a recommendation to buy or sell any stock, and does not take account of your objectives, or your financial situation. We aim to bring you long-term focused analysis driven by fundamental data. Note that our analysis may not factor in the latest price-sensitive company announcements or qualitative material. Simply Wall St has no position in any stocks mentioned.

 A DCF is all about the idea that a dollar in the future is less valuable than a dollar today, so we discount the value of these future cash flows to their estimated value in today's dollars:
  DCF的核心理念是未來的一美元價值不如現在的一美元,因此我們將這些未來現金流折現至今天的價值: