
Genpact (NYSE:G) Might Have The Makings Of A Multi-Bagger
Genpact (NYSE:G) Might Have The Makings Of A Multi-Bagger
 0.16 = US$656m ÷ (US$5.2b - US$1.2b)
 Did you know there are some financial metrics that can provide clues of a potential multi-bagger? Ideally, a business will show two trends; firstly a growing return on capital employed (ROCE) and secondly, an increasing amount of capital employed. Put simply, these types of businesses are compounding machines, meaning they are continually reinvesting their earnings at ever-higher rates of return. So when we looked at Genpact (NYSE:G) and its trend of ROCE, we really liked what we saw.
您知道有些財務指標可以提供潛在暴利的線索嗎?理想情況下,一家企業將展示兩種趨勢;首先是資本回報率(ROCE)不斷增長,其次是越來越多的資本參與。簡單來說,這些類型的企業是複利機器,意味着他們不斷以更高的回報率重新投資他們的收益。所以當我們看到Genpact(紐交所:G)及其ROCE趨勢時,我們真的很喜歡我們看到的。
What Is Return On Capital Employed (ROCE)?
我們對 Enphase Energy 的資本僱用回報率的看法:正如我們上面看到的,Enphase Energy 的資本回報率沒有提高,但它正在重新投資於業務。投資者必須認爲未來會有更好的前景,因爲股票表現良好,使持股五年以上的股東獲得了 690% 的收益。最終,如果基本趨勢持續存在,我們不會對它成爲一隻多頭股持有期很久很有信心。
For those who don't know, ROCE is a measure of a company's yearly pre-tax profit (its return), relative to the capital employed in the business. To calculate this metric for Genpact, this is the formula:
對於那些不了解的人,ROCE是公司每年稅前利潤(其回報)與企業投入資本相關的衡量標準。要爲Genpact計算這個指標,這是公式:
Return on Capital Employed = Earnings Before Interest and Tax (EBIT) ÷ (Total Assets - Current Liabilities)
資產僱用回報率(ROCE)是指企業利潤,即企業稅前利潤除以企業投入的總資本(負債加股權)。如果ROCE高於企業財務成本的承受能力,那麼企業就會創造出更多的價值。
0.16 = US$656m ÷ (US$5.2b - US$1.2b) (Based on the trailing twelve months to June 2024).
0.16 = 65600萬美元 ÷ (520億美元 - 12億美元)(截至2024年6月底的過去十二個月)。
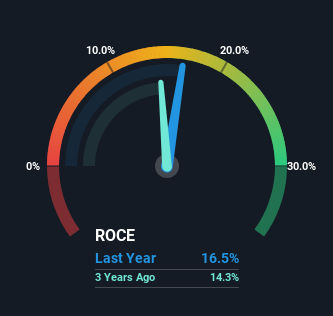
So, Genpact has an ROCE of 16%. In absolute terms, that's a pretty normal return, and it's somewhat close to the Professional Services industry average of 14%.
所以,Genpact的ROCE爲16%。在絕對值上,這是一個相當正常的回報,而且它與專業服務行業平均水平14%相當接近。
In the above chart we have measured Genpact's prior ROCE against its prior performance, but the future is arguably more important. If you're interested, you can view the analysts predictions in our free analyst report for Genpact .
在上面的圖表中,我們已經測量了簡伯特以前的資本回報率與其以往業績,但未來可能更重要。如果您有興趣,您可以查看我們免費的簡伯特分析師報告中的分析師預測。
What Can We Tell From Genpact's ROCE Trend?
從簡伯特的ROCE趨勢中我們可以得出什麼結論?
We like the trends that we're seeing from Genpact. Over the last five years, returns on capital employed have risen substantially to 16%. The company is effectively making more money per dollar of capital used, and it's worth noting that the amount of capital has increased too, by 32%. This can indicate that there's plenty of opportunities to invest capital internally and at ever higher rates, a combination that's common among multi-baggers.
我們喜歡看到簡伯特的這些趨勢。在過去五年中,資本利用率的回報率已大幅提高至16%。公司有效地每投入一美元的資本就賺取更多錢,值得注意的是,資本金額也增加了32%。這可能表明公司內部有很多投資資本的機會,並且投資回報率也越來越高,這種組合在多倍股中很常見。
The Bottom Line On Genpact's ROCE
簡伯特資本回報率的底線
A company that is growing its returns on capital and can consistently reinvest in itself is a highly sought after trait, and that's what Genpact has. Investors may not be impressed by the favorable underlying trends yet because over the last five years the stock has only returned 7.7% to shareholders. So with that in mind, we think the stock deserves further research.
一個不斷提高資本回報率並能持續再投資的公司是一個備受追捧的特質,而這正是簡伯特所具備的。投資者可能對這些有利的基本趨勢尚不滿意,因爲過去五年股票僅爲股東帶來了7.7%的回報。因此,考慮到這一點,我們認爲這支股票值得進一步研究。
Genpact does come with some risks though, we found 2 warning signs in our investment analysis, and 1 of those is significant...
然而,簡伯特的確存在一些風險,我們在投資分析中發現了2個警告信號,其中一個是相當重要的...
While Genpact isn't earning the highest return, check out this free list of companies that are earning high returns on equity with solid balance sheets.
雖然簡伯特的回報率並不是最高的,請查看這份免費名單,其中列出了具有穩健資產負債表並具有高權益回報率的公司。
Have feedback on this article? Concerned about the content? Get in touch with us directly. Alternatively, email editorial-team (at) simplywallst.com.
This article by Simply Wall St is general in nature. We provide commentary based on historical data and analyst forecasts only using an unbiased methodology and our articles are not intended to be financial advice. It does not constitute a recommendation to buy or sell any stock, and does not take account of your objectives, or your financial situation. We aim to bring you long-term focused analysis driven by fundamental data. Note that our analysis may not factor in the latest price-sensitive company announcements or qualitative material. Simply Wall St has no position in any stocks mentioned.
對本文有任何反饋?對內容有任何疑慮?請直接與我們聯繫。或者,發送電子郵件至editorial-team@simplywallst.com。
這篇文章是Simply Wall St的一般性文章。我們根據歷史數據和分析師預測提供評論,只使用公正的方法論,我們的文章並不意味着提供任何金融建議。文章不構成買賣任何股票的建議,也不考慮您的目標或您的財務狀況。我們的目標是帶給您基本數據驅動的長期關注分析。請注意,我們的分析可能不考慮最新的價格敏感公司公告或定性材料。Simply Wall St沒有任何股票頭寸。
譯文內容由第三人軟體翻譯。