
Cactus (NYSE:WHD) Stock Performs Better Than Its Underlying Earnings Growth Over Last Five Years
Cactus (NYSE:WHD) Stock Performs Better Than Its Underlying Earnings Growth Over Last Five Years
 Over half a decade, Cactus managed to grow its earnings per share at 6.7% a year. This EPS growth is lower than the 16% average annual increase in the share price. This suggests that market participants hold the company in higher regard, these days. And that's hardly shocking given the track record of growth.
 When you buy a stock there is always a possibility that it could drop 100%. But on a lighter note, a good company can see its share price rise well over 100%. For example, the Cactus, Inc. (NYSE:WHD) share price has soared 114% in the last half decade. Most would be very happy with that. It's also good to see the share price up 25% over the last quarter.
當您購買股票時,始終存在股價可能下跌100%的可能性。但更令人振奮的是,一家優秀的公司的股價可能會上漲超過100%。例如,Cactus, Inc.(紐交所:WHD)的股價在過去五年中飆升了114%。大多數人對此應該會感到非常高興。同時,股價在過去一個季度上漲了25%,也是個好跡象。
After a strong gain in the past week, it's worth seeing if longer term returns have been driven by improving fundamentals.
在過去的一週之內,獲得的強勁收益是否表明了長期回報受到基本面的推動值得關注。
To paraphrase Benjamin Graham: Over the short term the market is a voting machine, but over the long term it's a weighing machine. One flawed but reasonable way to assess how sentiment around a company has changed is to compare the earnings per share (EPS) with the share price.
引用本傑明·格雷厄姆的話:短期內市場是一個投票機,但長期來看它是一個稱重機。評估公司周邊環境的情緒變化的一種有缺陷但合理的方法是將每股收益(EPS)與股價進行比較。
Over half a decade, Cactus managed to grow its earnings per share at 6.7% a year. This EPS growth is lower than the 16% average annual increase in the share price. This suggests that market participants hold the company in higher regard, these days. And that's hardly shocking given the track record of growth.
在過去半個世紀,Cactus成功地將每股收益增長率維持在6.7%。這一每股收益增長率低於股價每年平均增長16%的水平。這表明市場參與者如今更看好該公司。考慮到其增長記錄,這並不令人意外。
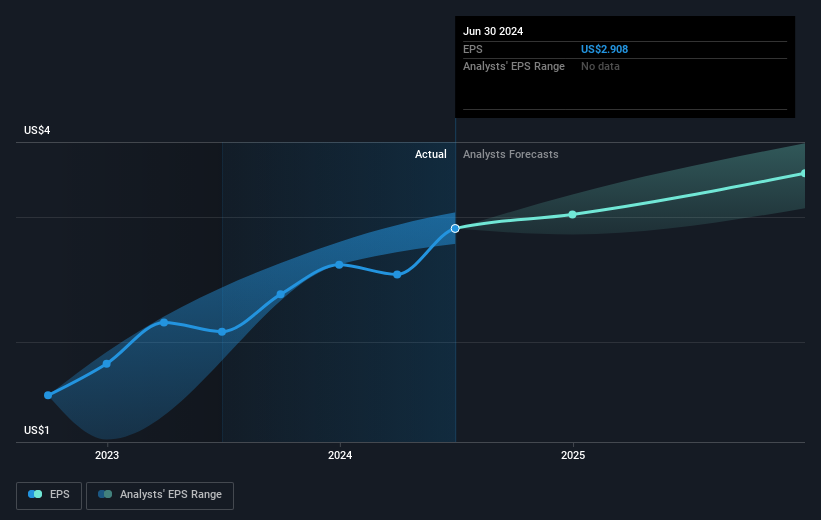
The graphic below depicts how EPS has changed over time (unveil the exact values by clicking on the image).
下圖顯示了EPS隨時間變化的情況(點擊圖像以顯示確切值)。
We're pleased to report that the CEO is remunerated more modestly than most CEOs at similarly capitalized companies. It's always worth keeping an eye on CEO pay, but a more important question is whether the company will grow earnings throughout the years. It might be well worthwhile taking a look at our free report on Cactus' earnings, revenue and cash flow.
我們很高興地報告,該CEO的報酬比大多數同等市值公司的CEO更爲適度。關注CEO的薪酬總是值得的,但更重要的問題是這家公司是否能夠在多年來實現盈利增長。建議您閱讀我們關於Cactus盈利、營業收入和現金流的免費報告,這可能會很有價值。
What About Dividends?
那麼分紅怎麼樣呢?
It is important to consider the total shareholder return, as well as the share price return, for any given stock. The TSR incorporates the value of any spin-offs or discounted capital raisings, along with any dividends, based on the assumption that the dividends are reinvested. It's fair to say that the TSR gives a more complete picture for stocks that pay a dividend. We note that for Cactus the TSR over the last 5 years was 127%, which is better than the share price return mentioned above. And there's no prize for guessing that the dividend payments largely explain the divergence!
對於任何給定的股票來說,考慮到股東總回報和股價回報都非常重要。TSR包括在假設股息再投資的情況下,任何股份拆分或折價增資的價值以及任何股息。可以說,TSR給出了那些支付股息的股票更全面的圖片。我們注意到,對於Cactus而言,過去5年的TSR爲127%,比上述股價回報要好。而且毫無疑問,股息支付在很大程度上解釋了這種差異!
A Different Perspective
不同的觀點
Cactus provided a TSR of 32% over the year (including dividends). That's fairly close to the broader market return. That gain looks pretty satisfying, and it is even better than the five-year TSR of 18% per year. It is possible that management foresight will bring growth well into the future, even if the share price slows down. Before spending more time on Cactus it might be wise to click here to see if insiders have been buying or selling shares.
Cactus在過去一年裏提供了32%的TSR(包括股息)。這個收益與整體市場回報相當接近。這個增長看起來令人滿意,並且比過去五年的年均TSR 18%更好。即使股價放緩,管理層的預見有可能帶來未來的增長。在進一步關注Cactus之前,點擊這裏查看內部人是否一直在買賣股票可能會很明智。
For those who like to find winning investments this free list of undervalued companies with recent insider purchasing, could be just the ticket.
對於那些喜歡尋找獲勝投資的人來說,最近有內部購買的低估公司免費列表可能是一個很好的選擇。
Please note, the market returns quoted in this article reflect the market weighted average returns of stocks that currently trade on American exchanges.
請注意,本文所引述的市場回報反映了目前在美國交易所上市的股票的市場加權平均回報。
Have feedback on this article? Concerned about the content? Get in touch with us directly. Alternatively, email editorial-team (at) simplywallst.com.
This article by Simply Wall St is general in nature. We provide commentary based on historical data and analyst forecasts only using an unbiased methodology and our articles are not intended to be financial advice. It does not constitute a recommendation to buy or sell any stock, and does not take account of your objectives, or your financial situation. We aim to bring you long-term focused analysis driven by fundamental data. Note that our analysis may not factor in the latest price-sensitive company announcements or qualitative material. Simply Wall St has no position in any stocks mentioned.
對本文有任何反饋?對內容有任何疑慮?請直接與我們聯繫。或者,發送電子郵件至editorial-team@simplywallst.com。
這篇文章是Simply Wall St的一般性文章。我們根據歷史數據和分析師預測提供評論,只使用公正的方法論,我們的文章並不意味着提供任何金融建議。文章不構成買賣任何股票的建議,也不考慮您的目標或您的財務狀況。我們的目標是帶給您基本數據驅動的長期關注分析。請注意,我們的分析可能不考慮最新的價格敏感公司公告或定性材料。Simply Wall St沒有任何股票頭寸。
譯文內容由第三人軟體翻譯。