

Unemployment data strengthened.But after the bursting of the internet bubble and the Fed's rate cut in 2001, the ROI dropped by more than 10%.Confidence; the immediate trend of the market after the Fed announces a rate cut is often unstable and irrational; since Powell took office, the stock market usually falls in the last hour of trading on Fed decision days; market maker fund flow analysis shows that the S&P was supported at 5700 on Thursday, mostly driven by zero DTE positions.
On Thursday, the major US stock indices, which had dramatically declined after a significant rate cut by the Federal Reserve, rebounded strongly. $S&P 500 Index (.SPX.US)$ and $Dow Jones Industrial Average (.DJI.US)$ Simultaneously hitting historical intraday highs, the S&P rose over 2% at its peak, and the Dow rose by nearly 660 points, or almost 1.6%. $Nasdaq Composite Index (.IXIC.US)$ The Nasdaq soared to a 3% increase, and in the end, the S&P closed up by 1.7%, the Dow rose by nearly 1.3%, both reaching record closing highs, and the Nasdaq closed up by 2.5%, hitting a two-month high.

Some comments believe that the sharp rise in US stocks on Thursday stemmed from the unexpected drop to a four-month low in the number of initial jobless claims announced that day in the US, boosting investors' confidence in the Fed achieving a soft landing.
 Other comments suggest that Thursday's trend may more reflect the trading situation after Powell took over as Fed chair, rather than the monetary policy situation.
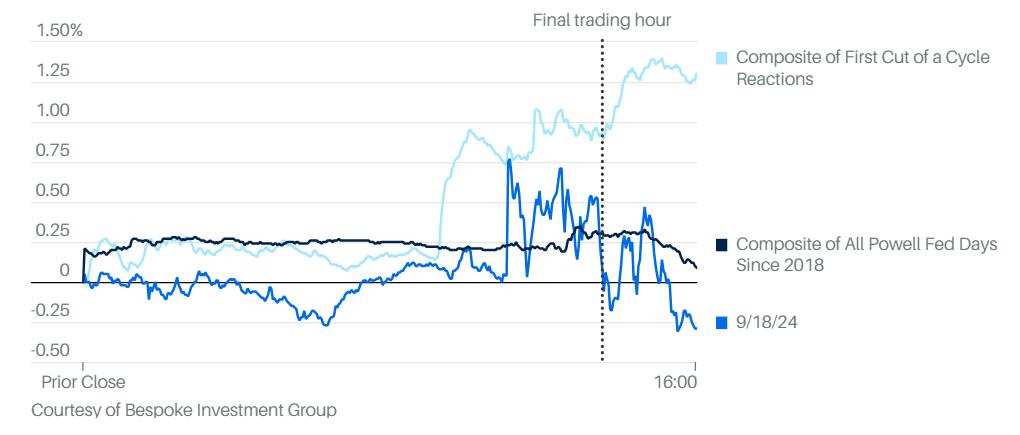
Paul Hickey, co-founder of the Bespoke Investment Group, stated that since Powell took office in 2018, there has been a common feature in the stock market trading on Fed decision days: a decline in the final hour of trading. In the past, when the Fed initiated rate cuts, the stock market had risen in the final hour of trading. However, this Wednesday followed the previous declining pattern.
Charlie Ashley, portfolio manager at Catalyst Funds, stated that the trends in US stocks and bonds on Wednesday following the Fed's announcement of rate cuts indicated market concerns about economic deterioration, which seemed different on Thursday. He pointed out that the immediate trends in the market after the Fed announces rate cuts are often unstable and irrational.
Experts in the options market have different views.
Founder of the options market analysis platform SpotGamma, Brent Kochuba, pointed out that after the Fed's FOMC monetary policy meeting, they found themselves in a very unique position: negative Gamma in the upward direction. This means that there are large positions in the market where traders are buying SPX call options, putting market makers in a position of negative Gamma chasing.$S&P 500 Index (.SPX.US)$Founder of the options market analysis platform SpotGamma, Brent Kochuba, pointed out that after the Fed's FOMC monetary policy meeting, they found themselves in a very unique position: negative Gamma in the upward direction. This means that there are large positions in the market where traders are buying SPX call options, putting market makers in a position of negative Gamma chasing.
Negative gamma means that market makers buy futures when the S&P index rises, and sell or short when it falls. Obviously, the FOMC meeting on Wednesday and its 50 basis point rate cut concentrated the market's momentum on the upside, with the primary target for the S&P at 5750 points.
The screenshot of the SpotGamma trading panel Trace below shows the prediction of the SPX market maker's hedging fund flow using a dedicated market maker position estimation by SpotGamma. The red color in the image represents negative gamma. This image simulates market makers holding a large number of short call option positions at 5675 and 5800. The execution price can be seen on the left side of the SpotGamma Trace image.
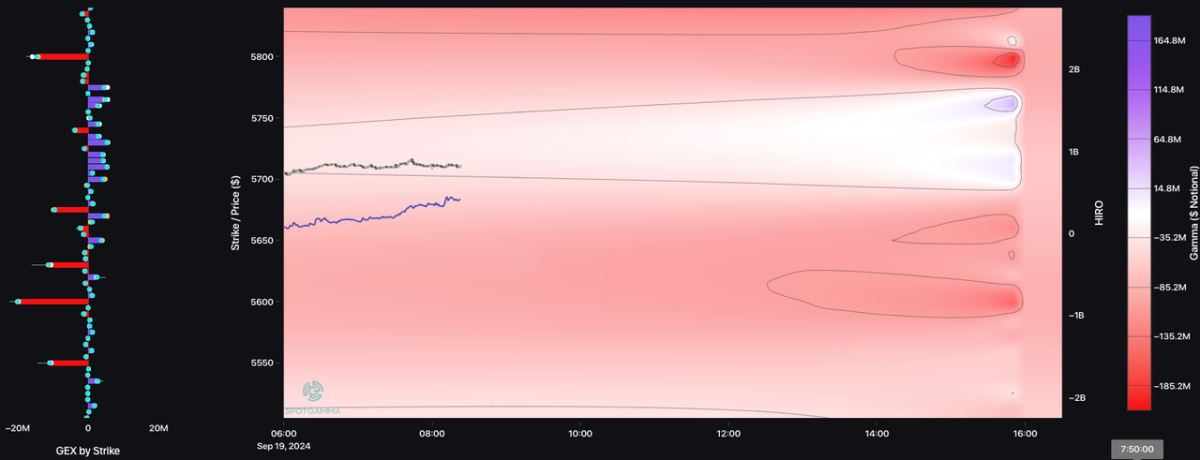
Specifically, for this Thursday, the blue color visible in the bottom chart shows that 5750 points is a 'local' short-term area of positive gamma. It is important to note that the blue color is concentrated at 4 p.m. Eastern Time and disappears after 4 p.m. This is because the main positive gamma on Thursday is driven by zero-day expiration (0DTE) positions, which expire at the close of the day.
Starting from early Thursday morning Eastern Time, the midday update shows a band of positive gamma above 5700 points, indicating market support at that level. SpotGamma indicates that this positive gamma is mostly driven by 0DTE positions, including 4000 short positions of 0DTE call options at a strike price of 5735.
These supportive market maker positions indicate that the s&p will rise to 5735 at the close, which is the white area on the chart at 4 p.m. Eastern Time in the USA. $SPDR S&P 500 ETF (SPY.US)$ $iShares Core S&P 500 ETF (IVV.US)$ $Vanguard S&P 500 ETF (VOO.US)$
September 20th, this Friday, is the expiration of a large number of stock index, individual stock, and ETF options, known as the Triple Witching Day. It is expected that this upward momentum in the stock market will have a significant impact when these options expire. The expiration of these options on Friday and next Monday may force long call positions to close and roll over, which could temporarily hinder the upward momentum. $SPDR Dow Jones Industrial Average Trust (DIA.US)$ $Invesco QQQ Trust (QQQ.US)$ $iShares Russell 2000 ETF (IWM.US)$

Editor/Rocky