
The Three-year Loss for Quaker Chemical (NYSE:KWR) Shareholders Likely Driven by Its Shrinking Earnings
The Three-year Loss for Quaker Chemical (NYSE:KWR) Shareholders Likely Driven by Its Shrinking Earnings
 Quaker Chemical saw its EPS decline at a compound rate of 6.0% per year, over the last three years. This reduction in EPS is slower than the 12% annual reduction in the share price. So it seems the market was too confident about the business, in the past.
 Many investors define successful investing as beating the market average over the long term. But if you try your hand at stock picking, you risk returning less than the market. We regret to report that long term Quaker Chemical Corporation (NYSE:KWR) shareholders have had that experience, with the share price dropping 31% in three years, versus a market return of about 20%.
很多投資者認爲,成功的投資是指長期超越市場平均水平。但是,如果你試圖挑選個股,你可能會面臨低於市場的風險。我們很遺憾地告訴大家,長期以來,Quaker Chemical Corporation (NYSE: KWR)的股東們已經有了這樣的經歷,股價在三年內下跌了31%,而市場回報率約爲20%。
While the stock has risen 5.0% in the past week but long term shareholders are still in the red, let's see what the fundamentals can tell us.
雖然該股票在過去一週上漲了5.0%,但長期股東仍然虧損,讓我們看看基本面能告訴我們什麼。
In his essay The Superinvestors of Graham-and-Doddsville Warren Buffett described how share prices do not always rationally reflect the value of a business. One imperfect but simple way to consider how the market perception of a company has shifted is to compare the change in the earnings per share (EPS) with the share price movement.
禾倫·巴菲特在他的文章《格雷厄姆與多德維爾的超級投資者》中描述了股票價格並不總是合理地反映了一家企業的價值。考慮市場對一家公司的看法如何轉變的一種不完美但簡單的方法,是將每股收益(EPS)的變化與股價的動態進行比較。
Quaker Chemical saw its EPS decline at a compound rate of 6.0% per year, over the last three years. This reduction in EPS is slower than the 12% annual reduction in the share price. So it seems the market was too confident about the business, in the past.
在過去三年中,Quaker Chemical的每股收益以6.0%的複合年增長率下降。與之相比,股價的年減少率爲12%。所以看起來市場對過去的業務過於自信了。
The company's earnings per share (over time) is depicted in the image below (click to see the exact numbers).
該公司的每股收益(隨時間的推移)如下圖所示(單擊可查看確切數字)。
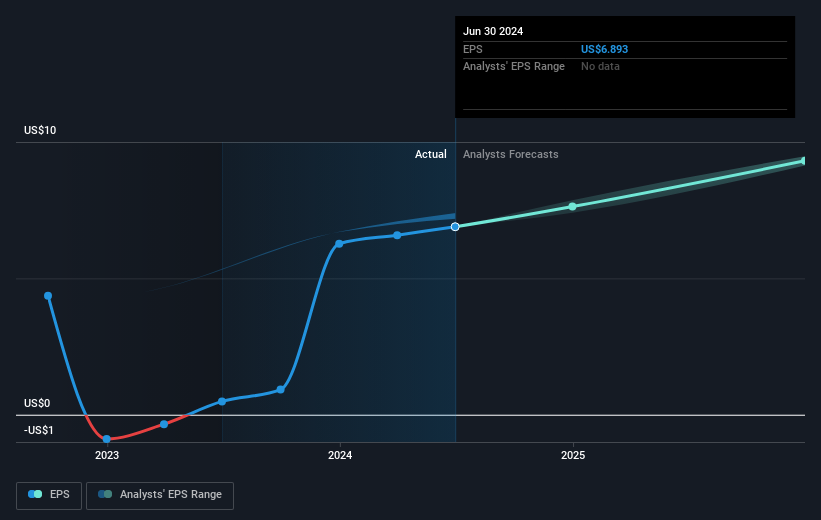
We know that Quaker Chemical has improved its bottom line lately, but is it going to grow revenue? This free report showing analyst revenue forecasts should help you figure out if the EPS growth can be sustained.
我們知道Quaker Chemical近來改善了其底線,但它是否能增加營業收入?這份顯示分析師營業收入預測的免費報告應該有助於您判斷EPS增長是否可持續。
What About Dividends?
那麼分紅怎麼樣呢?
As well as measuring the share price return, investors should also consider the total shareholder return (TSR). The TSR incorporates the value of any spin-offs or discounted capital raisings, along with any dividends, based on the assumption that the dividends are reinvested. Arguably, the TSR gives a more comprehensive picture of the return generated by a stock. In the case of Quaker Chemical, it has a TSR of -29% for the last 3 years. That exceeds its share price return that we previously mentioned. The dividends paid by the company have thusly boosted the total shareholder return.
除了衡量股價回報,投資者還應考慮股東總回報(TSR)。TSR結合了任何剝離或打折融資的價值,以及任何分紅,基於分紅再投資的假設。可以說,TSR提供了對股票產生的回報的更全面的圖片。在Quaker Chemical的情況下,過去3年的TSR爲-29%。這超過了我們之前提到的股價回報。公司支付的股利因此提高了股東的總回報。
A Different Perspective
不同的觀點
Quaker Chemical shareholders are up 7.7% for the year (even including dividends). Unfortunately this falls short of the market return. On the bright side, that's still a gain, and it's actually better than the average return of 3% over half a decade This suggests the company might be improving over time. Most investors take the time to check the data on insider transactions. You can click here to see if insiders have been buying or selling.
Quaker Chemical股東今年的回報率爲7.7%(包括股息)。不幸的是,這還不及市場回報。但好消息是,這仍然是一筆收益,而且實際上比過去半個十年的3%的平均回報更好。這表明公司可能隨着時間推移而改善。大多數投資者會花時間檢查內部交易數據。您可以在此處點擊查看內部人是否一直在購買或出售。
We will like Quaker Chemical better if we see some big insider buys. While we wait, check out this free list of undervalued stocks (mostly small caps) with considerable, recent, insider buying.
如果我們看到一些內部人員的大宗交易,我們會更喜歡喜力化工。在等待的時候,可以查看這份免費的低估股票名單(主要是小盤股),裏面有相當多最近的內部人員買入。
Please note, the market returns quoted in this article reflect the market weighted average returns of stocks that currently trade on American exchanges.
請注意,本文所引述的市場回報反映了目前在美國交易所上市的股票的市場加權平均回報。
Have feedback on this article? Concerned about the content? Get in touch with us directly. Alternatively, email editorial-team (at) simplywallst.com.
This article by Simply Wall St is general in nature. We provide commentary based on historical data and analyst forecasts only using an unbiased methodology and our articles are not intended to be financial advice. It does not constitute a recommendation to buy or sell any stock, and does not take account of your objectives, or your financial situation. We aim to bring you long-term focused analysis driven by fundamental data. Note that our analysis may not factor in the latest price-sensitive company announcements or qualitative material. Simply Wall St has no position in any stocks mentioned.
對本文有任何反饋?對內容有任何疑慮?請直接與我們聯繫。或者,發送電子郵件至editorial-team@simplywallst.com。
這篇文章是Simply Wall St的一般性文章。我們根據歷史數據和分析師預測提供評論,只使用公正的方法論,我們的文章並不意味着提供任何金融建議。文章不構成買賣任何股票的建議,也不考慮您的目標或您的財務狀況。我們的目標是帶給您基本數據驅動的長期關注分析。請注意,我們的分析可能不考慮最新的價格敏感公司公告或定性材料。Simply Wall St沒有任何股票頭寸。
譯文內容由第三人軟體翻譯。