
XPEL's (NASDAQ:XPEL) Five-year Earnings Growth Trails the 31% YoY Shareholder Returns
XPEL's (NASDAQ:XPEL) Five-year Earnings Growth Trails the 31% YoY Shareholder Returns
 During five years of share price growth, XPEL achieved compound earnings per share (EPS) growth of 40% per year. This EPS growth is higher than the 31% average annual increase in the share price. Therefore, it seems the market has become relatively pessimistic about the company.
 The worst result, after buying shares in a company (assuming no leverage), would be if you lose all the money you put in. But on the bright side, you can make far more than 100% on a really good stock. For example, the XPEL, Inc. (NASDAQ:XPEL) share price has soared 289% in the last half decade. Most would be very happy with that. It's also good to see the share price up 20% over the last quarter.
在沒有槓桿的情況下,購買一家公司的股票,最糟糕的結果是你會失去所有投入的資金。但好的一面是,你也可以在一隻真正好的股票上獲得超過100%的收益。例如,XPEL, Inc.(納斯達克:XPEL)的股價在過去的五年中飆升了289%。大多數人對此應該很滿意。同時,很高興看到股價在上個季度上漲了20%。
The past week has proven to be lucrative for XPEL investors, so let's see if fundamentals drove the company's five-year performance.
過去的一週對XPEL的投資者來說是賺錢的,所以讓我們看看基本面是否推動了公司的五年表現。
To quote Buffett, 'Ships will sail around the world but the Flat Earth Society will flourish. There will continue to be wide discrepancies between price and value in the marketplace...' One way to examine how market sentiment has changed over time is to look at the interaction between a company's share price and its earnings per share (EPS).
引用巴菲特的話,「船隻會在世界各地航行,但扁平地球協會將空前盛行。市場上的價格和價值將繼續存在巨大差異… 」檢查市場情緒如何隨時間變化的一種方法是查看公司的股價與每股收益(EPS)之間的互動。
During five years of share price growth, XPEL achieved compound earnings per share (EPS) growth of 40% per year. This EPS growth is higher than the 31% average annual increase in the share price. Therefore, it seems the market has become relatively pessimistic about the company.
在股價增長的五年中,XPEL實現了每股收益(EPS)年均增長40%。這種每股收益的增長高於股價年均增長31%。因此,市場對該公司變得相對悲觀。
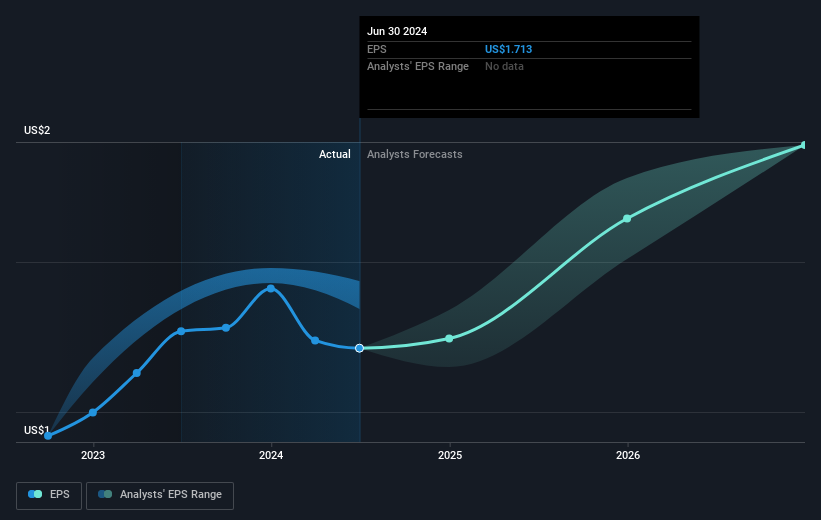
The company's earnings per share (over time) is depicted in the image below (click to see the exact numbers).
該公司的每股收益(隨時間的推移)如下圖所示(單擊可查看確切數字)。
We're pleased to report that the CEO is remunerated more modestly than most CEOs at similarly capitalized companies. It's always worth keeping an eye on CEO pay, but a more important question is whether the company will grow earnings throughout the years. It might be well worthwhile taking a look at our free report on XPEL's earnings, revenue and cash flow.
我們很高興地報告,CEO的薪酬比同樣資本化的公司的大多數CEO要適度。關注CEO的薪酬總是值得的,但更重要的問題是公司是否會在未來幾年中實現盈利增長。查看我們關於XPEL的收益、營業收入和現金流的免費報告可能非常值得。
A Different Perspective
不同的觀點
While the broader market gained around 27% in the last year, XPEL shareholders lost 42%. However, keep in mind that even the best stocks will sometimes underperform the market over a twelve month period. Longer term investors wouldn't be so upset, since they would have made 31%, each year, over five years. It could be that the recent sell-off is an opportunity, so it may be worth checking the fundamental data for signs of a long term growth trend. I find it very interesting to look at share price over the long term as a proxy for business performance. But to truly gain insight, we need to consider other information, too. For example, we've discovered 1 warning sign for XPEL that you should be aware of before investing here.
儘管整個市場在過去一年中的增長約爲27%,XPEL股東損失了42%。然而,要記住,即使是最好的股票有時也會在12個月的時間內跑輸市場。從長期投資者的角度來看,他們不會那麼沮喪,因爲在五年中,他們每年都能獲得31%的回報。目前的拋售可能是一個機會,所以值得檢查基本數據,看是否存在長期增長趨勢的跡象。我發現長期的股價作爲業務績效的替代指標非常有趣。但要真正獲得洞察力,我們還需要考慮其他信息。例如,在此之前,我們已經發現了一個XPEL的警示信號,您在投資之前應該知道。
We will like XPEL better if we see some big insider buys. While we wait, check out this free list of undervalued stocks (mostly small caps) with considerable, recent, insider buying.
如果我們看到一些重大的內部買入交易,我們會更青睞XPEL。在我們等待的時候,請查看這個免費的被低估股票列表(主要是小盤股),其中包含相當數量的近期內部買入交易。
Please note, the market returns quoted in this article reflect the market weighted average returns of stocks that currently trade on American exchanges.
請注意,本文所引述的市場回報反映了目前在美國交易所上市的股票的市場加權平均回報。
Have feedback on this article? Concerned about the content? Get in touch with us directly. Alternatively, email editorial-team (at) simplywallst.com.
This article by Simply Wall St is general in nature. We provide commentary based on historical data and analyst forecasts only using an unbiased methodology and our articles are not intended to be financial advice. It does not constitute a recommendation to buy or sell any stock, and does not take account of your objectives, or your financial situation. We aim to bring you long-term focused analysis driven by fundamental data. Note that our analysis may not factor in the latest price-sensitive company announcements or qualitative material. Simply Wall St has no position in any stocks mentioned.
對本文有任何反饋?對內容有任何疑慮?請直接與我們聯繫。或者,發送電子郵件至editorial-team@simplywallst.com。
這篇文章是Simply Wall St的一般性文章。我們根據歷史數據和分析師預測提供評論,只使用公正的方法論,我們的文章並不意味着提供任何金融建議。文章不構成買賣任何股票的建議,也不考慮您的目標或您的財務狀況。我們的目標是帶給您基本數據驅動的長期關注分析。請注意,我們的分析可能不考慮最新的價格敏感公司公告或定性材料。Simply Wall St沒有任何股票頭寸。
譯文內容由第三人軟體翻譯。