
Investors Will Want CACI International's (NYSE:CACI) Growth In ROCE To Persist
Investors Will Want CACI International's (NYSE:CACI) Growth In ROCE To Persist
 0.11 = US$650m ÷ (US$6.8b - US$1.1b)
 Did you know there are some financial metrics that can provide clues of a potential multi-bagger? One common approach is to try and find a company with returns on capital employed (ROCE) that are increasing, in conjunction with a growing amount of capital employed. Put simply, these types of businesses are compounding machines, meaning they are continually reinvesting their earnings at ever-higher rates of return. Speaking of which, we noticed some great changes in CACI International's (NYSE:CACI) returns on capital, so let's have a look.
你知道有些財務指標可以提供一個潛在多倍收益的線索嗎?一種常見的方法是尋找ROCE(資本僱用回報率)逐漸增長且資本僱用量不斷增加的公司。簡單地說,這些類型的企業是複利機器,意味着他們不斷以更高的回報率再投資他們的收益。說到這個,我們注意到CACI國際(紐交所:CACI)的資本回報率有一些很大的變化,所以讓我們來看看。
Return On Capital Employed (ROCE): What Is It?
資本僱用回報率(ROCE)是什麼?
If you haven't worked with ROCE before, it measures the 'return' (pre-tax profit) a company generates from capital employed in its business. To calculate this metric for CACI International, this is the formula:
如果你以前沒有使用過ROCE,它衡量了公司從資本僱用中產生的「回報」(稅前利潤)。要計算CACI國際的這個指標,可以使用下面的公式:
Return on Capital Employed = Earnings Before Interest and Tax (EBIT) ÷ (Total Assets - Current Liabilities)
資產僱用回報率(ROCE)是指企業利潤,即企業稅前利潤除以企業投入的總資本(負債加股權)。如果ROCE高於企業財務成本的承受能力,那麼企業就會創造出更多的價值。
0.11 = US$650m ÷ (US$6.8b - US$1.1b) (Based on the trailing twelve months to June 2024).
0.11 = 65000 million美元 ÷(68億美元 - 11億美元)(根據截至2024年6月的過去十二個月計算)。
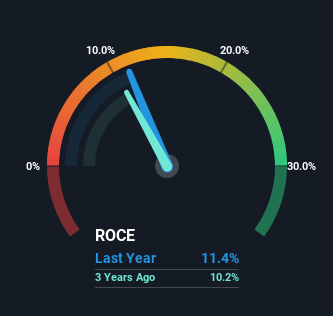
Therefore, CACI International has an ROCE of 11%. In absolute terms, that's a pretty standard return but compared to the Professional Services industry average it falls behind.
因此,CACI國際的ROCE爲11%。從絕對值來看,這是一個相當標準的回報率,但與專業服務行業平均水平相比稍顯不足。
In the above chart we have measured CACI International's prior ROCE against its prior performance, but the future is arguably more important. If you'd like to see what analysts are forecasting going forward, you should check out our free analyst report for CACI International .
在上面的圖表中,我們已經對CACI International之前的ROCE進行了衡量,但未來的情況可能更重要。如果你想看到分析師對未來的預測,請查看我們爲CACI International提供的免費分析師報告。
What Does the ROCE Trend For CACI International Tell Us?
CACI International的ROCE趨勢告訴我們什麼?
Investors would be pleased with what's happening at CACI International. The data shows that returns on capital have increased substantially over the last five years to 11%. The company is effectively making more money per dollar of capital used, and it's worth noting that the amount of capital has increased too, by 30%. The increasing returns on a growing amount of capital is common amongst multi-baggers and that's why we're impressed.
投資者對CACI International正在發生的事情將感到滿意。數據顯示,過去五年,資本回報率大幅增長至11%。公司有效地利用了更多資本獲利,並值得注意的是,資本金額也增加了30%。在增長的資本量上獲得不斷增長的回報在多倍增長者中很常見,這也是我們印象深刻的原因。
In Conclusion...
最後,同等資本下回報率較低的趨勢通常不是我們關注創業板股票的最佳信號。由於這些發展進行良好,因此投資者不太可能表現友好。自五年前以來,該股下跌了32%。除非這些指標朝着更積極的軌跡轉變,否則我們將繼續尋找其他股票。
To sum it up, CACI International has proven it can reinvest in the business and generate higher returns on that capital employed, which is terrific. And with the stock having performed exceptionally well over the last five years, these patterns are being accounted for by investors. So given the stock has proven it has promising trends, it's worth researching the company further to see if these trends are likely to persist.
總之,CACI International已經證明了其可以對業務進行再投資,並以更高的回報率利用該資本,這是非常好的。隨着股票在過去的五年中表現異常出色,投資者正在考慮到這些趨勢。所以鑑於該股票已經證明了它有值得期待的趨勢,進一步研究該公司以確定這些趨勢是否可能持續是值得的。
Like most companies, CACI International does come with some risks, and we've found 2 warning signs that you should be aware of.
和大多數公司一樣,CACI International也存在一些風險,我們發現了2個警示信號,你應該注意。
If you want to search for solid companies with great earnings, check out this free list of companies with good balance sheets and impressive returns on equity.
如果您想尋找財務狀況良好、回報卓越的實力強企業,可以免費查看以下公司列表。
Have feedback on this article? Concerned about the content? Get in touch with us directly. Alternatively, email editorial-team (at) simplywallst.com.
This article by Simply Wall St is general in nature. We provide commentary based on historical data and analyst forecasts only using an unbiased methodology and our articles are not intended to be financial advice. It does not constitute a recommendation to buy or sell any stock, and does not take account of your objectives, or your financial situation. We aim to bring you long-term focused analysis driven by fundamental data. Note that our analysis may not factor in the latest price-sensitive company announcements or qualitative material. Simply Wall St has no position in any stocks mentioned.
對本文有任何反饋?對內容有任何疑慮?請直接與我們聯繫。或者,發送電子郵件至editorial-team@simplywallst.com。
這篇文章是Simply Wall St的一般性文章。我們根據歷史數據和分析師預測提供評論,只使用公正的方法論,我們的文章並不意味着提供任何金融建議。文章不構成買賣任何股票的建議,也不考慮您的目標或您的財務狀況。我們的目標是帶給您基本數據驅動的長期關注分析。請注意,我們的分析可能不考慮最新的價格敏感公司公告或定性材料。Simply Wall St沒有任何股票頭寸。
譯文內容由第三人軟體翻譯。