
Investors More Bullish on Sally Beauty Holdings (NYSE:SBH) This Week as Stock Pops 11%, Despite Earnings Trending Downwards Over Past Year
Investors More Bullish on Sally Beauty Holdings (NYSE:SBH) This Week as Stock Pops 11%, Despite Earnings Trending Downwards Over Past Year
Passive investing in index funds can generate returns that roughly match the overall market. But one can do better than that by picking better than average stocks (as part of a diversified portfolio). To wit, the Sally Beauty Holdings, Inc. (NYSE:SBH) share price is 46% higher than it was a year ago, much better than the market return of around 24% (not including dividends) in the same period. If it can keep that out-performance up over the long term, investors will do very well! In contrast, the longer term returns are negative, since the share price is 22% lower than it was three years ago.
通過投資於指數基金,可以獲得與整體市場大致相當的回報。但是,通過挑選優於平均水平的股票(作爲多樣化的投資組合的一部分),可以獲得更好的回報。以紐交所股票代碼:SBH的莎莉美容控股公司(Sally Beauty Holdings, Inc.)爲例,其股價比一年前高出46%,遠遠優於同期市場回報率約24%(不包括股息)。如果它能在長期內保持這種超額表現,投資者將會表現出色!相比之下,從長期來看,回報率是負的,因爲股價比三年前下跌了22%。
Since the stock has added US$128m to its market cap in the past week alone, let's see if underlying performance has been driving long-term returns.
由於該股票在過去一週中市值增加了1.28億美元,讓我們看看背後的業績是否推動了長期回報。
While the efficient markets hypothesis continues to be taught by some, it has been proven that markets are over-reactive dynamic systems, and investors are not always rational. One imperfect but simple way to consider how the market perception of a company has shifted is to compare the change in the earnings per share (EPS) with the share price movement.
雖然一些人仍然相信有效市場假說,但已經證明市場是過度反應的動態系統,投資者並不總是理性的。一個不完美但簡單的方法來考慮公司市場看法的變化是比較每股收益(EPS)的變化和股價的波動。
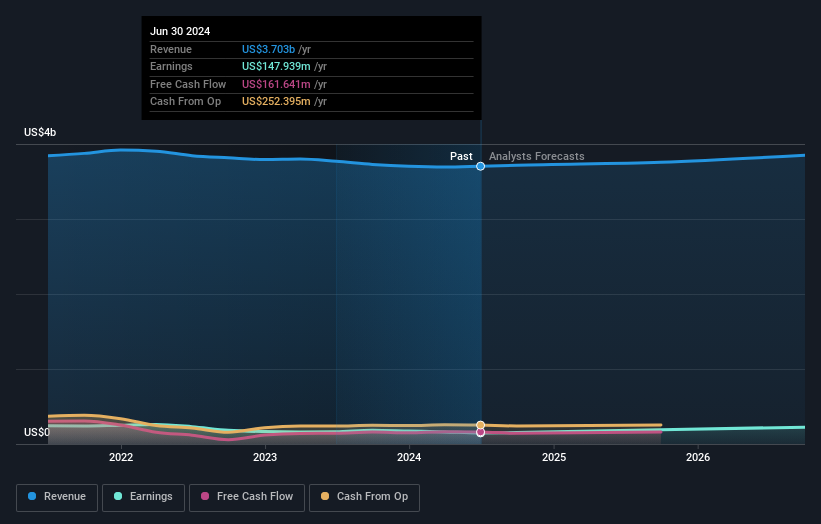
Over the last twelve months, Sally Beauty Holdings actually shrank its EPS by 7.6%.
在過去12個月中,莎莉美容控股公司(Sally Beauty Holdings)的每股收益實際上下降了7.6%。
This means it's unlikely the market is judging the company based on earnings growth. Therefore, it seems likely that investors are putting more weight on metrics other than EPS, at the moment.
這意味着市場不太可能根據收益增長來評估公司。因此,目前看來,投資者更加重視除每股收益之外的指標。
Revenue was pretty flat year on year, but maybe a closer look at the data can explain the market optimism.
營業收入去年同比基本持平,但可能進一步分析數據可以解釋市場的樂觀情緒。
You can see below how earnings and revenue have changed over time (discover the exact values by clicking on the image).
您可以看到以下收益和營收的變化情況(通過單擊圖像了解精確值)。
You can see how its balance sheet has strengthened (or weakened) over time in this free interactive graphic.
你可以在這個免費的互動圖表中看到它的資產負債表如何隨着時間的推移而加強(或削弱)。
A Different Perspective
不同的觀點
It's nice to see that Sally Beauty Holdings shareholders have received a total shareholder return of 46% over the last year. That certainly beats the loss of about 2% per year over the last half decade. We generally put more weight on the long term performance over the short term, but the recent improvement could hint at a (positive) inflection point within the business. I find it very interesting to look at share price over the long term as a proxy for business performance. But to truly gain insight, we need to consider other information, too. Even so, be aware that Sally Beauty Holdings is showing 1 warning sign in our investment analysis , you should know about...
很高興看到莎莉美容控股公司股東在過去一年中獲得了總股東回報率爲46%。這當然要比過去五年每年2%的虧損要好得多。我們通常更看重長期表現而非短期表現,但近期的改善可能暗示着業務內部的(積極)拐點。我發現長期股價作爲業務表現的一種代理非常有趣。但爲了真正獲得洞察力,我們還需要考慮其他信息。即便如此,請注意莎莉美容控股公司在我們的投資分析中顯示出1個警示信號,你應該了解一下...
For those who like to find winning investments this free list of undervalued companies with recent insider purchasing, could be just the ticket.
對於那些喜歡尋找獲勝投資的人來說,最近有內部購買的低估公司免費列表可能是一個很好的選擇。
Please note, the market returns quoted in this article reflect the market weighted average returns of stocks that currently trade on American exchanges.
請注意,本文所引述的市場回報反映了目前在美國交易所上市的股票的市場加權平均回報。
Have feedback on this article? Concerned about the content? Get in touch with us directly. Alternatively, email editorial-team (at) simplywallst.com.
This article by Simply Wall St is general in nature. We provide commentary based on historical data and analyst forecasts only using an unbiased methodology and our articles are not intended to be financial advice. It does not constitute a recommendation to buy or sell any stock, and does not take account of your objectives, or your financial situation. We aim to bring you long-term focused analysis driven by fundamental data. Note that our analysis may not factor in the latest price-sensitive company announcements or qualitative material. Simply Wall St has no position in any stocks mentioned.
對本文有任何反饋?對內容有任何疑慮?請直接與我們聯繫。或者,發送電子郵件至editorial-team@simplywallst.com。
這篇文章是Simply Wall St的一般性文章。我們根據歷史數據和分析師預測提供評論,只使用公正的方法論,我們的文章並不意味着提供任何金融建議。文章不構成買賣任何股票的建議,也不考慮您的目標或您的財務狀況。我們的目標是帶給您基本數據驅動的長期關注分析。請注意,我們的分析可能不考慮最新的價格敏感公司公告或定性材料。Simply Wall St沒有任何股票頭寸。
譯文內容由第三人軟體翻譯。