
Ideally, your overall portfolio should beat the market average. But every investor is virtually certain to have both over-performing and under-performing stocks. So we wouldn't blame long term Mativ Holdings, Inc. (NYSE:MATV) shareholders for doubting their decision to hold, with the stock down 51% over a half decade.
The recent uptick of 5.9% could be a positive sign of things to come, so let's take a look at historical fundamentals.
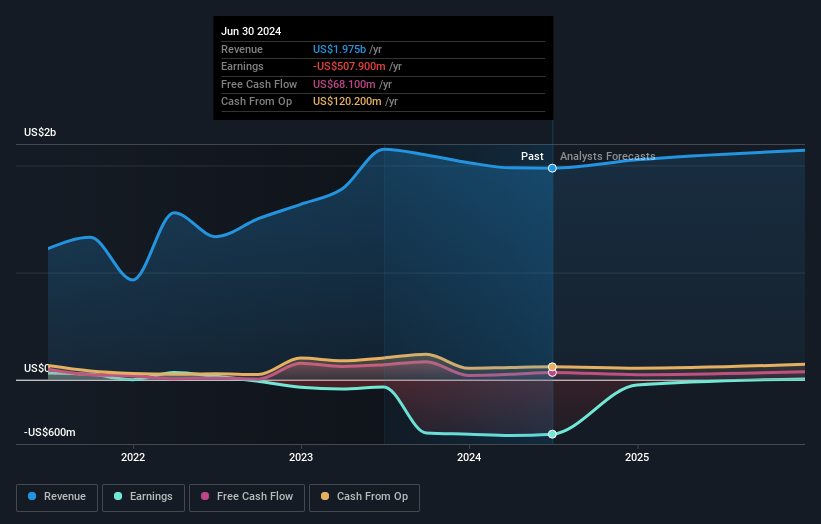
Given that Mativ Holdings didn't make a profit in the last twelve months, we'll focus on revenue growth to form a quick view of its business development. Generally speaking, companies without profits are expected to grow revenue every year, and at a good clip. As you can imagine, fast revenue growth, when maintained, often leads to fast profit growth.
Over five years, Mativ Holdings grew its revenue at 17% per year. That's better than most loss-making companies. In contrast, the share price is has averaged a loss of 9% per year - that's quite disappointing. This could mean high expectations have been tempered, potentially because investors are looking to the bottom line. Given the revenue growth we'd consider the stock to be quite an interesting prospect if the company has a clear path to profitability.
You can see how earnings and revenue have changed over time in the image below (click on the chart to see the exact values).
We like that insiders have been buying shares in the last twelve months. Even so, future earnings will be far more important to whether current shareholders make money. If you are thinking of buying or selling Mativ Holdings stock, you should check out this free report showing analyst profit forecasts.
What About Dividends?
When looking at investment returns, it is important to consider the difference between total shareholder return (TSR) and share price return. Whereas the share price return only reflects the change in the share price, the TSR includes the value of dividends (assuming they were reinvested) and the benefit of any discounted capital raising or spin-off. It's fair to say that the TSR gives a more complete picture for stocks that pay a dividend. As it happens, Mativ Holdings' TSR for the last 5 years was -37%, which exceeds the share price return mentioned earlier. This is largely a result of its dividend payments!
A Different Perspective
Mativ Holdings shareholders have received returns of 24% over twelve months (even including dividends), which isn't far from the general market return. To take a positive view, the gain is pleasing, and it sure beats annualized TSR loss of 7%, which was endured over half a decade. We're pretty skeptical of turnaround stories, but it's good to see the recent share price recovery. It's always interesting to track share price performance over the longer term. But to understand Mativ Holdings better, we need to consider many other factors. Case in point: We've spotted 4 warning signs for Mativ Holdings you should be aware of, and 1 of them is a bit unpleasant.
There are plenty of other companies that have insiders buying up shares. You probably do not want to miss this free list of undervalued small cap companies that insiders are buying.
Please note, the market returns quoted in this article reflect the market weighted average returns of stocks that currently trade on American exchanges.
Have feedback on this article? Concerned about the content? Get in touch with us directly. Alternatively, email editorial-team (at) simplywallst.com.
This article by Simply Wall St is general in nature. We provide commentary based on historical data and analyst forecasts only using an unbiased methodology and our articles are not intended to be financial advice. It does not constitute a recommendation to buy or sell any stock, and does not take account of your objectives, or your financial situation. We aim to bring you long-term focused analysis driven by fundamental data. Note that our analysis may not factor in the latest price-sensitive company announcements or qualitative material. Simply Wall St has no position in any stocks mentioned.