
Kirby's (NYSE:KEX) 34% CAGR Outpaced the Company's Earnings Growth Over the Same Three-year Period
Kirby's (NYSE:KEX) 34% CAGR Outpaced the Company's Earnings Growth Over the Same Three-year Period
It might seem bad, but the worst that can happen when you buy a stock (without leverage) is that its share price goes to zero. But if you buy shares in a really great company, you can more than double your money. For instance the Kirby Corporation (NYSE:KEX) share price is 140% higher than it was three years ago. Most would be happy with that. Better yet, the share price has risen 3.9% in the last week. But this could be related to the buoyant market which is up about 4.2% in a week.
買股票(不槓桿)最壞的情況就是股價降到零 但如果買入一家非常好的公司的股票,你可以將你的資金翻倍 比如,紐交所的卡比海運(NYSE:KEX)股價比三年前高出140% 大多數人會對此感到滿意 更好的是,股價在過去一週上漲了3.9% 但這可能與市場上漲了約4.2%有關
Since it's been a strong week for Kirby shareholders, let's have a look at trend of the longer term fundamentals.
由於這對卡比海運股東來說是一個強勁的一週,讓我們來看看長期基本面的趨勢。
There is no denying that markets are sometimes efficient, but prices do not always reflect underlying business performance. One imperfect but simple way to consider how the market perception of a company has shifted is to compare the change in the earnings per share (EPS) with the share price movement.
不可否認的是,市場有時是高效的,但價格並不總是反映潛在的商業表現。一個不完美但簡單的方法來考慮公司市場感知如何改變是比較每股收益(EPS)變化和股價變動。
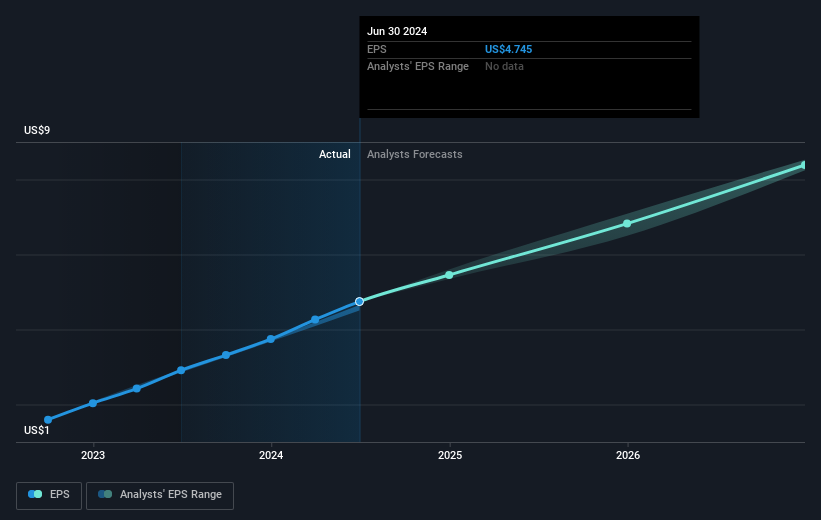
During three years of share price growth, Kirby achieved compound earnings per share growth of 72% per year. The average annual share price increase of 34% is actually lower than the EPS growth. So one could reasonably conclude that the market has cooled on the stock.
在股價增長的三年期間,卡比海運每年實現了72%的複合每股收益增長 平均每年股價增長34%實際上低於每股收益增長 因此可以合理地得出結論,市場對該股冷卻了。
The image below shows how EPS has tracked over time (if you click on the image you can see greater detail).
下圖顯示了EPS隨時間的變化情況(如果您單擊該圖像,則可以查看更多詳細信息)。
We know that Kirby has improved its bottom line over the last three years, but what does the future have in store? This free interactive report on Kirby's balance sheet strength is a great place to start, if you want to investigate the stock further.
我們知道卡比海運在過去三年裏改善了其底線,但未來會怎樣呢? 如果你想進一步調查該股票,這份關於卡比海運資產負債表實力的免費互動報告是一個很好的開始。
A Different Perspective
不同的觀點
It's nice to see that Kirby shareholders have received a total shareholder return of 41% over the last year. That's better than the annualised return of 8% over half a decade, implying that the company is doing better recently. Given the share price momentum remains strong, it might be worth taking a closer look at the stock, lest you miss an opportunity. I find it very interesting to look at share price over the long term as a proxy for business performance. But to truly gain insight, we need to consider other information, too. Even so, be aware that Kirby is showing 1 warning sign in our investment analysis , you should know about...
很高興看到卡比海運的股東在過去一年內獲得了總股東回報率爲41%。 這比過去半個世紀年化回報率8%要好,這意味着公司近期的業績更好。 鑑於股價勢頭依然強勁,值得更仔細地觀察這支股票,以免錯過機會。 我發現長期以來股價作爲業務表現的一種替代方式非常有趣。 但要真正獲得洞察力,我們還需要考慮其他信息。 即便如此,請注意,卡比海運在我們的投資分析中顯示出1個警示信號,你應該知道……
If you are like me, then you will not want to miss this free list of undervalued small caps that insiders are buying.
如果您像我一樣,就不會希望錯過這份免費的內部人士正在購買的低估小市值股票列表。
Please note, the market returns quoted in this article reflect the market weighted average returns of stocks that currently trade on American exchanges.
請注意,本文所引述的市場回報反映了目前在美國交易所上市的股票的市場加權平均回報。
Have feedback on this article? Concerned about the content? Get in touch with us directly. Alternatively, email editorial-team (at) simplywallst.com.
This article by Simply Wall St is general in nature. We provide commentary based on historical data and analyst forecasts only using an unbiased methodology and our articles are not intended to be financial advice. It does not constitute a recommendation to buy or sell any stock, and does not take account of your objectives, or your financial situation. We aim to bring you long-term focused analysis driven by fundamental data. Note that our analysis may not factor in the latest price-sensitive company announcements or qualitative material. Simply Wall St has no position in any stocks mentioned.
對本文有任何反饋?對內容有任何疑慮?請直接與我們聯繫。或者,發送電子郵件至editorial-team@simplywallst.com。
這篇文章是Simply Wall St的一般性文章。我們根據歷史數據和分析師預測提供評論,只使用公正的方法論,我們的文章並不意味着提供任何金融建議。文章不構成買賣任何股票的建議,也不考慮您的目標或您的財務狀況。我們的目標是帶給您基本數據驅動的長期關注分析。請注意,我們的分析可能不考慮最新的價格敏感公司公告或定性材料。Simply Wall St沒有任何股票頭寸。
譯文內容由第三人軟體翻譯。