
CorVel's (NASDAQ:CRVL) Five-year Earnings Growth Trails the Splendid Shareholder Returns
CorVel's (NASDAQ:CRVL) Five-year Earnings Growth Trails the Splendid Shareholder Returns
 During five years of share price growth, CorVel achieved compound earnings per share (EPS) growth of 12% per year. This EPS growth is lower than the 31% average annual increase in the share price. So it's fair to assume the market has a higher opinion of the business than it did five years ago. And that's hardly shocking given the track record of growth. This favorable sentiment is reflected in its (fairly optimistic) P/E ratio of 69.59.
 The most you can lose on any stock (assuming you don't use leverage) is 100% of your money. But on the bright side, you can make far more than 100% on a really good stock. For instance, the price of CorVel Corporation (NASDAQ:CRVL) stock is up an impressive 281% over the last five years. It's also good to see the share price up 27% over the last quarter.
假設您沒有使用槓桿,您在任何股票上所能失去的最多是您的全部資金的100%。但是好消息是,在一支真正優秀的股票上,您能賺取的利潤遠遠超過100%。例如,納斯達克上的CorVel公司(納斯達克股票代碼:CRVL)股價在過去五年裏大漲了驚人的281%。看到股價在最近一個季度上漲了27%,也是件好事。
Since it's been a strong week for CorVel shareholders, let's have a look at trend of the longer term fundamentals.
由於CorVel股東度過了一個強勁的一週,讓我們來看看更長期基本面的趨勢。
While the efficient markets hypothesis continues to be taught by some, it has been proven that markets are over-reactive dynamic systems, and investors are not always rational. By comparing earnings per share (EPS) and share price changes over time, we can get a feel for how investor attitudes to a company have morphed over time.
儘管一些人繼續教授有效市場假說,但已經證明市場是過度反應的動態系統,並且投資者並不總是理性的。通過比較每股收益(EPS)和股價的變化情況,我們可以了解投資者對公司的態度如何隨着時間變化而變化。
During five years of share price growth, CorVel achieved compound earnings per share (EPS) growth of 12% per year. This EPS growth is lower than the 31% average annual increase in the share price. So it's fair to assume the market has a higher opinion of the business than it did five years ago. And that's hardly shocking given the track record of growth. This favorable sentiment is reflected in its (fairly optimistic) P/E ratio of 69.59.
在股價增長的五年裏,CorVel實現了每股收益(EPS)的複合增長率爲12%。這一EPS增長率低於股價的平均年增長率31%。因此可以合理地假設市場對該企業的看法高於五年前。考慮到增長記錄,這並不令人意外。這種良好的情緒反映在它(相當樂觀的)市盈率爲69.59。
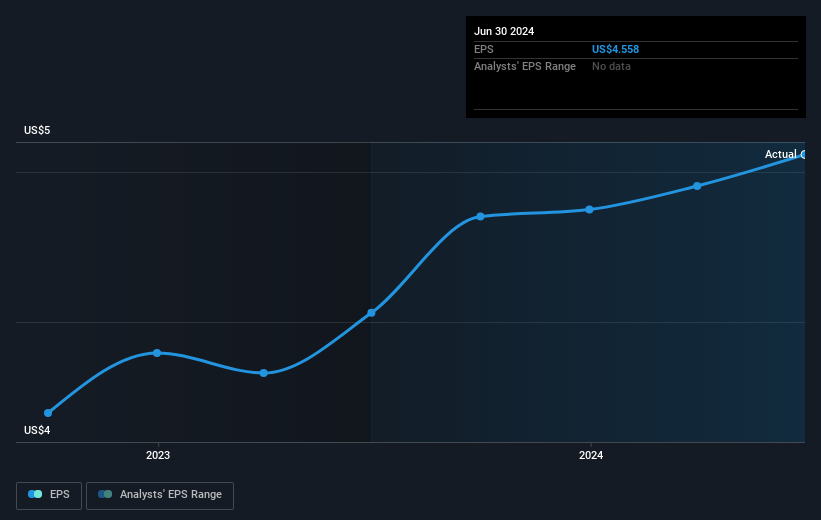
The company's earnings per share (over time) is depicted in the image below (click to see the exact numbers).
該公司的每股收益(隨時間的推移)如下圖所示(單擊可查看確切數字)。
It's probably worth noting that the CEO is paid less than the median at similar sized companies. But while CEO remuneration is always worth checking, the really important question is whether the company can grow earnings going forward. This free interactive report on CorVel's earnings, revenue and cash flow is a great place to start, if you want to investigate the stock further.
值得注意的是,CEO的薪酬低於類似規模公司的中位數。但是,CEO的報酬雖然值得核實,但真正重要的問題是公司能否實現盈利增長。如果你想進一步調查這家公司的股票,CorVel的收入、營業收入和現金流的免費互動報告是一個很好的起點。
A Different Perspective
不同的觀點
It's nice to see that CorVel shareholders have received a total shareholder return of 59% over the last year. That's better than the annualised return of 31% over half a decade, implying that the company is doing better recently. In the best case scenario, this may hint at some real business momentum, implying that now could be a great time to delve deeper. While it is well worth considering the different impacts that market conditions can have on the share price, there are other factors that are even more important. Case in point: We've spotted 1 warning sign for CorVel you should be aware of.
很高興看到CorVel的股東在過去一年裏獲得了59%的總股東回報。這比過去半個世紀年化收益率31%強,意味着公司最近表現更好。在最好的情況下,這可能暗示着一些真正的業務勢頭,這也許是一個深入了解的好時機。雖然值得考慮市場狀況對股價可能產生的不同影響,但還有更重要的因素。舉例來說:我們發現了CorVel的1個警示標誌,你應該注意。
Of course, you might find a fantastic investment by looking elsewhere. So take a peek at this free list of companies we expect will grow earnings.
當然,您可能在其他地方找到一家出色的企業進行投資。因此,請查看我們預計將實現盈利增長的公司的免費列表。
Please note, the market returns quoted in this article reflect the market weighted average returns of stocks that currently trade on American exchanges.
請注意,本文所引述的市場回報反映了目前在美國交易所上市的股票的市場加權平均回報。
Have feedback on this article? Concerned about the content? Get in touch with us directly. Alternatively, email editorial-team (at) simplywallst.com.
This article by Simply Wall St is general in nature. We provide commentary based on historical data and analyst forecasts only using an unbiased methodology and our articles are not intended to be financial advice. It does not constitute a recommendation to buy or sell any stock, and does not take account of your objectives, or your financial situation. We aim to bring you long-term focused analysis driven by fundamental data. Note that our analysis may not factor in the latest price-sensitive company announcements or qualitative material. Simply Wall St has no position in any stocks mentioned.
對本文有任何反饋?對內容有任何疑慮?請直接與我們聯繫。或者,發送電子郵件至editorial-team@simplywallst.com。
這篇文章是Simply Wall St的一般性文章。我們根據歷史數據和分析師預測提供評論,只使用公正的方法論,我們的文章並不意味着提供任何金融建議。文章不構成買賣任何股票的建議,也不考慮您的目標或您的財務狀況。我們的目標是帶給您基本數據驅動的長期關注分析。請注意,我們的分析可能不考慮最新的價格敏感公司公告或定性材料。Simply Wall St沒有任何股票頭寸。
譯文內容由第三人軟體翻譯。
